

For research use only. Not for use in diagnostic procedures.
- Main
-
For research use only. Not for use in diagnostic procedures.
Marisa Herrera, Sophia Kenrick
Waters Corporation, United States
Published on August 14, 2026
For research use only. Not for use in diagnostic procedures.
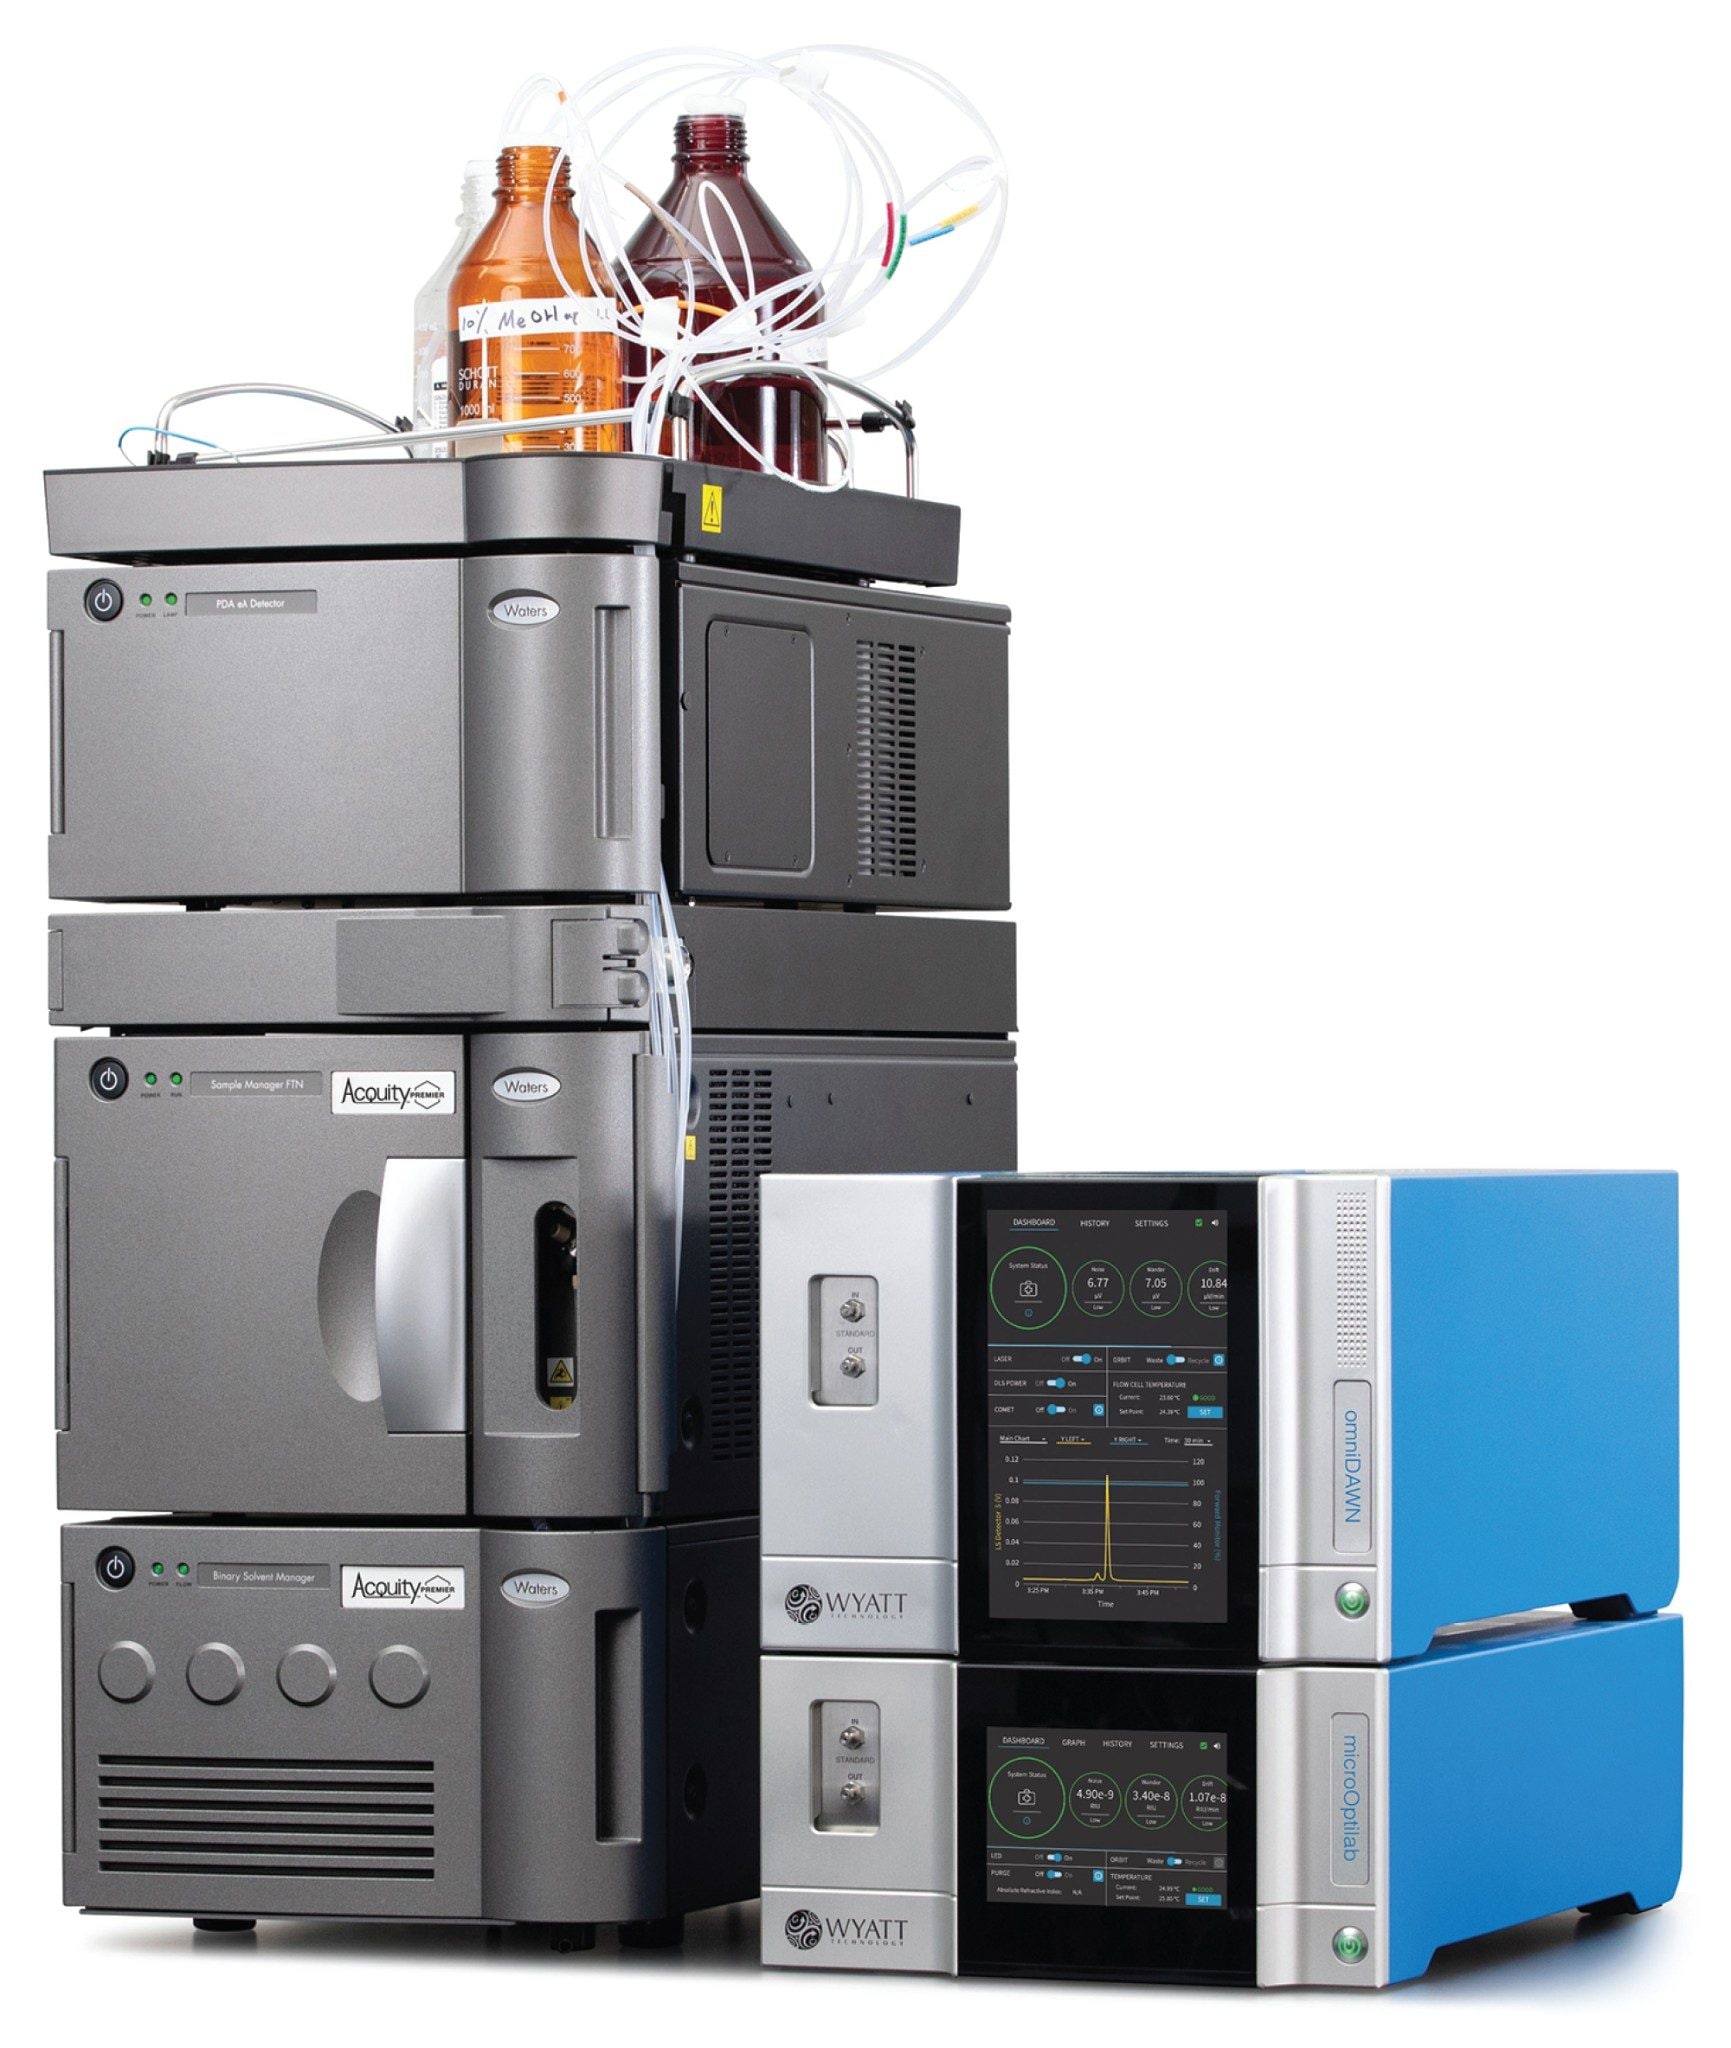
Ultra performance liquid chromatography (UPLC™) can result in narrow peaks that are incompatible with standard HPLC Detectors. Large internal detector volumes lead to dispersion which can result in the loss of sample resolution. The omniDAWN™ multi-angle light scattering (MALS) Photometer brings the robustness and sensitivity of a DAWN MALS Detector to a UPLC configuration without sacrificing data quality. The combination of MALS detection using the omniDAWN Photometer with UV and differential refractive index detectors provides reliable quantitation of molar mass, size, conjugation, and other quality attributes for peaks as narrow as 35 µL. This application note demonstrates the performance of the omniDAWN Detector downstream of the ACQUITY™ Premier UPLC System and ACQUITY Premier Protein SEC Columns (250 Å, 1.7 µm, 4.6 x 300 mm).
UPLC enables fast, efficient separation of biomolecular samples. Compared to size-exclusion chromatography (SEC) using standard HPLC, UPLC-SEC provides improved resolution, higher throughput, and lower solvent and sample consumption for analysis of precious biological samples. The optimized internal volume of the omniDAWN Detector paired with the traditional 18-angles of the DAWN Photometer allows it to be implemented easily into UPLC methods without compromising sensitivity or dynamic range. When combined with the microOptilab™ refractive index (RI) Detector and UV absorption at one or more wavelengths, the full suite of biophysical characterization with SEC-MALS can be made available to a UPLC platform.
Although the microDAWN MALS Detector has been successfully applied to the quantitation of proteins and small polymers with UPLC,1-3 the three detector angles limited the applicability for many analytes. The 18-angles of the omniDAWN Detector enable robust and accurate size and molar mass measurements for species with molar mass up to 109 g/mol. When combined with UV and RI detection, all the enhanced analyses available in the ASTRA™ Software can be accessed for UPLC data. This enables robust quantification of adeno-associated viruses (AAV) and their aggregates, polysaccharide and protein-polysaccharide conjugates, lipid nanoparticles, branched polymers, and more.
Bovine serum albumin (BSA; Fisher Scientific®) was dissolved to 5 mg/mL, 0.10 mg/mL and 0.01 mg/mL in phosphate buffered saline (PBS) and filtered to 0.02 µm. BSA was injected at various amounts ranging from 100 ng to 10 µg, with five replicates each.
UPLC-SEC-MALS was performed using an ACQUITY Premier UPLC System from Waters Corporation. The system included a binary solvent manager (BSM) and a sample manager with flow through needle (FTN). Separation was achieved using an ACQUITY Premier Protein SEC Column (250 Å, 1.7 µm, 4.6 mm x 300 mm). Detection was achieved using an eλPDA UV, omniDAWN MALS Detector, and microOptilab RI Detector.
HPLC SEC-MALS data was collected for the same samples under the same conditions. BSA was separated using an XBridge™ Premier Protein SEC Column (250 Å, 2.5 µm, 7.8 mm x 300 mm) and a WTC-030S5 Column (300 Å, 5 µm, 7.8 mm x 300 mm). A DAWN MALS Detector and Optilab dRI Detector were used to determine molar mass.
Injections were made under the control of HPLC CONNECT™ Software. Data were collected and analyzed in ASTRA Software. A refractive index increment (dn/dc) value of 0.185 mL/g and a UV extinction coefficient value of 0.667 mL mg‑1 cm‑1 were used for the analysis.
|
System: |
ACQUITY Premier System with Binary Solvent Manager (BSM) and Flow-Through Needle Sample Manager (SM-FTN) |
|
Column: |
ACQUITY Premier Protein SEC Column (250 Å, 1.7 µm, 4.6 mm x 300 mm) |
|
Mobile phase: |
Phosphate buffered saline (PBS): 25 mM Na2HPO4, 25 mM NaH2PO4, 50 mM NaCl, 200 ppm NaN3 |
|
UV detector: |
ACQUITY Premier PDA eλ Detector |
|
UV wavelength: |
280 nm |
|
MALS detector: |
omniDAWN Detector |
|
dRI detector: |
microOptilab Detector |
|
LC system control: |
HPLC CONNECT Software |
|
Data acquisition and analysis: |
ASTRA Software |
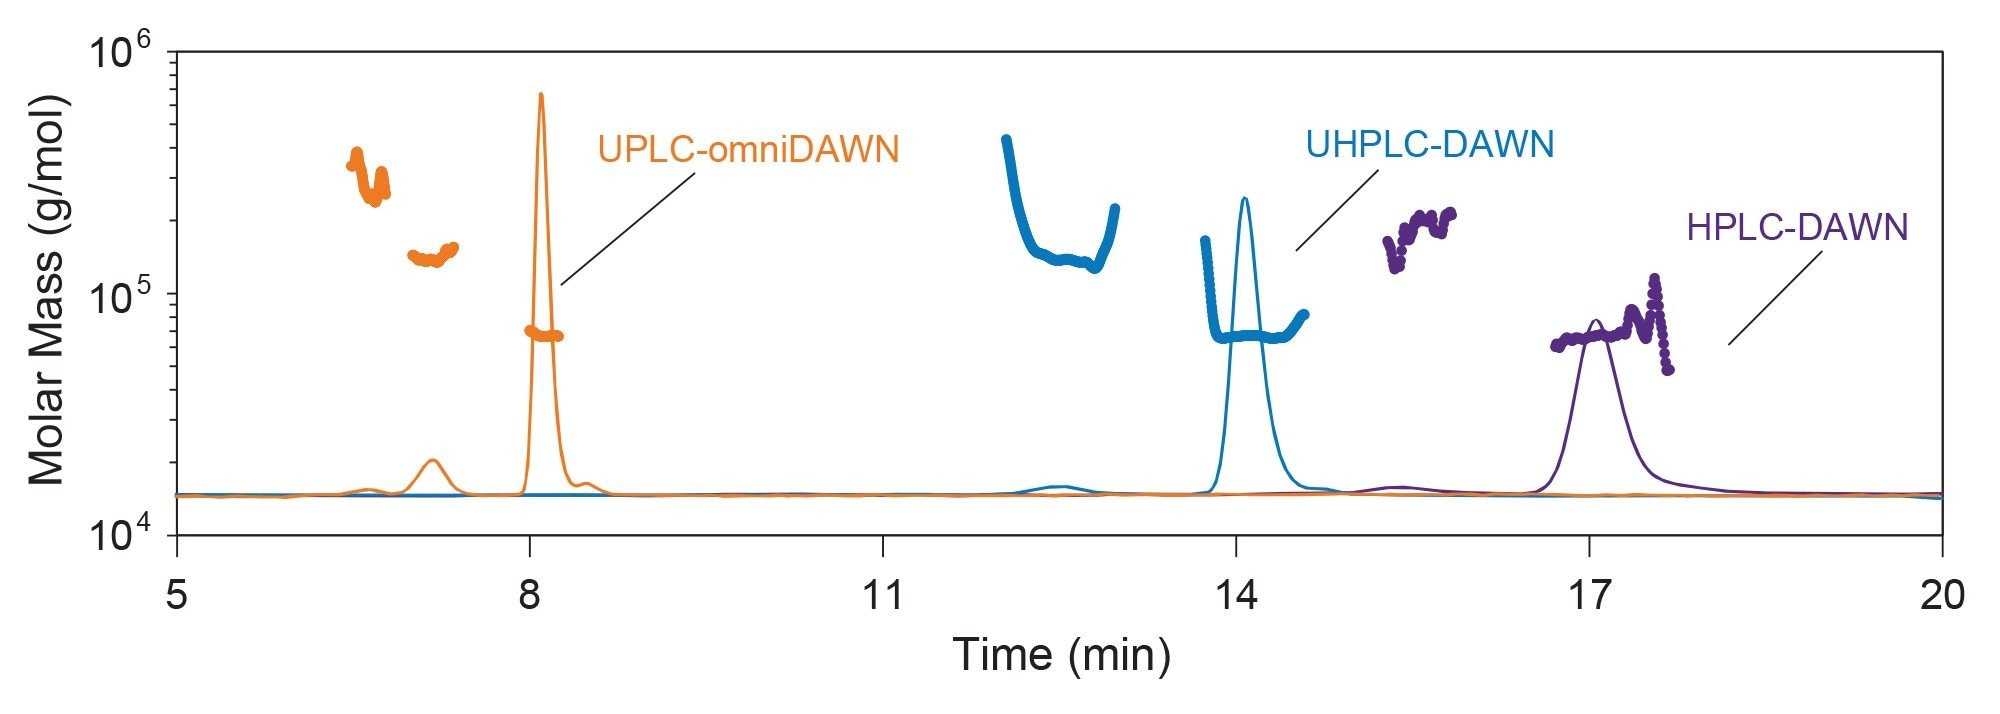
The UPLC configuration compatible with the omniDAWN Instrument enabled injections to be completed in under 10 minutes, compared with the 20 minutes or more typically required for HPLC analysis. The chromatograms and measured molar mass for the same amount of BSA (1 µg) eluting from a UPLC Column (1.7 µm, 4.6 mm x 300 mm), ultra-high performance liquid chromatography (UHPLC) Column (2.5 µm, 7.8 mm x 300 mm), and HPLC Column (5 µm, 7.8 mm x 300 mm) are shown in Figure 1 with results tabulated in Table 1. Not only does the UPLC Column provide results in half the time compared to the other two columns, but the eluting species undergo less dilution. This means that rare species, like trimers and higher order structures, are more easily detected and quantified.
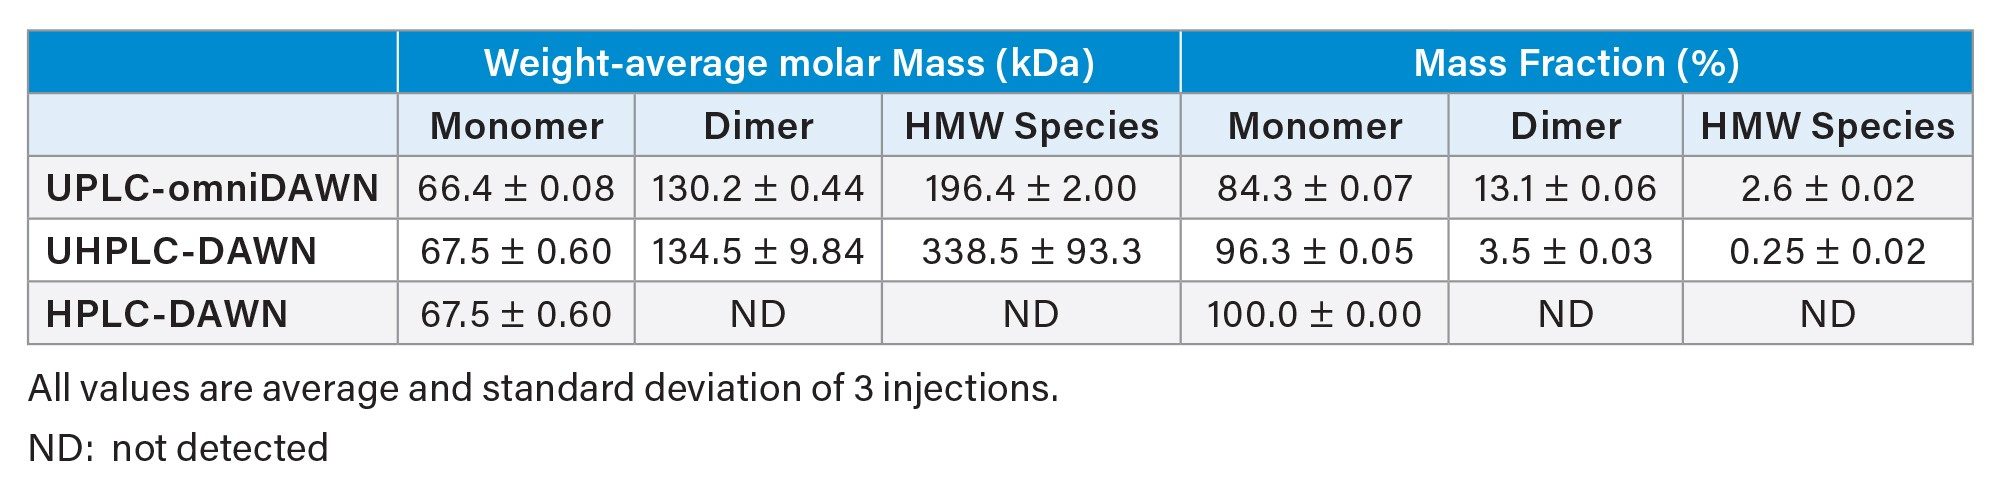
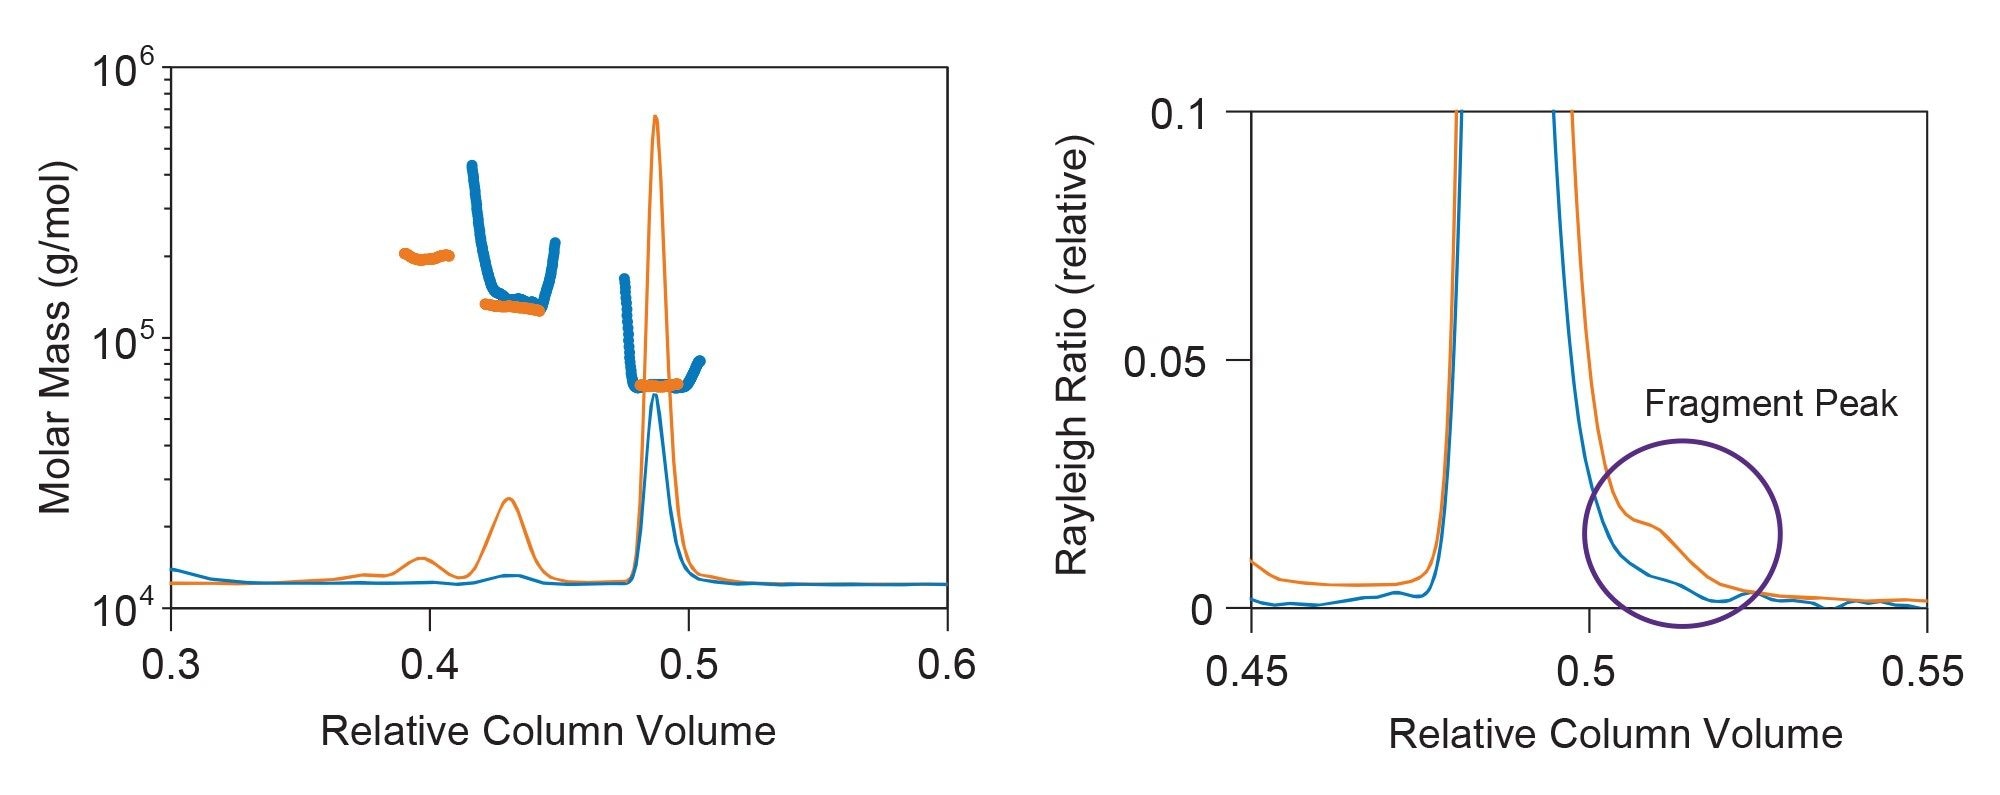
Importantly, the molar mass results from the omniDAWN Instrument are of the same accuracy and reproducibility as compared to traditional HPLC Column configurations with a DAWN Instrument. Figure 3 shows the results from the UPLC Column and UHPLC Column in Figure 2, rescaled as a function of relative column volume for easier comparison. Both the omniDAWN Instrument configuration and DAWN Instrument configuration easily quantify the molar mass and abundance of the monomer and dimer peaks. However, under these conditions, the HMW species peak is only detected and quantified accurately with the omniDAWN Instrument in the UPLC configuration (orange). With the DAWN Instrument configuration (blue), the peak is detected, but the signal:noise (S/N) ratio is too low for accurate quantitation. In addition, the BSA fragment peaks are resolved and quantified by UPLC-MALS but not HPLC-MALS as shown in Figure 3 (right).
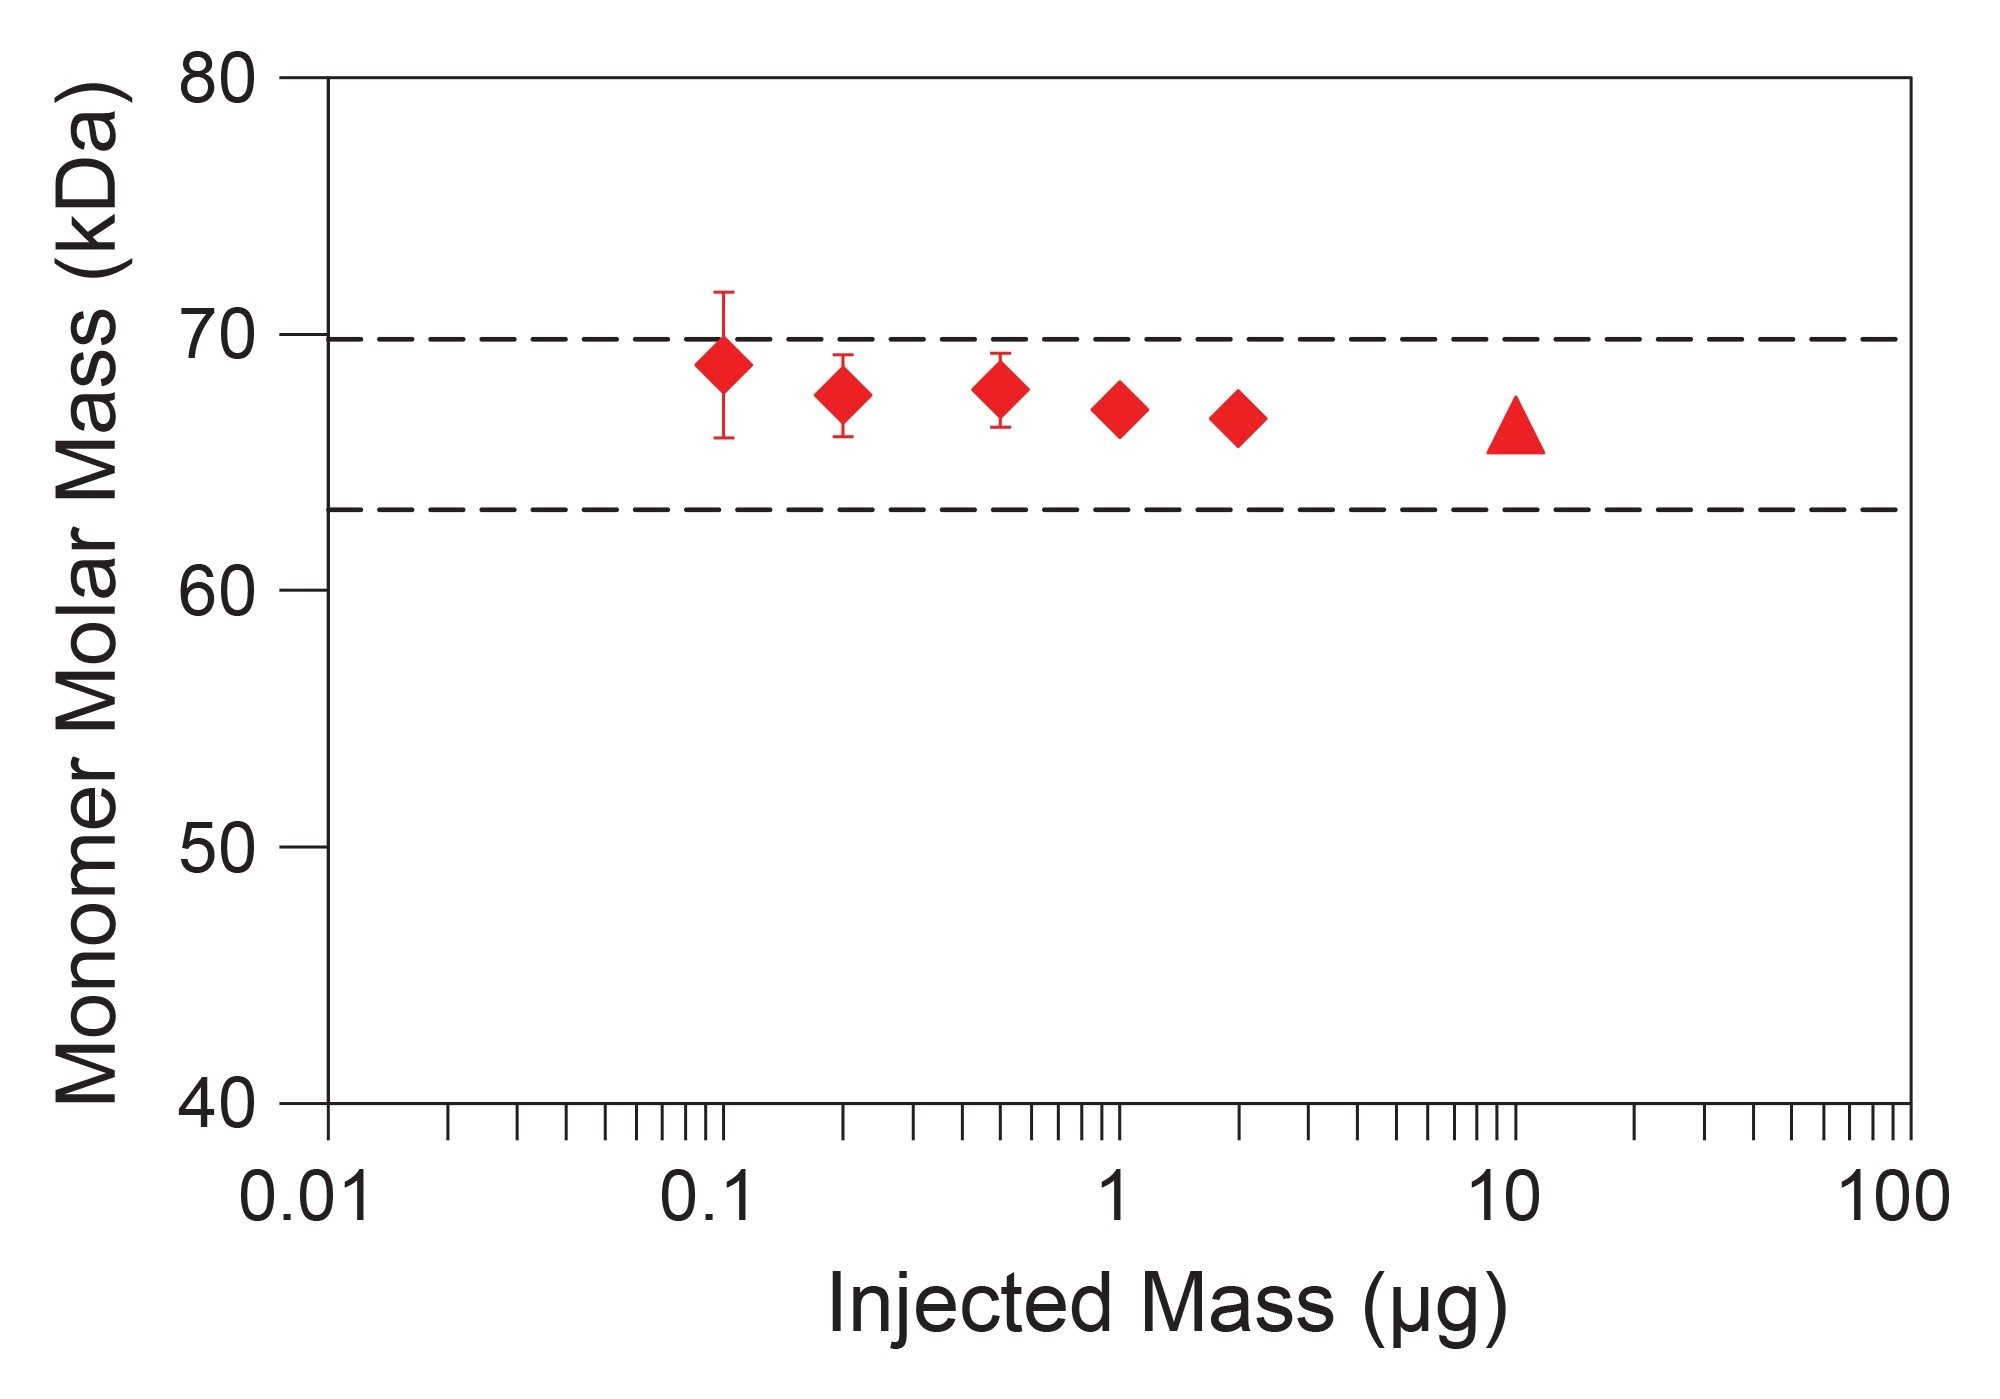
Since UPLC provides less dilution and broadening compared to HPLC, the omniDAWN Photometer can provide accurate and robust monomer molar mass results for BSA results across with the same or better sensitivity compared to the DAWN Instrument with standard HPLC. Across all the data points tested, the weight-average molar mass (Mw) was 67.4 ± 0.80 kDa. For each injection amount, the relative standard deviation (RSD) was <2% (Figure 4). This level of repeatability provides confidence in the detection and quantification of minor species and enables advanced calculations, like the ADC analysis methods in the ASTRA Software.
The omniDAWN MALS Photometer combined with UPLC separation, like the ACQUITY Premier Protein Columns, enables researchers to retain the full analytical capabilities of the DAWN MALS Photometer and ASTRA Software while providing increased sensitivity, resolution, and speed of UPLC. Applications that were limited in UPLC configurations before can now be applied with the omniDAWN photometer, including AAV aggregate analysis, conjugate analysis, branching analysis, and more. The ease of use of the omniDAWN Instrument ensures that researchers and pharmaceutical manufacturers can transition or integrate the instrument into existing UPLC methods without compromising data quality or workflow efficiency.
Yang, Y.; et al. A Tetravalent Bispecific Antibody Selectively Inhibits Diverse FGFR3 Oncogenic Variants. Cancer Res. 2024, 84, 2169–2180.
Martini, C.; et al. Unraveling the crystal structure of the HpaA adhesin: insights into cell adhesion function and epitope localization of a Helicobacter pylori vaccine candidate. mBio 2024, 15, e02952-23.
Hsieh, V. H.; Wyatt, P. J. Measuring proteins with greater speed and resolution while reducing sample size. Scientific Reports 2017, 7, 10030.
720009558, August 2026


