
Confidence in Chromatography: Demonstrating Highly Reproducible HPLC-CAD Performance with Waters Charged Aerosol Detectors
Jennifer Simeone, Paula Hong
Waters Corporation, United States
Published on July 10, 2026

Abstract
Charged aerosol detectors (CADs) are increasingly used with HPLC for the analysis of non-volatile and semi-volatile compounds that are not readily detected by conventional UV methods. It has broad applicability across analyte classes which has made it a valuable tool in pharmaceutical and biopharmaceutical research, development, and quality control. However, routinely running HPLC-CAD methods across instrument platforms that use different CAD modules can introduce variability. This challenge is unique for CAD because detector response depends on nebulization of the LC effluent and changes in aerosol formation, gas delivery, mobile phase composition, or nebulizer condition can affect signal reproducibility. With these challenges in mind, this application note highlights the high level of repeatability that can be achieved across Waters CADs.
Benefits
- Repeatable and robust quantitative method performance across CAD modules, enabling consistent results for routine operation
- Optimized nebulizer design for low inter-CAD response variability, providing greater confidence in data generated using CAD
- Low variability in CAD response over time, providing reliable and consistent results for routine methods
Introduction
The use of CAD with HPLC has become increasingly widespread in both pharmaceutical and biopharmaceutical analysis as it provides sensitive, near-universal detection for many non-volatile and semi-volatile analytes that lack strong chromophores and are therefore difficult to measure by conventional UV methods.1–3 In current practice, HPLC-CAD is commonly applied to the analysis of excipients, lipids, surfactants, carbohydrates, impurities, degradation products, and other structurally diverse compounds in research, development, and quality control settings. As a result, CAD is now widely regarded as a valuable complementary detector for methods in which optical detection alone may not provide adequate coverage of all relevant sample components.
Reproducibility of nebulization-based detectors is a practical consideration when using CAD. Because CAD relies on nebulization as the first step in signal generation, reproducibility is directly influenced by how consistently the LC effluent is converted into a stable aerosol. Consistent droplet formation is therefore critical, since changes in droplet size distribution, nebulizer efficiency, gas flow, mobile phase composition, and evaporation conditions can affect the amount of analyte transferred into the detectable aerosol phase. For these reasons, aerosol-based detectors such as CAD are inherently more sensitive to conditions that influence reproducibility than optical detectors such as UV.
In addition to the technical operation of CAD, small differences in solvent cleanliness, mobile phase preparation, volatile additive concentration, detector gas supply, and nebulizer condition may also contribute to changes in absolute response. This is especially important for low-level components, where small changes in aerosol generation can have a proportionally larger impact on peak area or peak height. However, when method conditions are well controlled and detector operating parameters are consistently applied, reproducible quantitative performance can be achieved across different CAD modules.
Experimental
Sample Preparation
All samples and mobile phases were prepared according to the United States Pharmacopeia (USP) monograph for deoxycholic acid assay and organic impurities.4 The method was scaled from the monograph prescribed 3 µm column to a 3.5 µm column using the Waters Columns Calculator.
Deoxycholic acid reference standard (RS) (catalog # 1171273) and cholic acid RS (catalog # 1133503) were obtained from USP. Deoxycholic acid sample was obtained from Sigma Aldrich (product # D2510-10G). LC/MS grade formic acid (catalog # 60-048-227) and LC/MS Grade acetonitrile (catalog # LC015-4) were obtained from Fisher Scientific. Samples were prepared as follows: Stocks for deoxycholic acid RS, cholic acid RS, and deoxycholic acid sample were prepared at 1 mg/mL in 80:20 methanol:water. Standard solutions for deoxycholic acid RS, cholic acid RS and deoxycholic acid sample were further diluted to 0.010 mg/mL in 80:20 methanol:water. Deoxycholic acid sensitivity solution was prepared from the standard (0.010 mg/mL) at a final concentration of 5 µg/mL in 80:20 methanol:water.
LC Conditions
|
LC systems: |
ACQUITY™ UPLC™ H-Class (QSM) System with Waters CAD ACQUITY Arc™ System with Waters CAD |
|
Detection: |
Evaporator Temperature: 35 °C Data Rate: 2 Hz |
|
Vials: |
LCGC Certified Clear Glass 12 x 32 mm Screw Neck Vial, Total Recovery, with Cap and Preslit PTFE/Silicone Septum (p/n: 186000385C) |
|
Column(s): |
XBridge™ BEH™ C18 Column, 4.6 x 150 mm, 3.5 µm (p/n: 186003034) |
|
Column temperature: |
30 °C (with active preheating on both LCs) |
|
Sample temperature: |
12 °C |
|
Injection volume: |
25 µL |
|
Flow rate: |
0.85 mL/min |
|
Mobile phase A: |
0.1% formic acid in water |
|
Mobile phase B: |
0.1% formic acid in acetonitrile |
Gradient Table
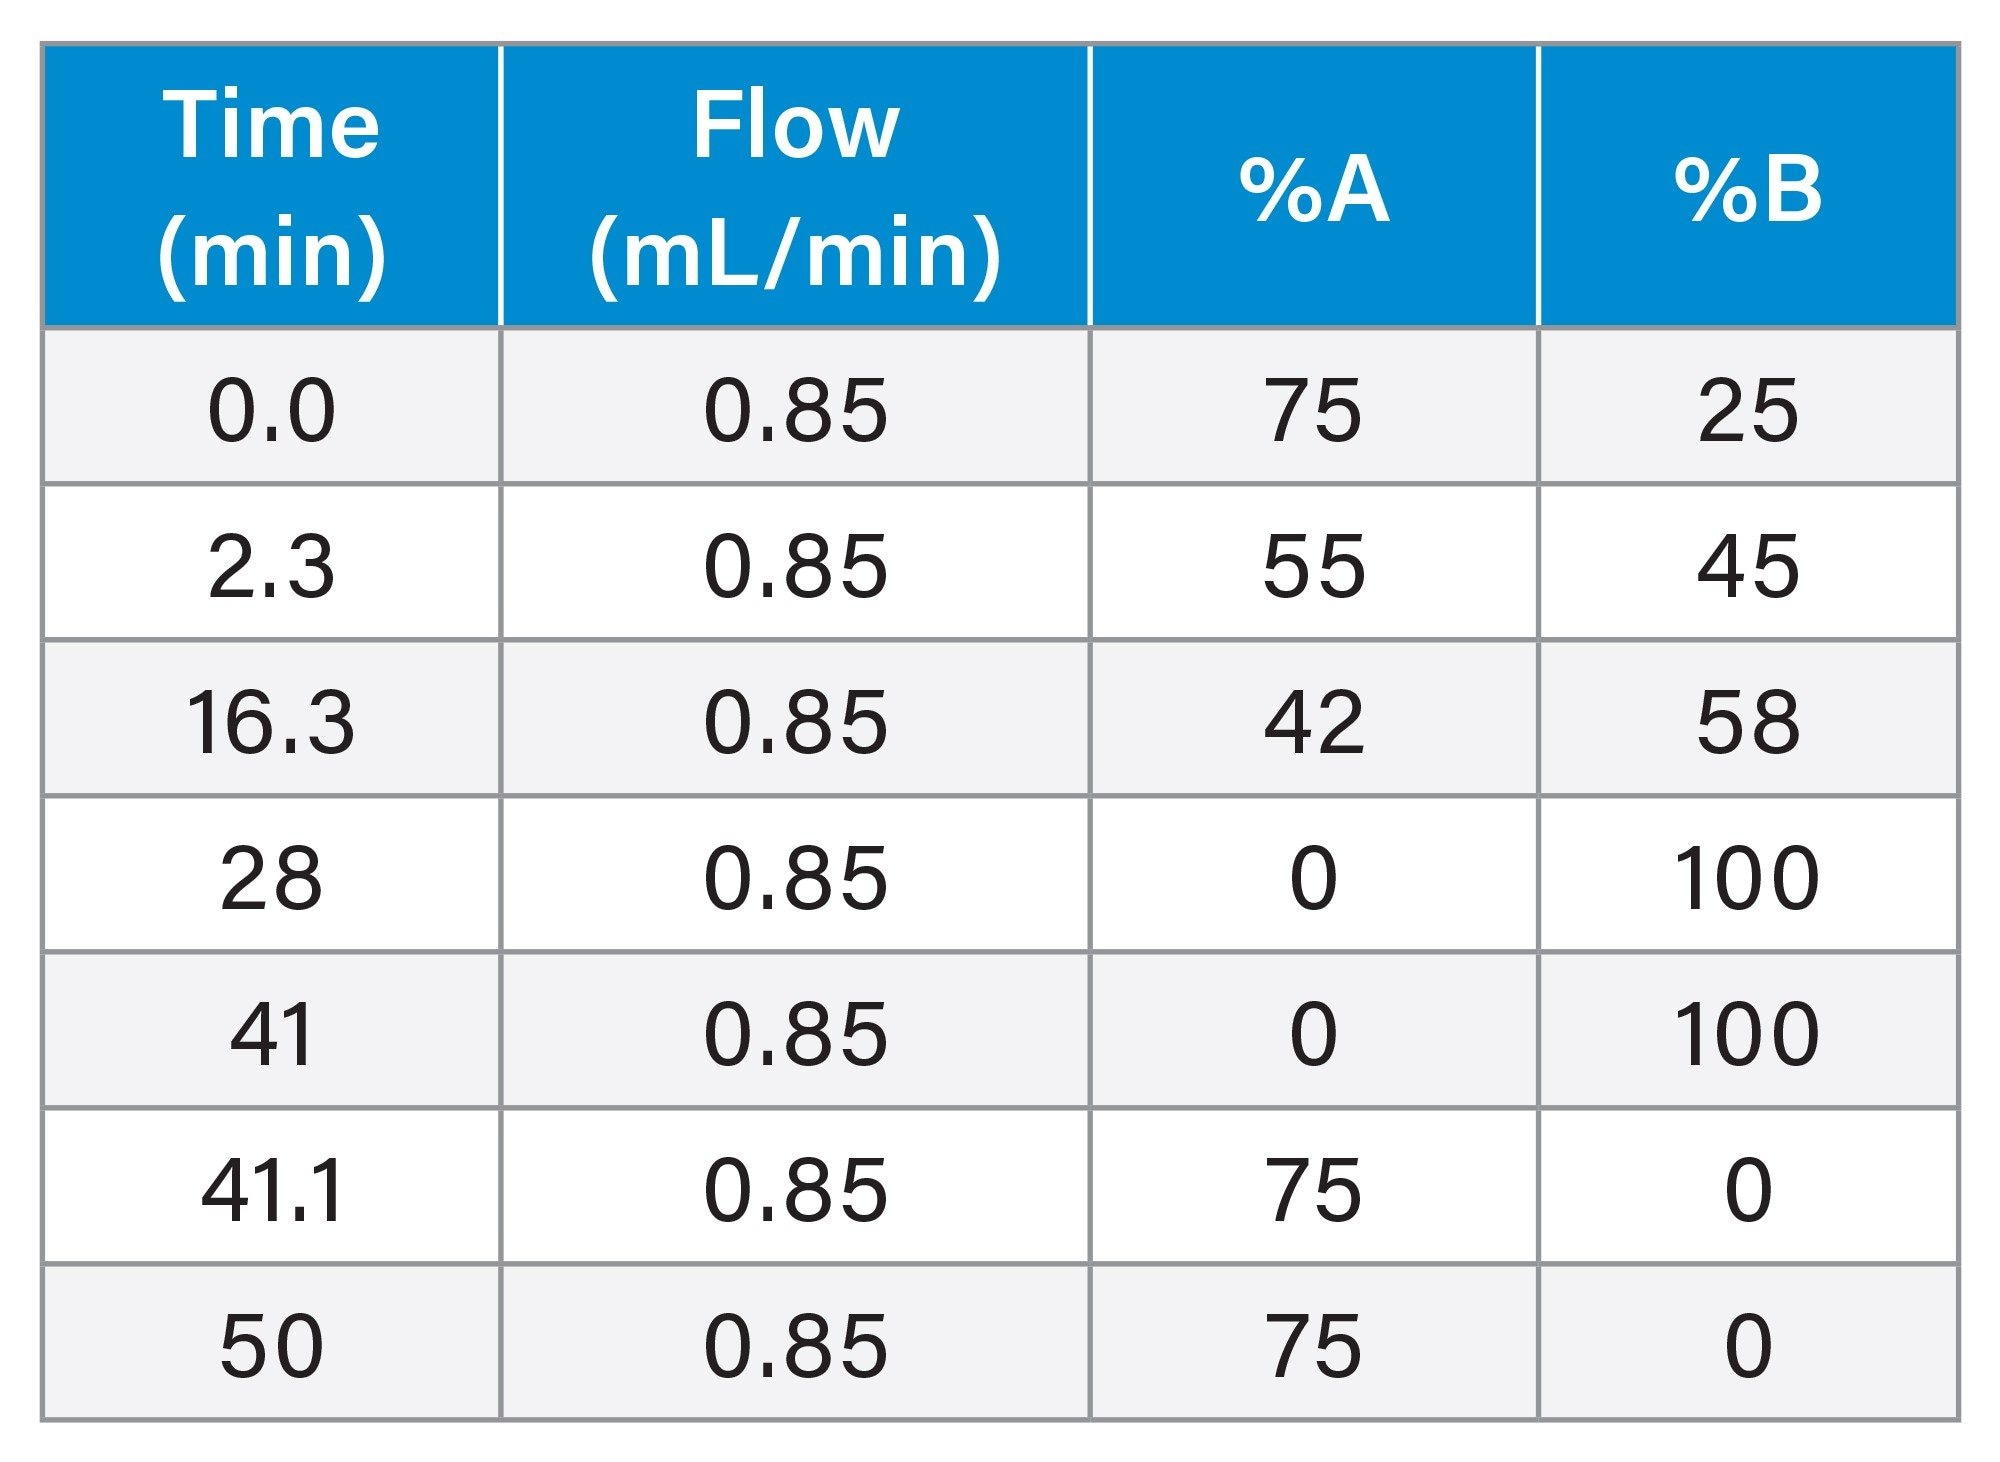
Data Management
|
Chromatography software: |
Empower™ 3 Service Release 3 (SR3) and Empower 3.10 Software |
Results and Discussion
There are many things that can impact sensitivity and reproducibility of CADs, with nebulization efficiency being one such example. The newly introduced Waters CAD includes a new nebulizer, designed specifically for charged aerosol detection. In addition, to control some of the variability, each Waters CAD nebulizer is calibrated, or tuned, to an optimized gas pressure to provide a target signal response. To highlight this, the USP monograph for deoxycholic acid, which specifies the use of CAD, was used to evaluate the performance of Waters CADs. Both the assay and organic impurity tests have associated system suitability requirements to ensure that the intended system is suitable for this method. This includes area precision (assay and impurities), signal to noise (S/N) (impurities), and relative limits for any observed impurities. While meeting the system suitability requirements is critical, it’s equally important to obtain the same quantitative results regardless of variations in mobile phase preparation, and the specific LC or CAD used. The deoxycholic acid method was run on an ACQUITY UPLC H-Class Plus System using a total of six different CAD modules across multiple days. All suitability requirements were met, and Figure 1 highlights chromatograms obtained from the six different CAD modules for the deoxycholic acid impurity sample, each with the same time and signal axis to demonstrate data consistency.
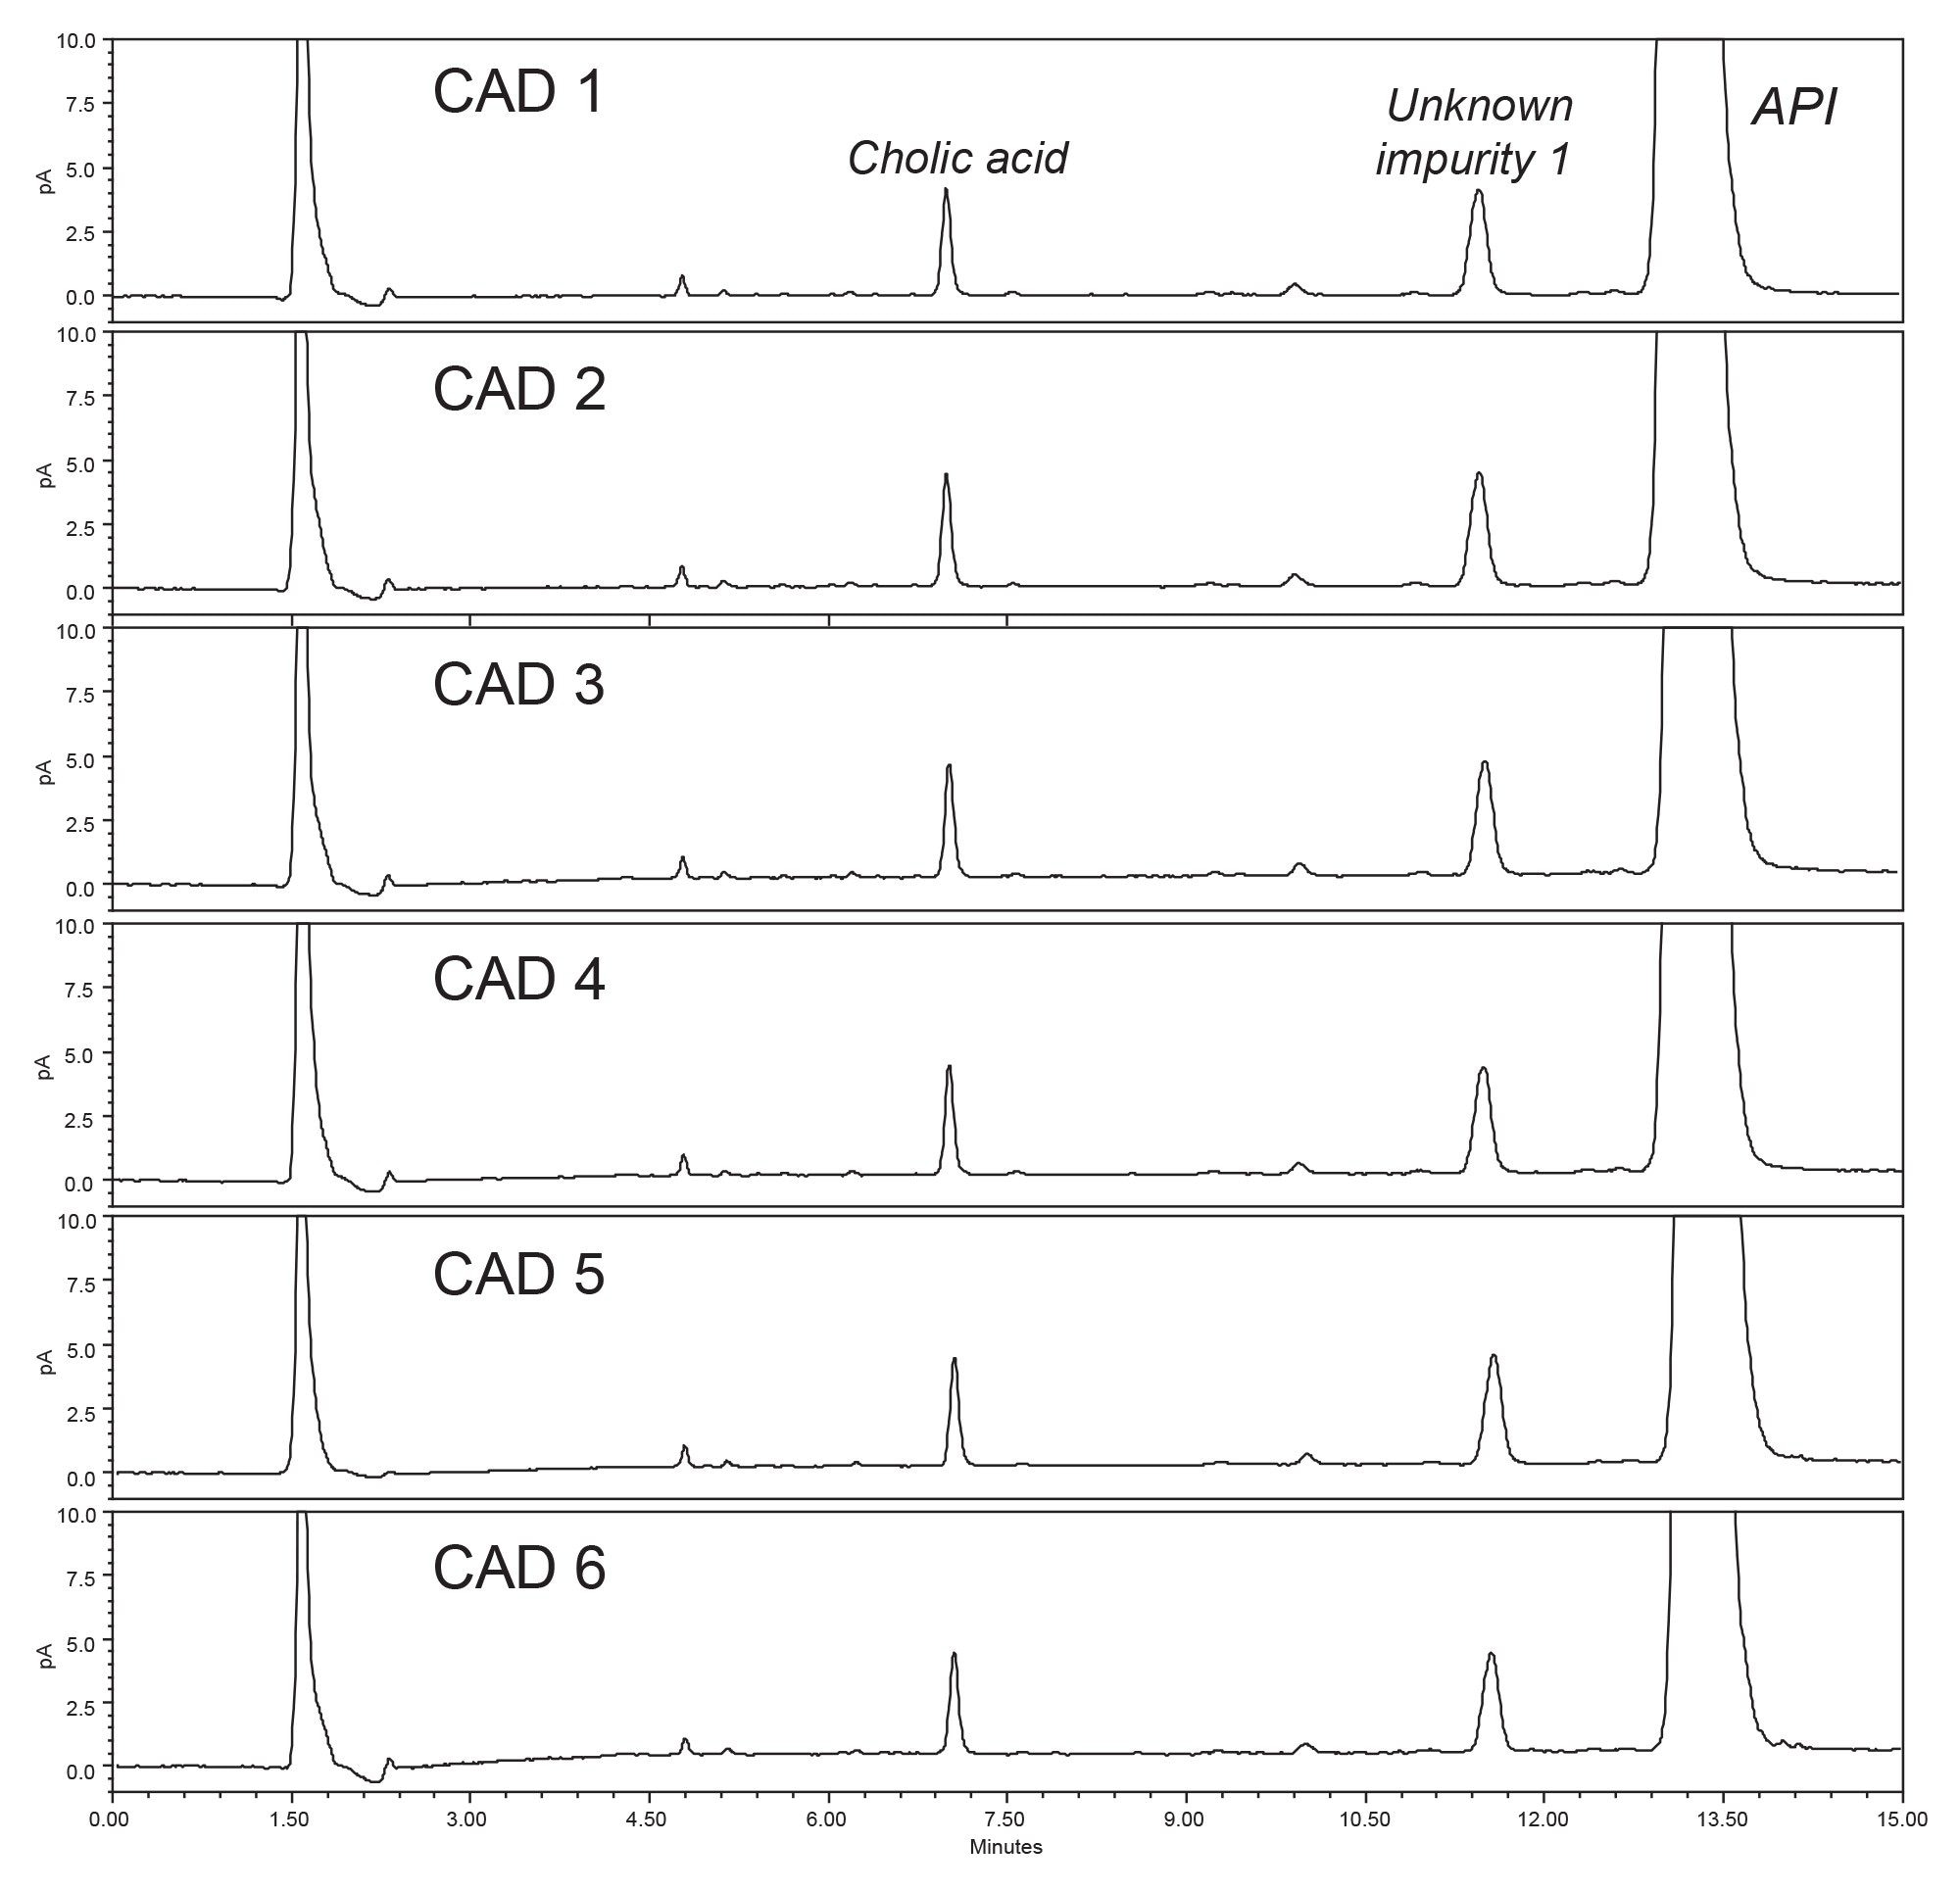
The chromatography, including absolute signal, is nearly identical for all CADs tested. Table 1 shows the quantitative results obtained across the six CAD modules for % API (assay), % cholic acid impurity and % unknown impurity 1 for a sample of deoxycholic acid.
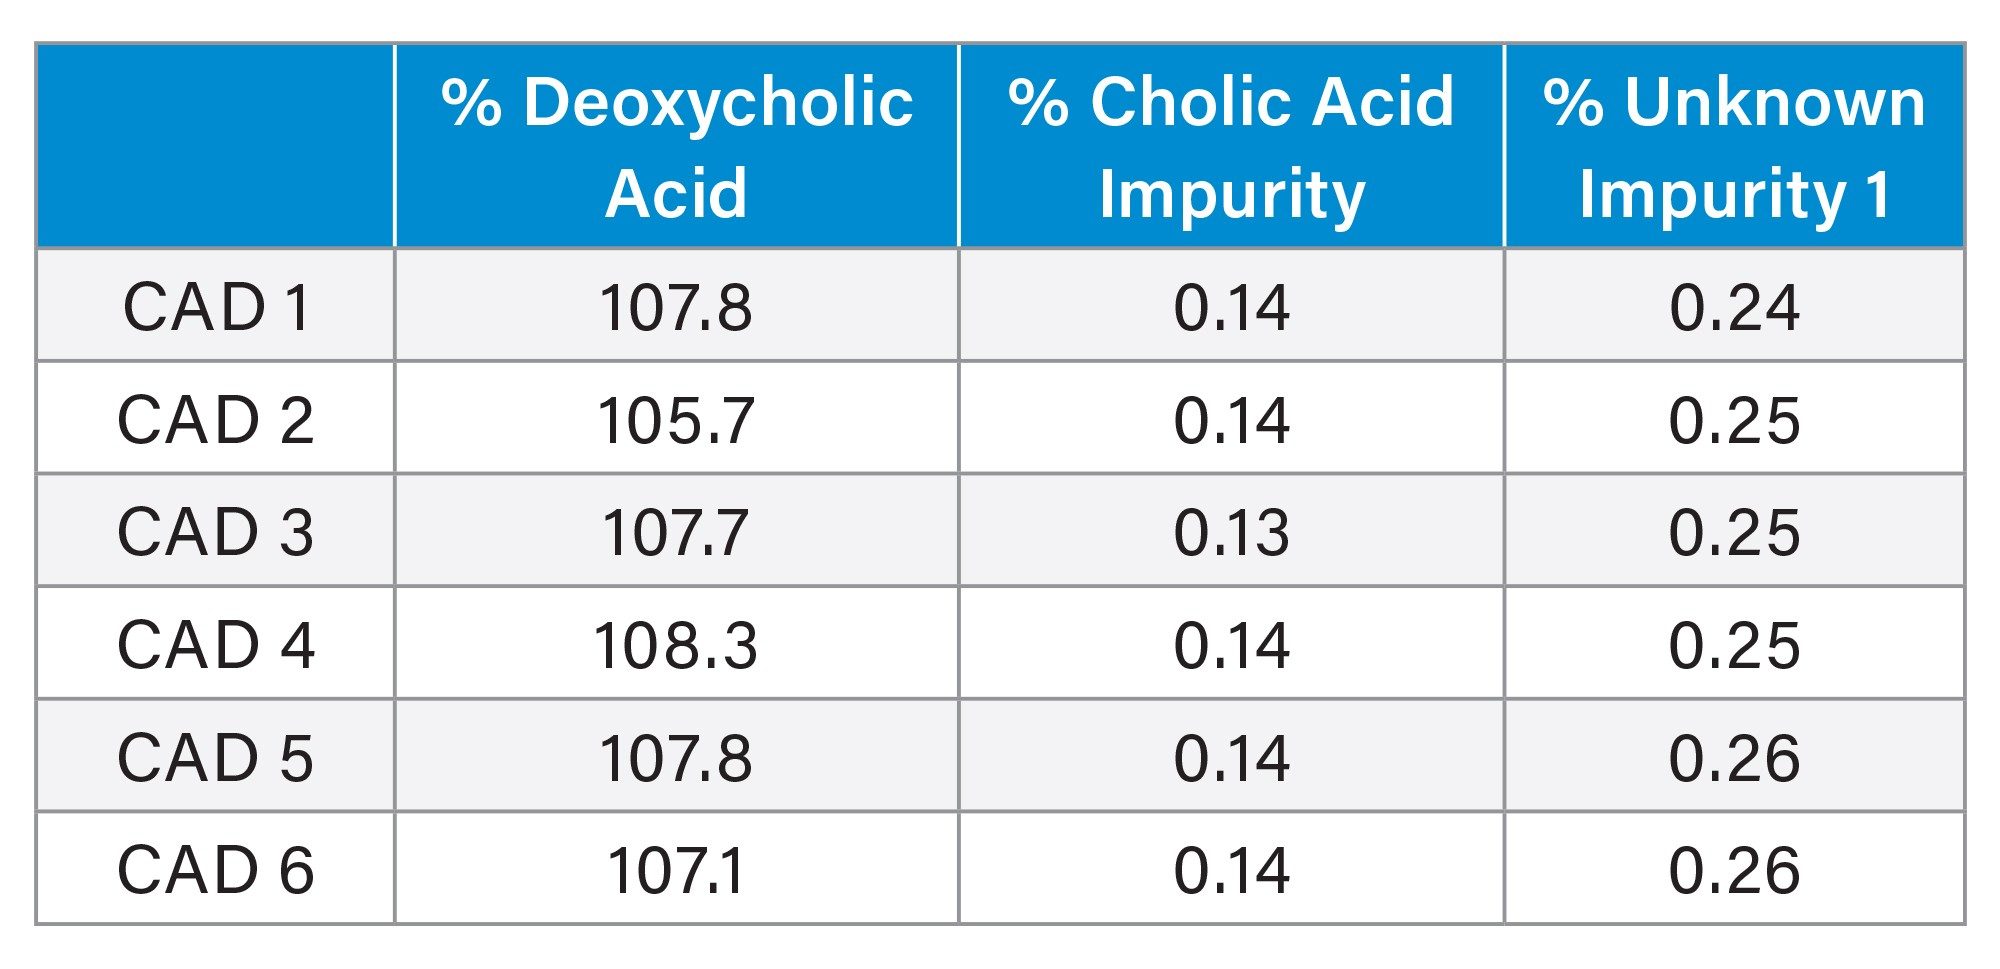
These results demonstrate that consistent quantitative performance can be achieved between CAD modules. This not only provides confidence in the data generated but saves valuable time which may otherwise be diverted to troubleshooting the source of inconsistent signal, poor data, and ultimately requiring possible reanalysis.
In addition to meeting all system suitability requirements and delivering consistent quantitative results, the absolute signal (peak area) across units was evaluated. Unlike UV, CAD signal can be impacted significantly by many factors including nebulizer to nebulizer variability, solvent/system cleanliness, or mobile phase preparation, so a wider range of absolute response across units is generally expected when compared to a technique such as UV. Figure 2 emphasizes the consistent performance of the six CAD units tested using deoxycholic acid RS, cholic acid RS, and deoxycholic sample solutions. Figure 2A shows the intra-CAD RSDs for each solution as well as the inter-CAD RSD, while Figure 2B shows overlays of repeat injections obtained on a single exemplar system. It should be noted that the solutions used for this assessment represent relatively low concentrations and CAD signal, further supporting the high level of performance achieved across the six different Waters CAD modules.
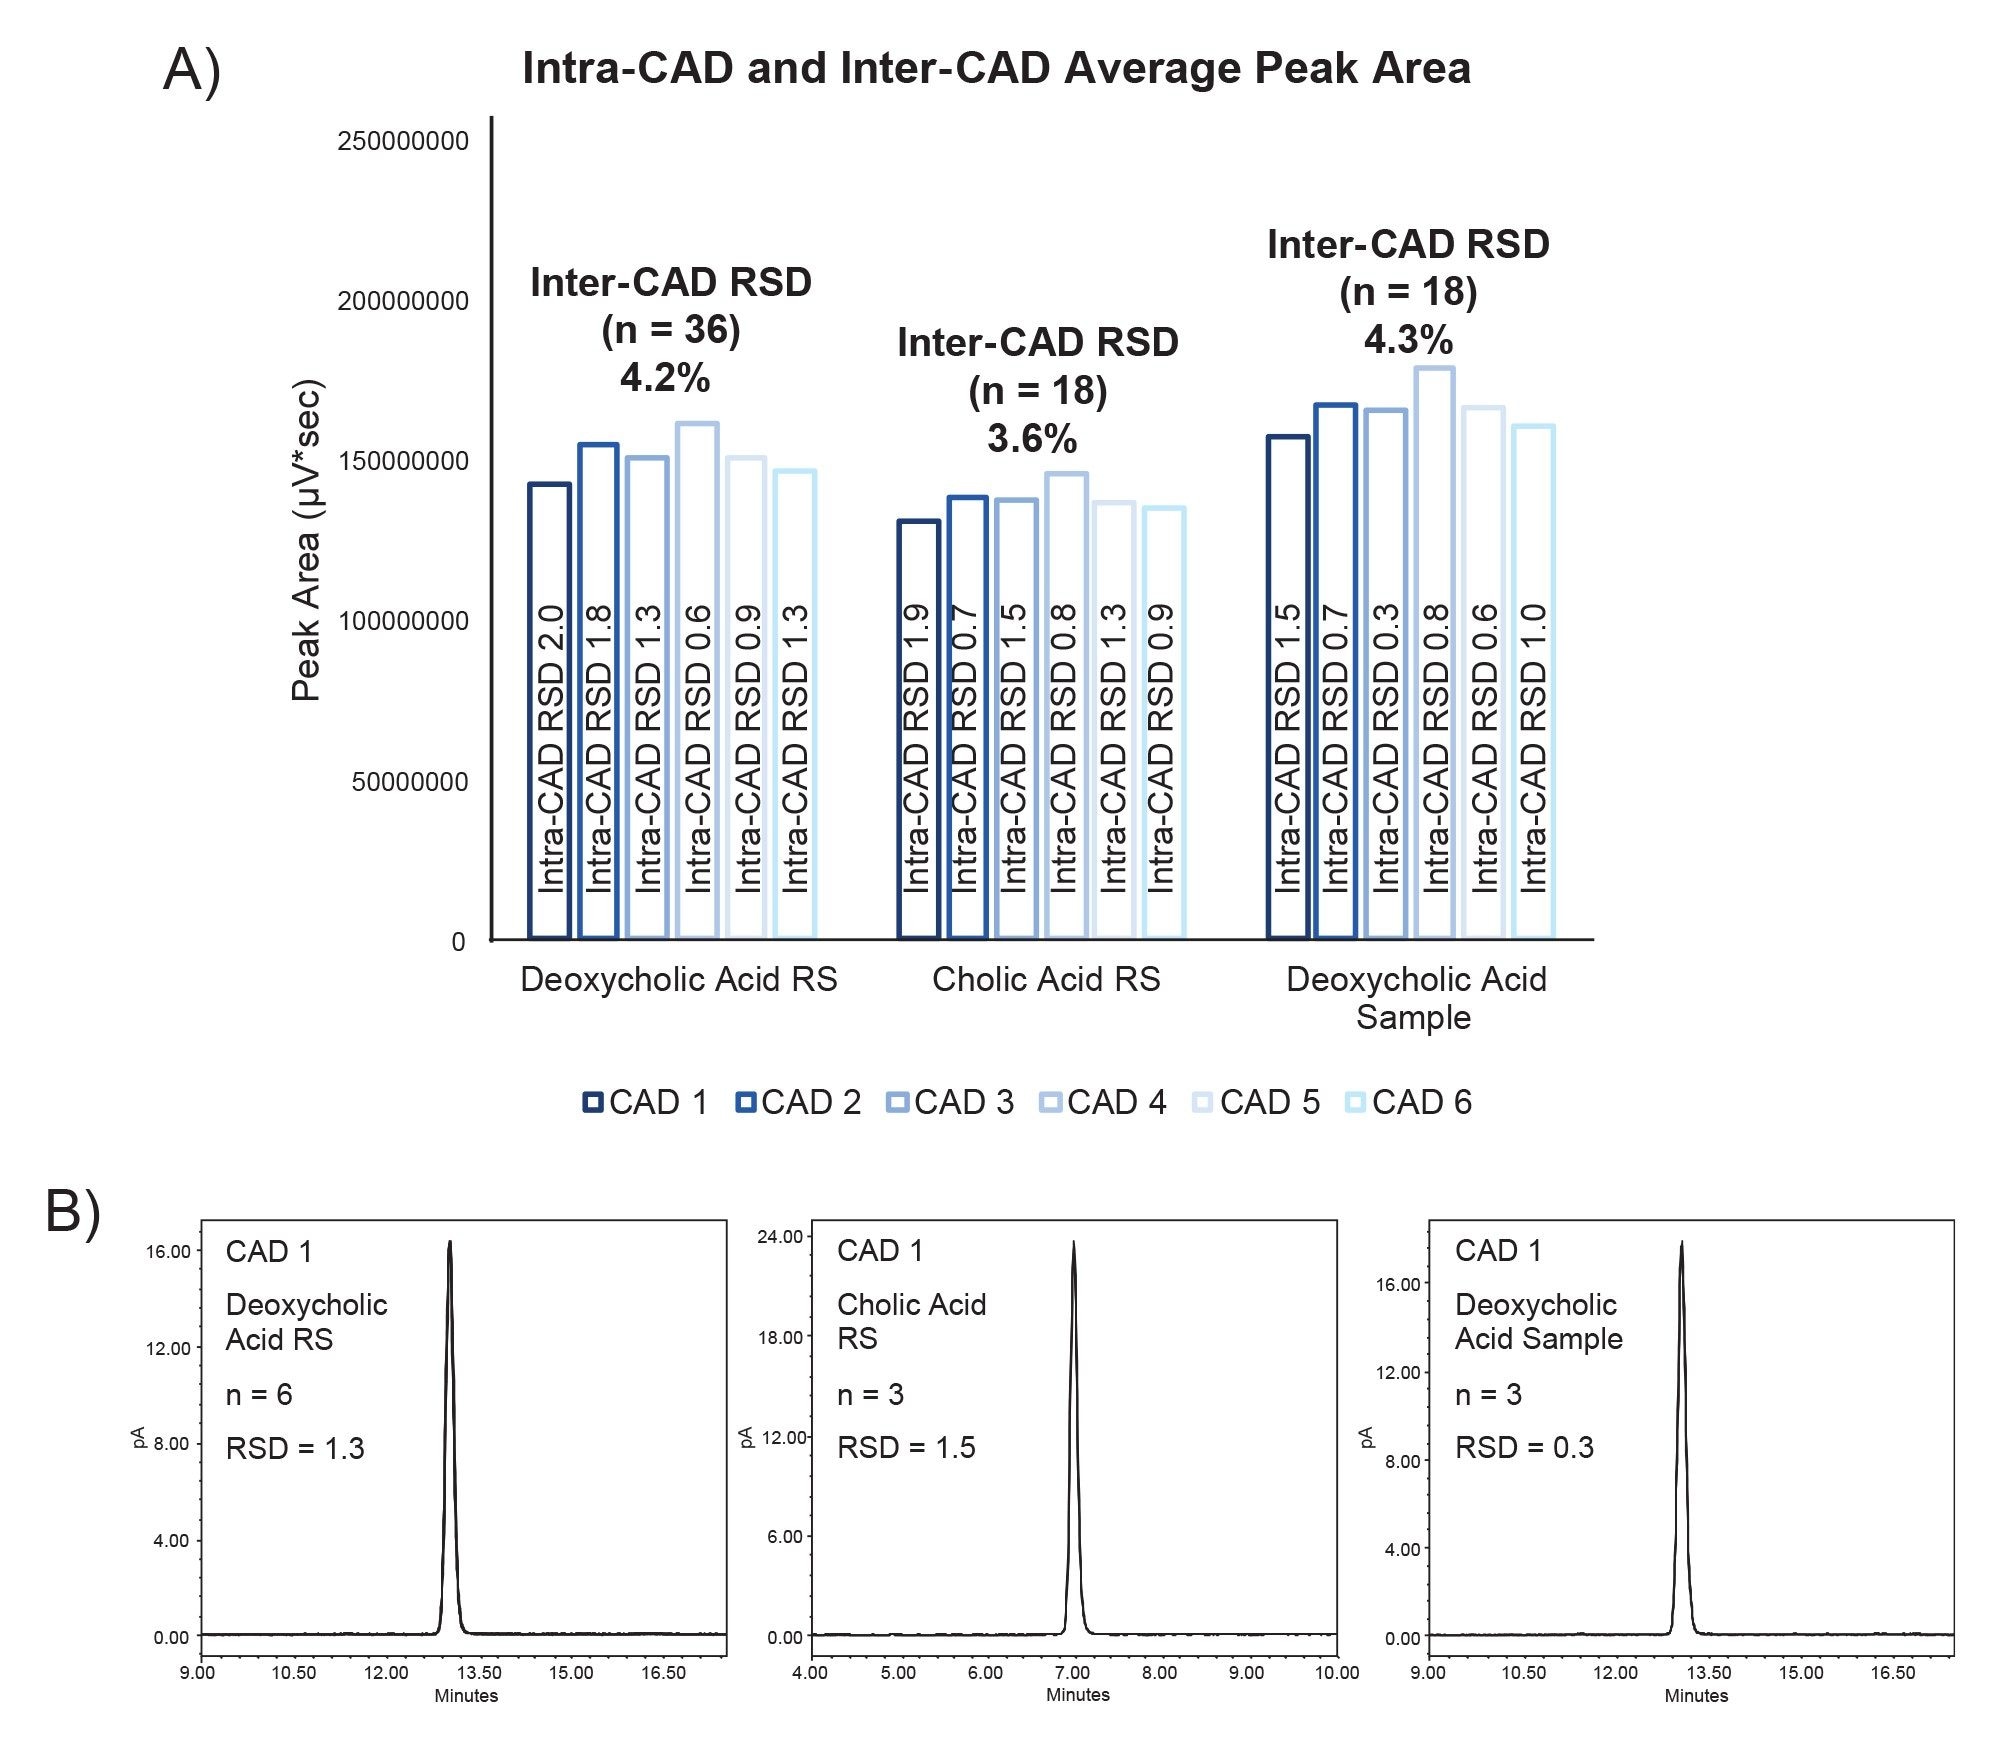
Intra-CAD RSDs ranged from 0.3 to 2.0% while the inter-CAD RSDs, which represent either 36 or 18 injections across six different CADs, was observed to be 3.6–4.9%, demonstrating excellent performance for a nebulization detector. The sample solutions assessed here represent signal intensities ranging from approximately 17–24 pA with a detector range of 0–500 pA. This means the solutions monitored are low concentration samples where absolute signal repeatability can be difficult to achieve.
In addition to providing confidence that different CAD modules will likely provide the same high level of method performance and data quality, it is also important that a single CAD can deliver high levels of consistency over time. The deoxycholic acid method was run a total of seven times on a single CAD detector spanning multiple LC systems (ACQUITY UPLC H-Class System and ACQUITY Arc Systems), users, and days, which represents a practical use case for most labs. Additionally, the CAD unit evaluated was used for multiple methods, each with different mobile phases, additives, and sample conditions, which can add to performance variability over time due to lingering effects of previous methods. The data acquired on a single CAD for the deoxycholic acid RS solution is shown in Figure 3, with both intra-day and inter-day statistics included.
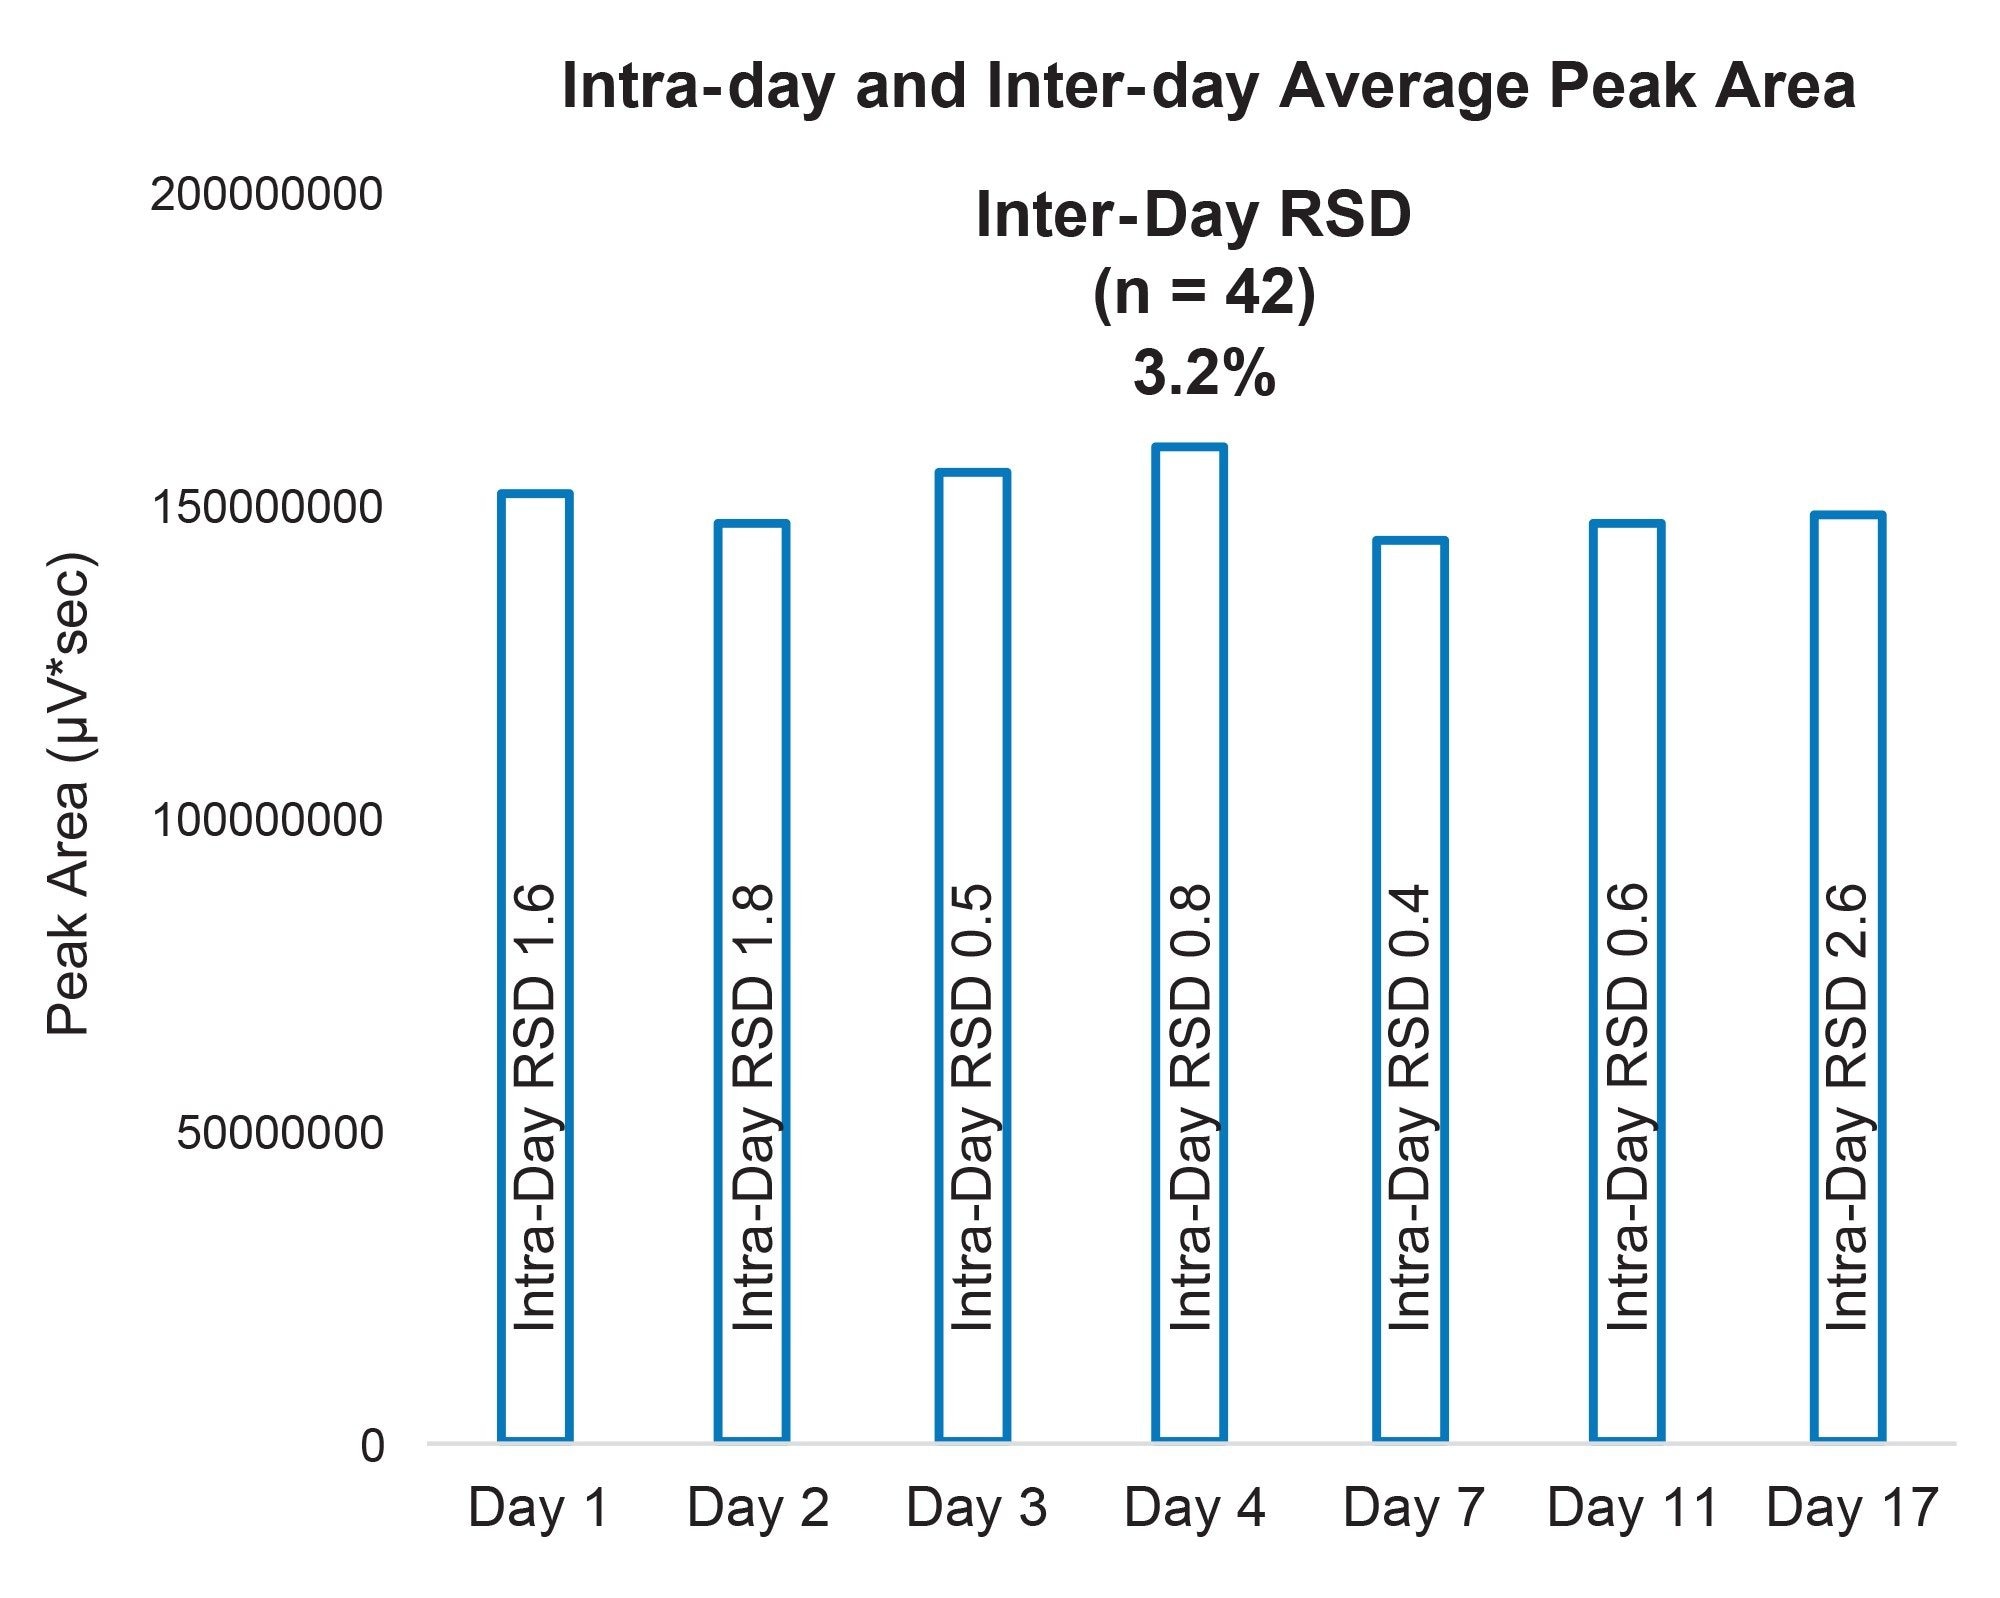
Intra-day RSDs ranged from 0.4 to 2.6%, while the inter-day RSD, representing 42 total injections over 17 days, was just 3.2%. These results demonstrate the high level of reproducibility that can be achieved using Waters CAD over time under practical operating conditions. It is important to reiterate that while achieving a high degree of repeatability and robustness on CAD modules is readily achievable, it requires observation of best practices. It is imperative that high quality solvents are used, that best practices are followed to minimize contamination of mobile phases and samples, and that system and column cleanliness is prioritized in addition to maintaining the CAD itself.
Conclusion
This study demonstrates that reproducible HPLC-CAD performance can be achieved across Waters CAD modules, providing a high level of confidence in resulting data. Each Waters CAD nebulizer is calibrated to control for nebulizer-to-nebulizer variability and enable consistent chromatographic profiles, low inter-module response variability, and comparable quantitative results. In addition to meeting all system suitability criteria of the method, the data acquired for the deoxycholic acid assay and impurity method demonstrated the high levels of repeatability that can be achieved both on a single CAD as well as across several CAD modules. These results support use of the Waters CAD for robust routine analysis and provides confidence when transferring HPLC-CAD methods across instrument platforms.
References
- Barnhart, W. W.; Farooq, M. Q.; Ahmad, I. A. H. A Simplified Tutorial on Charge Aerosol Detection: Understanding the Basics, Optimization, and Troubleshooting. Journal of Chromatography Open, (2024) 100181.
- Schilling, K.; Holzgrabe, U. Recent applications of the Charged Aerosol Detector for liquid chromatography in drug quality control. Journal of Chromatography A, 1619 (2020) 460911.
- Vehovec, T.; Obreza, A. Review of Operating Principle and Applications of Charged Aerosol Detector. Journal of Chromatography A, 1217 (2010) 1549–1556.
- United States Pharmacopeia. (2020). Deoxycholic acid. In USP-NF. DOI: https://doi.org/10.31003/USPNF_M958_05_01
720009496, July 2026


