Robust Oligonucleotide Impurity Profiling in a GMP Setting Using the Waters SQ Detector 2 Mass Detector
Lara Nercessiana, Claire I. Butréa, Damien Mouveta, Cristian I. Cojocariub, Jonathan Foxb, Arnaud Delobela
a Quality Assistance S.A., Thuin, Belgium
b Waters Corporation, Wilmslow, United Kingdom
Published on October 14, 2025
Abstract
This study presents a reliable and easy-to-implement method using the SQ Detector 2 Mass Detector and Empower™ Software for the routine impurity analysis of oligonucleotides in QC laboratories. It offers a practical solution that meets pharmaceutical quality standards while maintaining simple and efficient workflows.
Benefits
This study demonstrates the suitability of the Waters™ SQ Detector 2 Mass Detector for oligonucleotide impurity profiling in GMP labs, offering:
- High-sensitivity mass detection at a fraction of the cost of high resolution mass spectrometry (HRMS).
Streamlined GMP oligo impurity profiling, no need for UV integration, or orthogonal separation. - Routine-ready MS solution with full Empower Software control, enabling compliance with 21 CFR Part 11.
- Accurate quantification of truncated oligonucleotides down to 0.1%, with good linearity (R² > 0.99) and precision of < 6% RSD.
- Simplified method with robust performance across different instruments, columns, and days.
Introduction
Therapeutic oligonucleotides are short synthetic nucleic acid sequences that have gained significant attention for their ability to modulate gene expression.1 These molecules are chemically modified to enhance their stability and target specificity. Among the most common modifications are backbone alterations, such as phosphorothioate linkages, and sugar or base modifications. These modifications contribute to the increased resistance to enzymatic degradation. Such modifications introduce considerable analytical challenges, particularly in the accurate assessment of impurities. Oligonucleotide synthesis is typically performed using the phosphoramidite method, a highly efficient stepwise process involving deprotection, coupling, oxidation, and capping steps. Despite the robustness of this method, the synthesis process can produce various impurities, including N-1 species, shortmers, capped sequences, failure sequences, and other side products originating from incomplete or side reactions. These impurities must be precisely quantified to ensure the safety, efficacy, and regulatory compliance of the final product.
Accurate determination of oligonucleotide purity is a critical step in quality control (QC). Ion-pair reversed-phase liquid chromatography (IP-RP-LC) is widely used for oligonucleotide impurity profiling thanks to its robustness, sensitivity, and compatibility with various detection techniques. However, ultraviolet (UV) absorbance detection alone is insufficient for the comprehensive quantification of all impurities present in the sample. In many cases, full characterization requires the use of multiple orthogonal high-performance liquid chromatography (HPLC) separation techniques to resolve structurally diverse species. An alternative and powerful approach is to couple IP-RP-LC with mass spectrometry detection, which significantly enhances the analytical capabilities of the method. Among the key factors in method development are the choice of ion-pairing reagents, mobile phase conditions, and detector type. While HRMS, such as quadrupole time-of-flight (QTOF), remains the gold standard for detailed impurity characterization, it may not be ideally suited for routine QC workflows due to its complex handling, cost, and need for a highly trained workforce.
To meet the increasing demand for efficient, cost-effective, and GMP-compliant methods in QC environments, a single quadrupole mass detector, such as the Waters SQ Detector 2 Mass Detector, offers a compelling balance between sensitivity, ease of use, and affordability, and has already been adopted and used for oligonucleotide applications.2 When coupled with IP-RP liquid chromatography, SQ Detector 2 Mass Detector enables the straightforward quantification of oligonucleotide impurities without the complexity of HRMS platforms.
Experimental
Sample Preparation
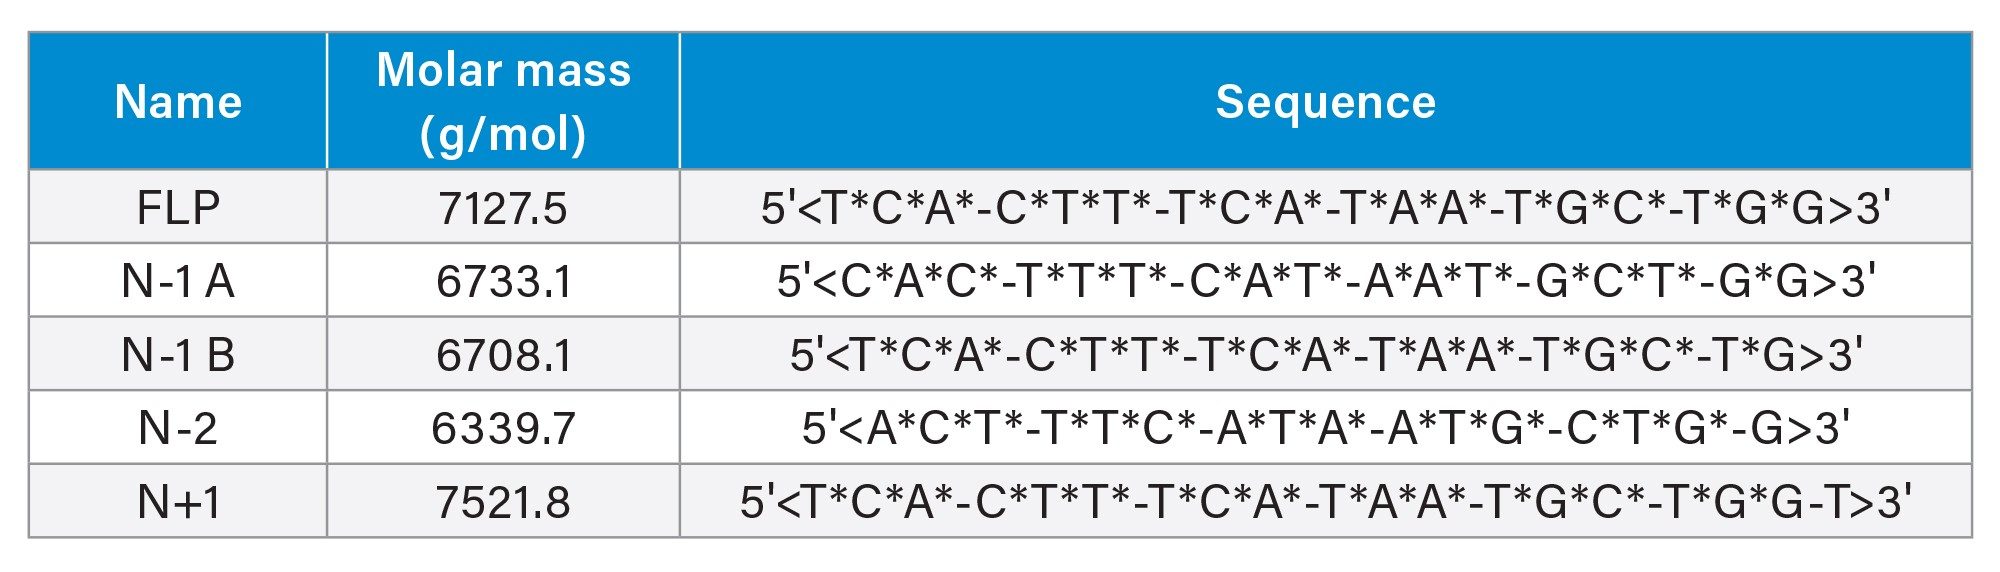
Oligonucleotide samples matching the sequence of the commercial nusinersen product were selected as model compounds for this study and obtained from an external source. In addition to the full-length product, four truncated oligonucleotide variants were synthesized, as detailed in the table below (Table 1).
LC-MS Conditions
Samples were analyzed using a Waters ACQUITY™ UPLC ™ H-Class System equipped with a TUV Detector set at 260 nm, hyphenated to a Waters SQ Detector 2 Mass Detector. Separation was performed on a Waters ACQUITY Premier Oligo BEH™ C18, 130 Å Column (2.1x100mm; 1.7 µm, p/n: 186009485) at a flow rate of 0.3 mL/min using two different sets of mobile phases and conditions for comparison (Table 2). Samples were kept at 5 °C in the autosampler prior to injection on the column (5 µL at 0.1 mg/mL).
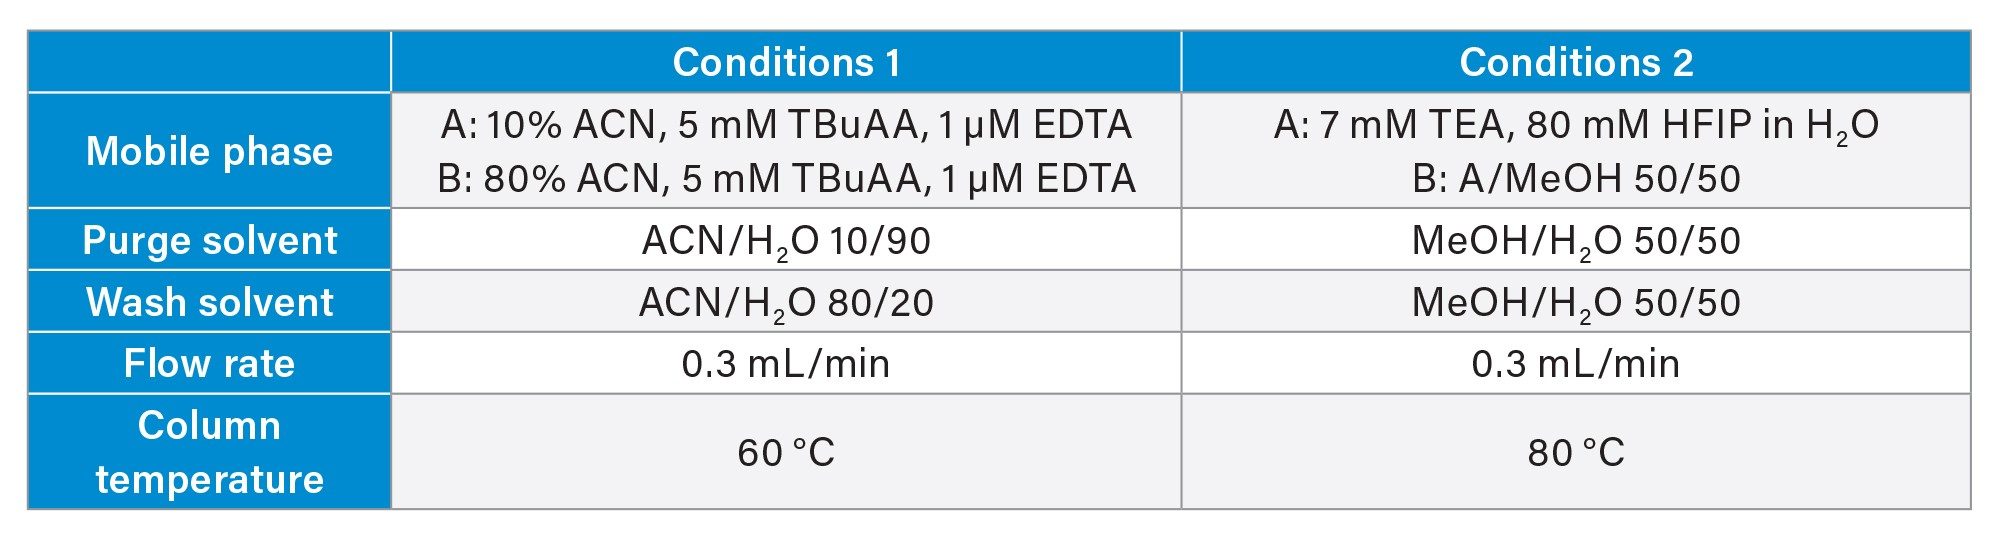
The first set of mobile phases used mobile phase A containing 10 % acetonitrile, 5 mM TBuAA, and 1 µM EDTA in water, while mobile phase B was prepared with 80% acetonitrile, 5 mM TBuAA, and 1 µM EDTA in water. Chromatographic separation was performed at a column temperature of 60 °C. The gradient program started with 1 minute equilibration at 40% B, followed by a linear gradient to 90 % B over 15 minutes. This was maintained isocratically for 2 minutes before immediately returning to the starting conditions in one minute, followed by 6minutes re-equilibration.
The second mobile phase system included mobile phase A, composed of 7 mM TEA, 80 mM HFIP in H2O in water, and mobile phase B, prepared as a 1:1 mixture of mobile phase A and methanol. The column temperature was maintained at 80 °C. The gradient started at 30% B, increased linearly to 70 % B in 16 minutes held constant for 1 minute, then immediately returned to the starting conditions, followed by an 8minutes re-equilibration plateau.
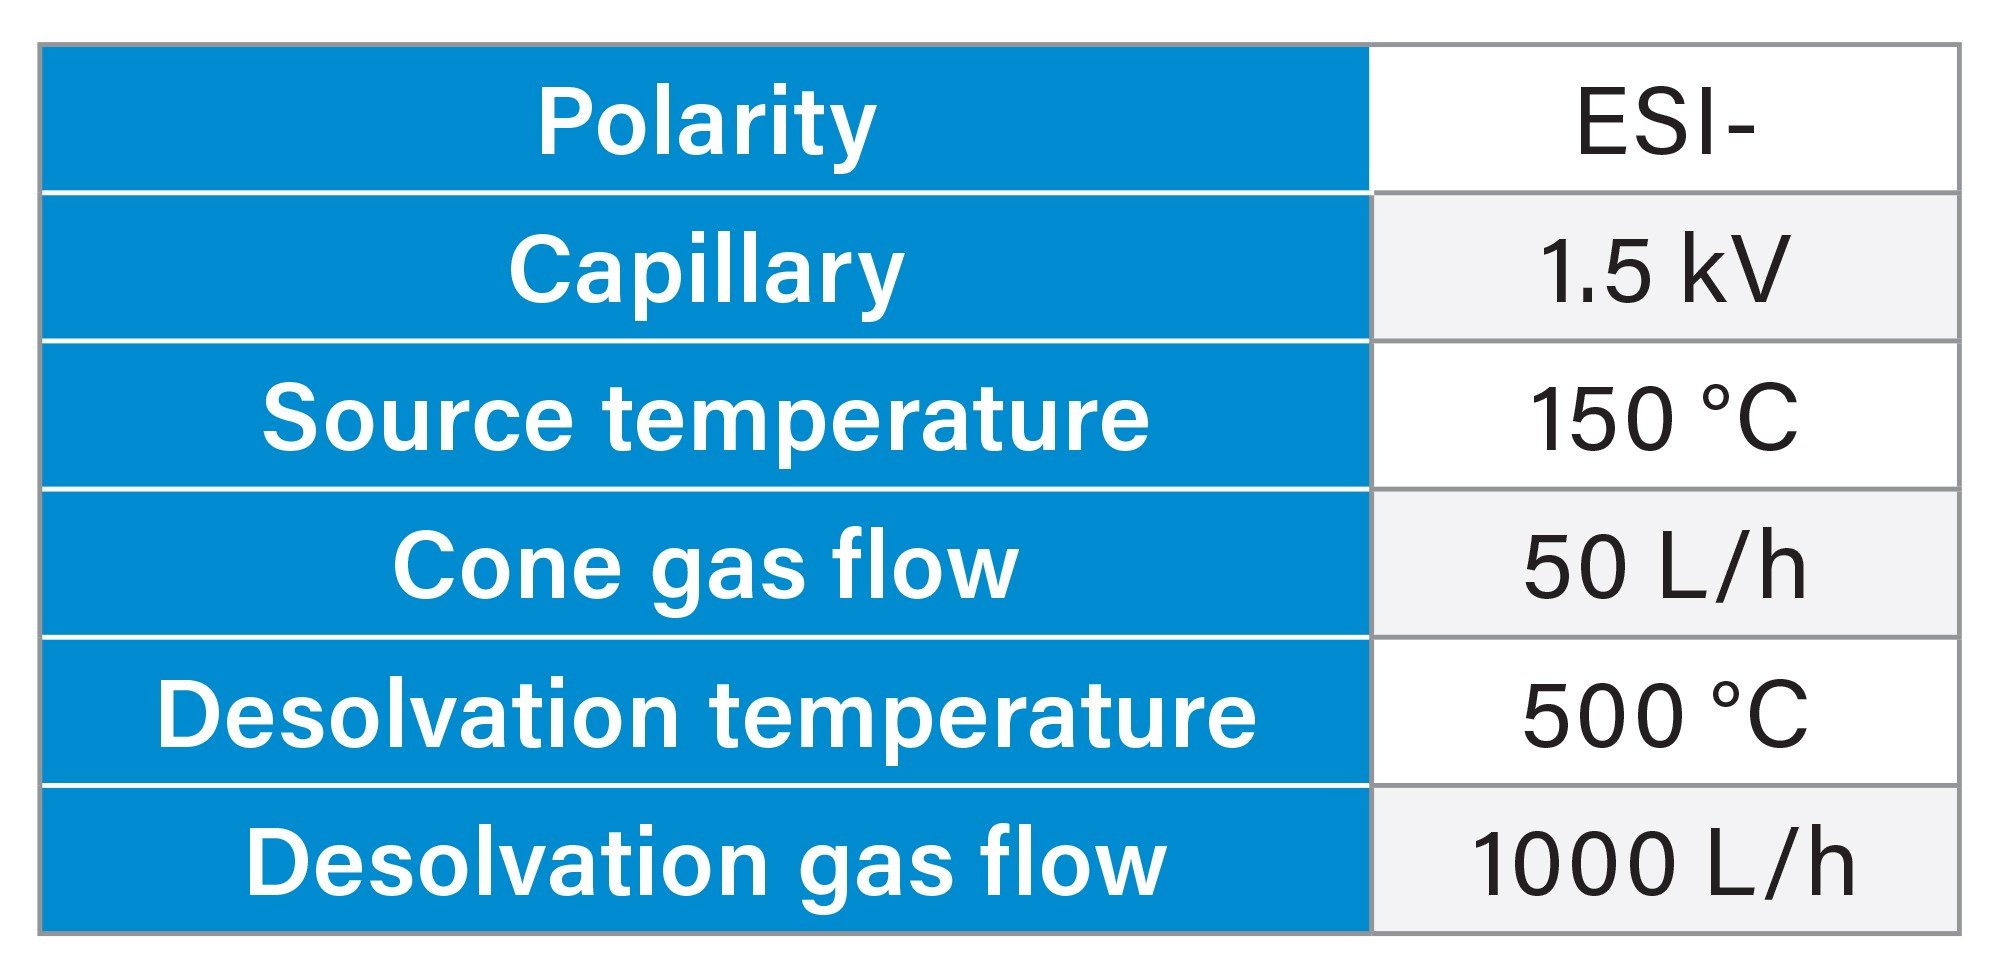
The LC system was coupled to a SQ Detector 2 Mass Detector operated in negative electrospray mode (ESI-). The instrument parameters included a capillary voltage of 1.5 kV, source temperature of 150 °C, cone gas flow of 50 L/h, desolvation temperature of 500 °C, and desolvation gas flow of 1000 L/h (Table 3). In the preliminary phase, MS data were acquired in full scan mode. For the quantification study, specific settings were applied depending on the mobile phase system. For the first set of mobile phases (TBuAA/EDTA), a cone voltage of 60 V was applied, and selected ion recording (SIR) was performed on charge stage 4 of the FLP and its impurities. Quantification was based on the SIR peak area for all compounds. For the TEA/HFIP system, a cone voltage of 40 V was used, and SIR was acquired on charge states 7 and 8. Quantification was performed as the sum of the two SIR values. All data acquisition and processing were performed using Empower 3 Software.
Stability Study
To assess sample stability, repeated injections of the full-length product (FLP) were performed over a 48-hour period using the TBuAA/EDTA mobile phase system before evaluating the method performance. Stability was evaluated by monitoring the FLP UV peak area over time.
Evaluation of Method Performance
To ensure a full comparison and robust evaluation of the method, the following tests were performed on two different instruments using two batches of columns over two consecutive days. On the second day, the same experiment was repeated, but the columns were swapped between the systems.
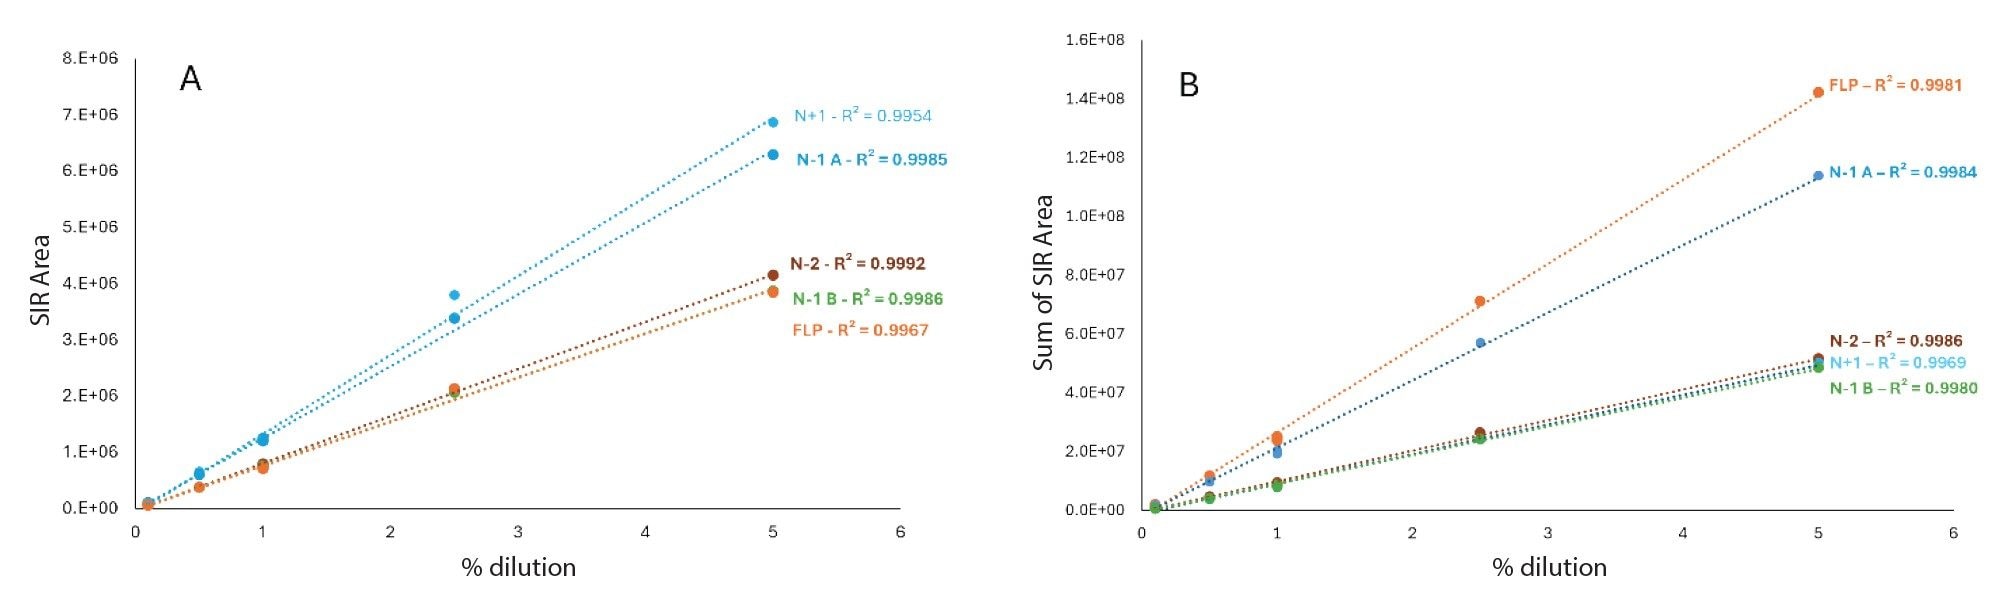
Linearity: To evaluate the signal linearity and determine the response factors of the different impurities relative to the FLP, a mixture of truncated oligonucleotide species and FLP was prepared and injected. The four different impurities and the FLP were mixed at concentrations of 0.1, 0.5 %, 1%, 2.5% and 5 % and injected using both mobile phase sets. The 0.1% and 1% concentration levels were each injected six times to assess injection repeatability. The resulting peak areas were plotted against the concentration to evaluate the linearity of the response and calculate the individual response factors.
Accuracy: To assess the accuracy of the method, samples were prepared by spiking the FLP with impurities at defined levels. A mixture of the four impurities in water was spiked into an FLP solution at 0.1 mg/mL (considered 100%) to achieve a final impurity concentration of 1%. The spike solutions were injected in triplicates. Additionally, a diluted 1% FLP solution was injected separately six times and used as an external calibrant for the MS response. Impurity recovery was calculated as the ratio of the SIR peak area of each impurity in the 1% spiked sample to the SIR peak area of the FLP in the 1 % external calibrant solution and corrected by the relative response factor as:

Results and Discussion
Method Development
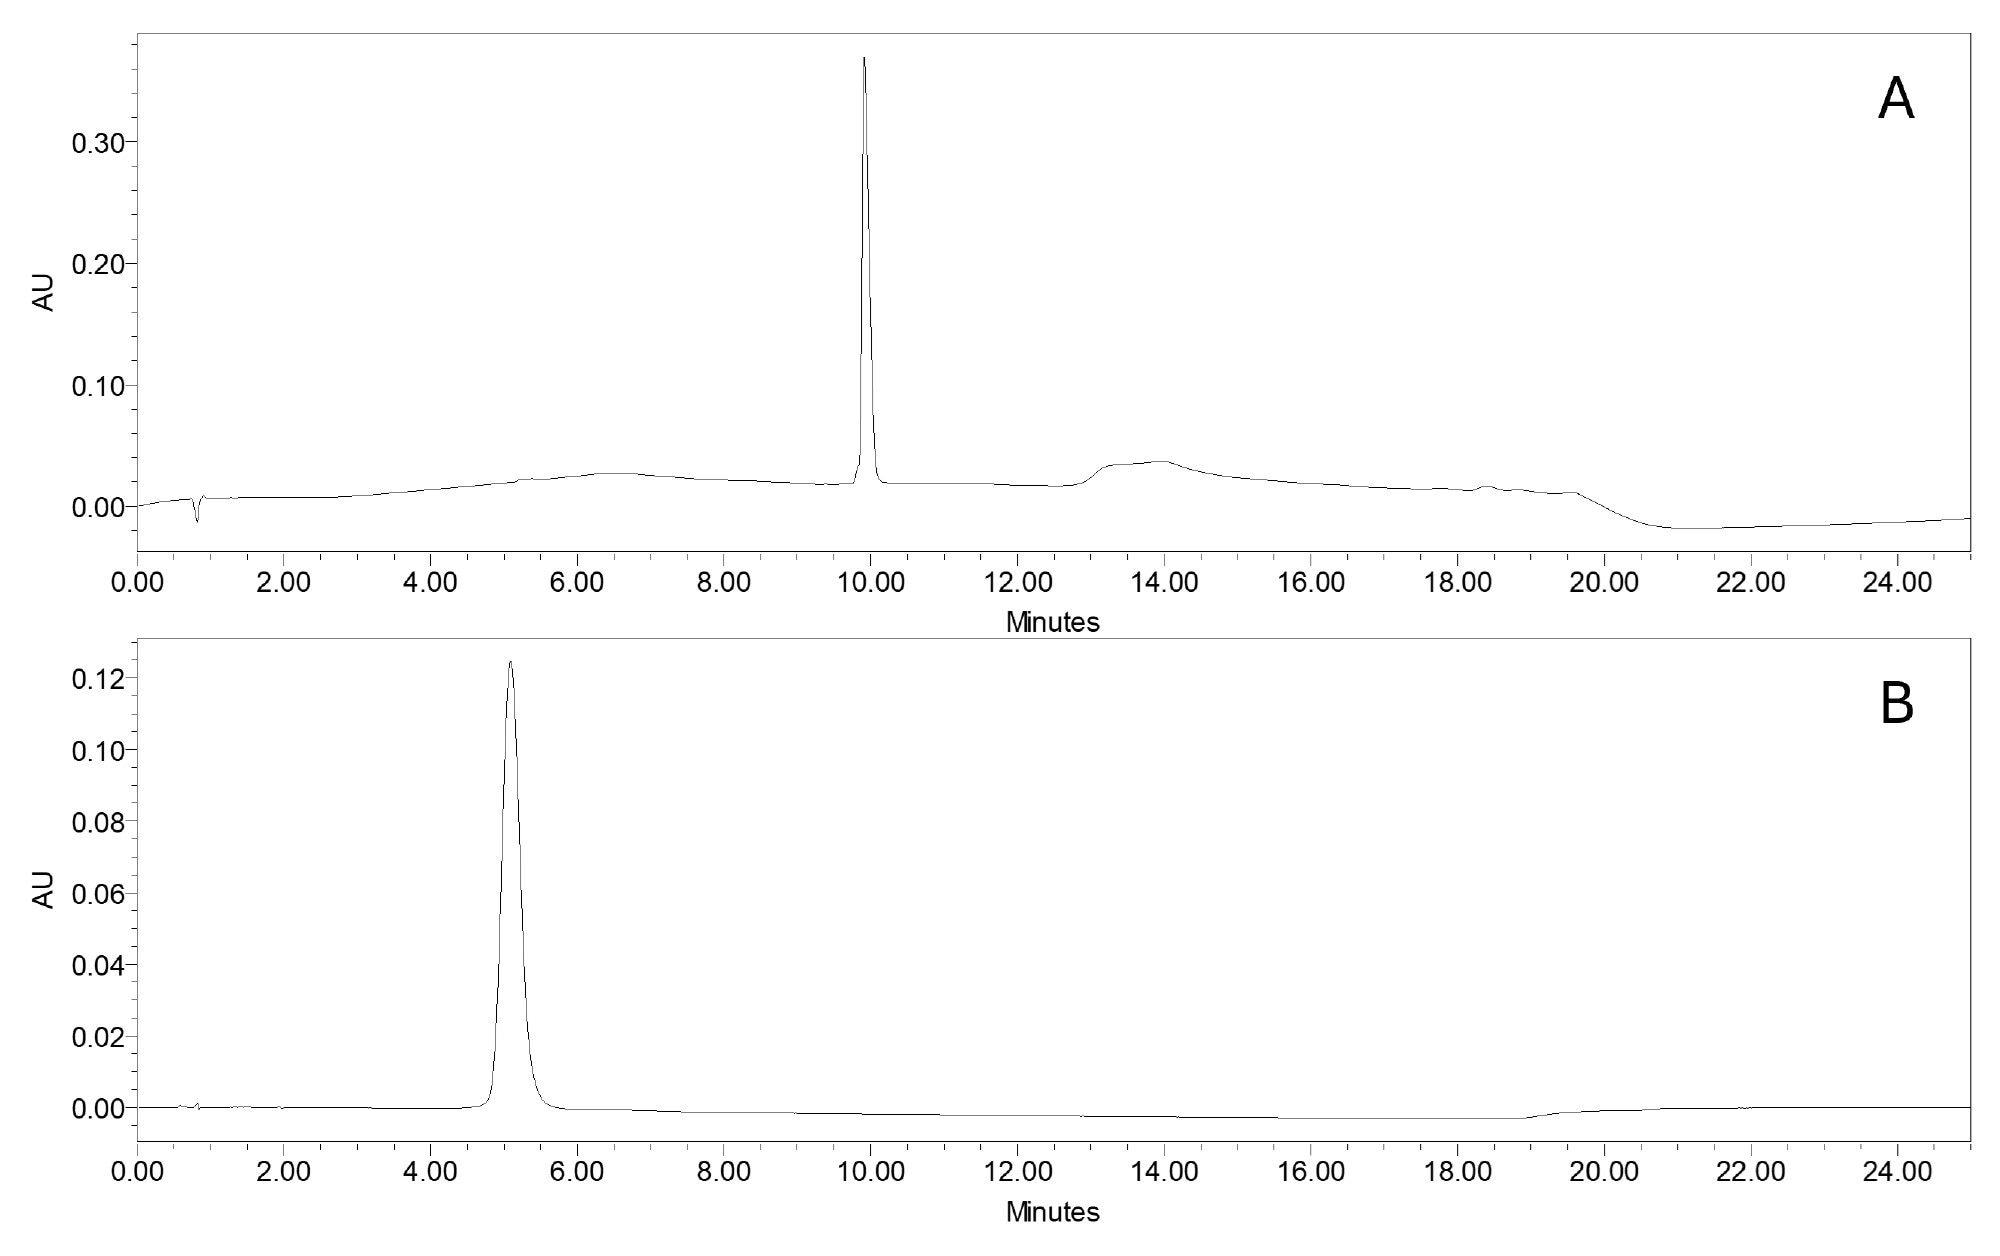
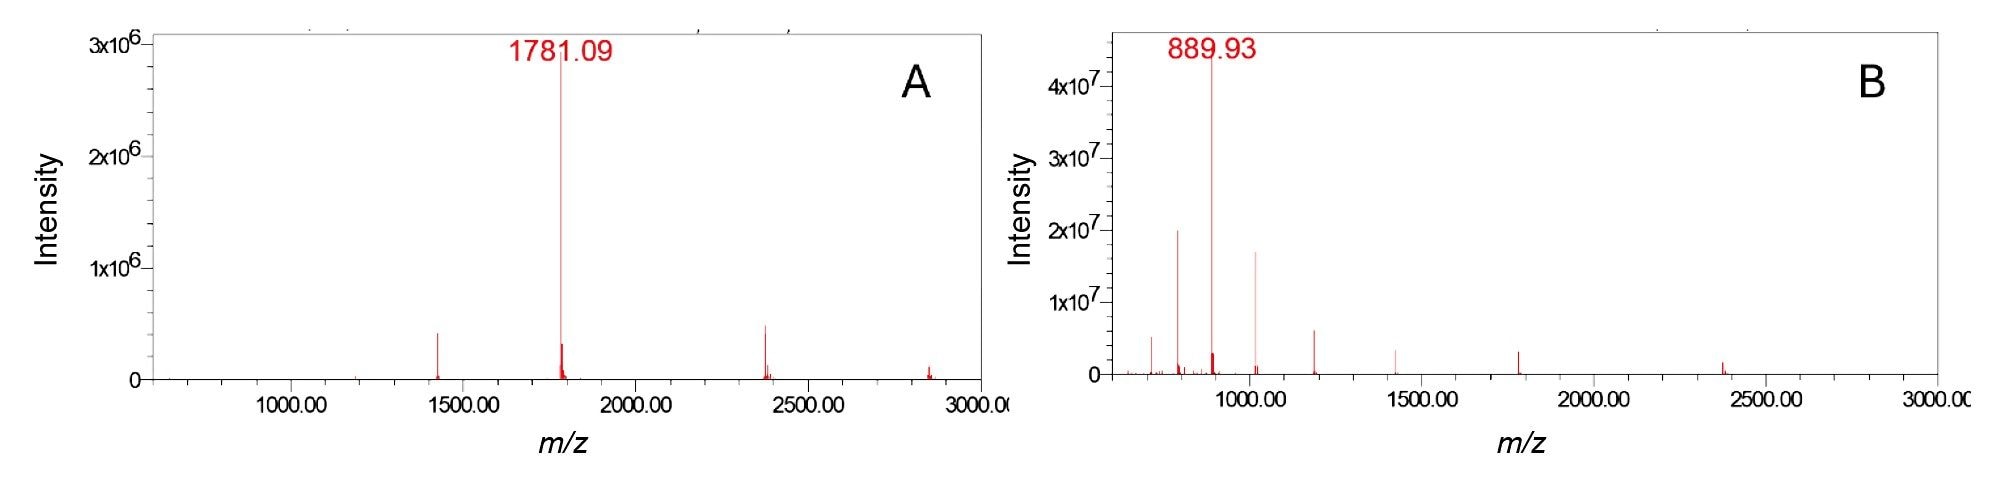
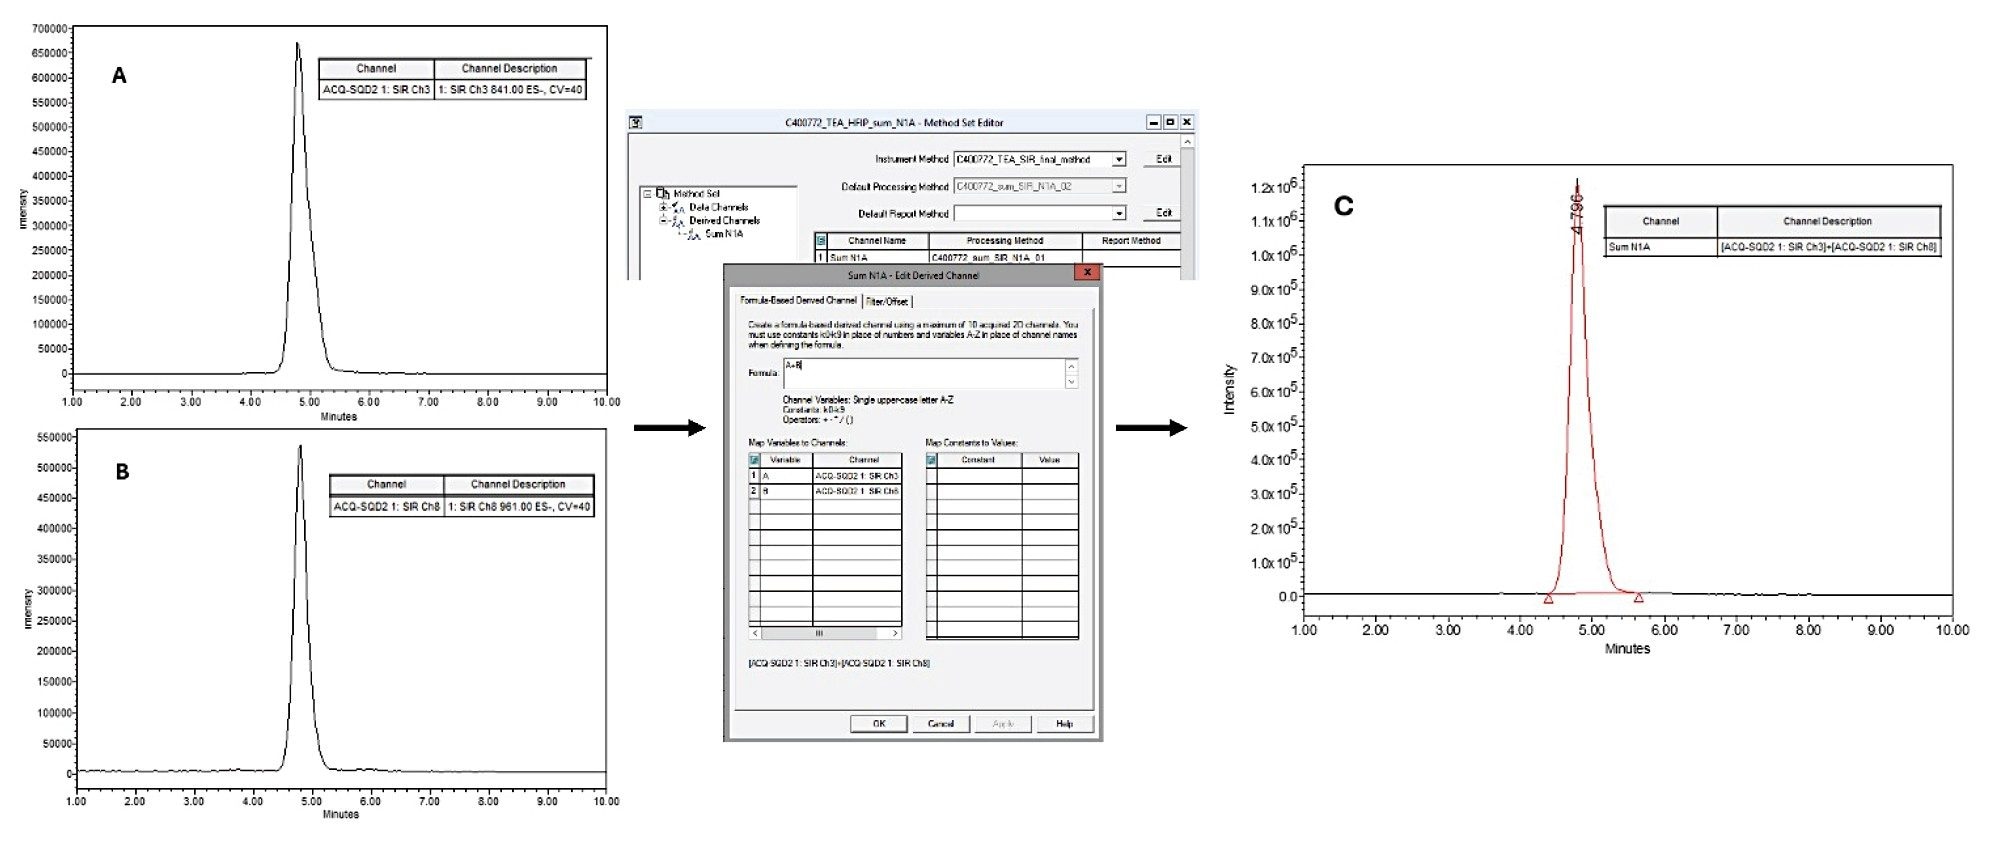
In the initial phase of this study, the chromatographic conditions were optimized for two sets of mobile phases, which are common reversed-phase conditions used for the analysis of oligonucleotides and are based on ion-pairing retention mechanisms. As the primary objective was to develop an MS-based method for impurity quantification, chromatographic resolution was not the main focus. Under both conditions, the FLP eluted as a Gaussian peak (Figures 1A and 1B), with a noticeably sharper profile under TBuAA/EDTA conditions. In the preliminary steps, to set up the quantification, data were acquired in full scan mode over a m/z range of 500-3000. Under TBuAA/EDTA conditions, a predominant charge state was observed, whereas TEA/HFIP produced a wider distribution (Figure 2). The charge state profile obtained using the TEA/HFIP system was particularly sensitive to the cone voltage setting. Lowering the cone voltage to 40 V shifted the distributions to higher charge states with higher intensities (data not shown). However, the signal was spread across several charge states, decreasing the sensitivity for quantifying impurities. To set up the quantification method, single-ion recording was implemented. Under TBuAA/EDTA conditions, the SIR was based on the ion corresponding to charge state 4. For TEA/HFIP, to mitigate the impact of signal division over several charge states, quantification was based on the summed signals from two charge states (7 and 8). The summation was performed automatically using Empower Software. In the example of the N-1A impurity, the individual channels m/z 961 and m/z 841 corresponding to charge states 7 and 8, respectively, are shown for the injection of the 100% FLP solution (Figure 3). For further data processing, a method set was created, including the instrument method, the processing method for these channels, and a newly defined “derived channel” based on a formula that calculates the sum of both channels. Once applied, Empower Software automatically performed the summation according to the processing method, generating a new channel C as a sum of channels A and B.
During the setup of the method, it was observed that the signal was highly susceptible to system equilibration. Column equilibration with the mobile phase is necessary, and multiple sample injections are required to ensure that both the MS and UV signals are stable. It was observed that at least 10 injections of a sample were necessary to obtain a stable MS signal. In addition, stability was evaluated by repeated injections of the FLP sample and was confirmed over 48 h as the % RSD on the FLP UV peak area was lower than 2%, indicating that no degradation products were formed.
Method Performance
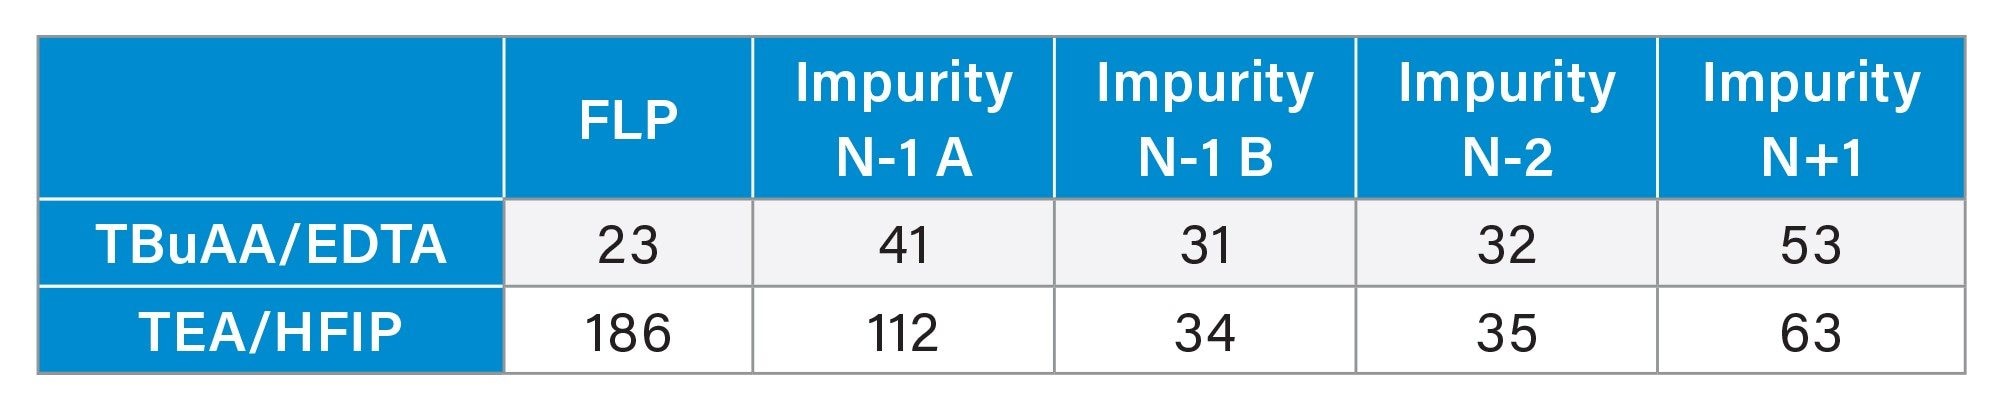
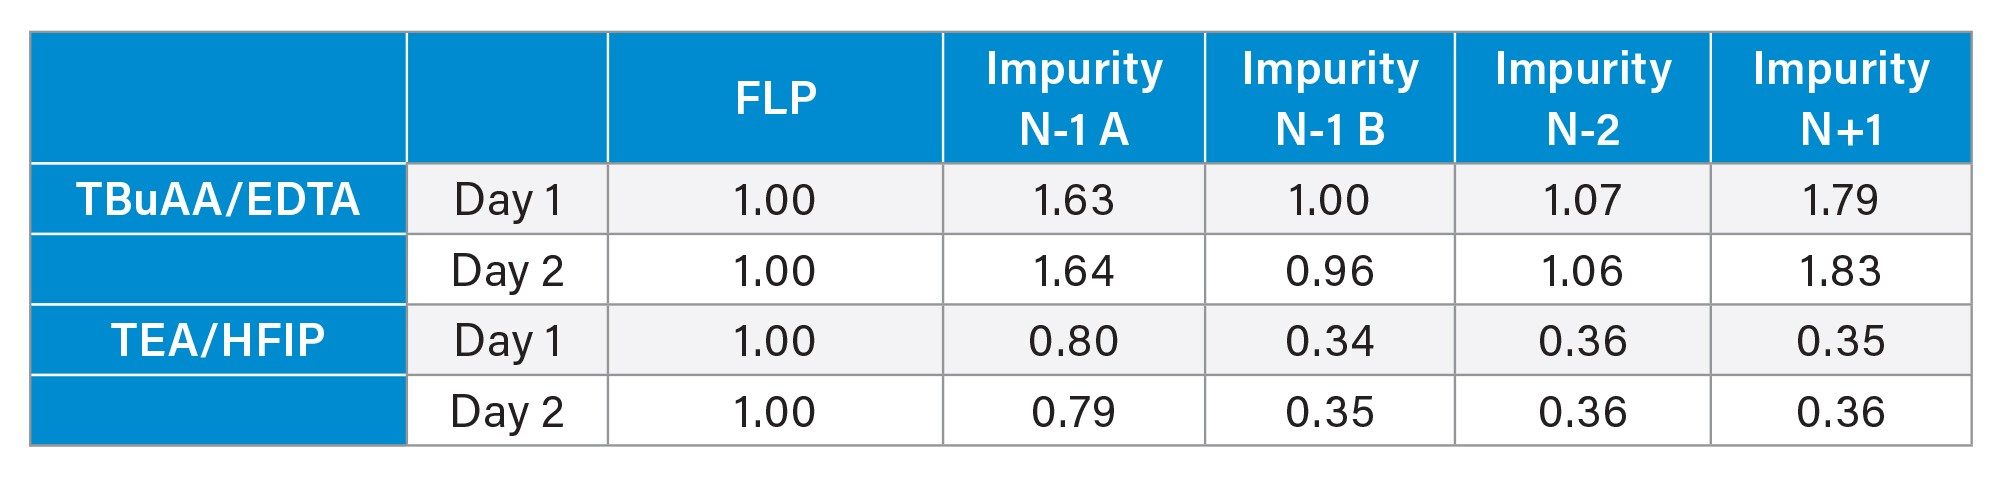
Once the method was established, both in terms of chromatographic conditions and MS parameters, its performance was evaluated. The first step was to check the MS signal linearity and method sensitivity. Linearity was evaluated for the FLP and four different impurities across a concentration range of 0.1% to 5%. In all cases, a linear response was observed within the studied range (Figure 4). The injection repeatability (% RSD) determined each day for each mobile phase set was below 6% for six injections at 0.1% and below 3% for the six injections at 1% for the FLP as well as the four impurities. From these injections, the signal-to-noise ratio was calculated at the lowest concentration level (0.1%), with all values exceeding 10 and some close to 30, indicating that the method is sufficiently sensitive for impurity quantification down to 0.1% (Table 4). Overall, these S/N values were higher for the TEA/HFIP mobile phase set than for the other set, especially for FLP and the N-1 A impurity. These injections also enabled the determination of the response factors for impurities (relative to the FLP) based on the slopes of the curves (Table 5). The response factor values were consistent across two days, two column batches, and two SQ Detector 2 Mass Detector instruments. However, the mobile phase significantly influenced the response factors (Table 5). For example, the response factor for the N-1 A impurity was approximately 1.6 for the TBuAA/EDTA system and 0.8 for the TEA/HFIP system.
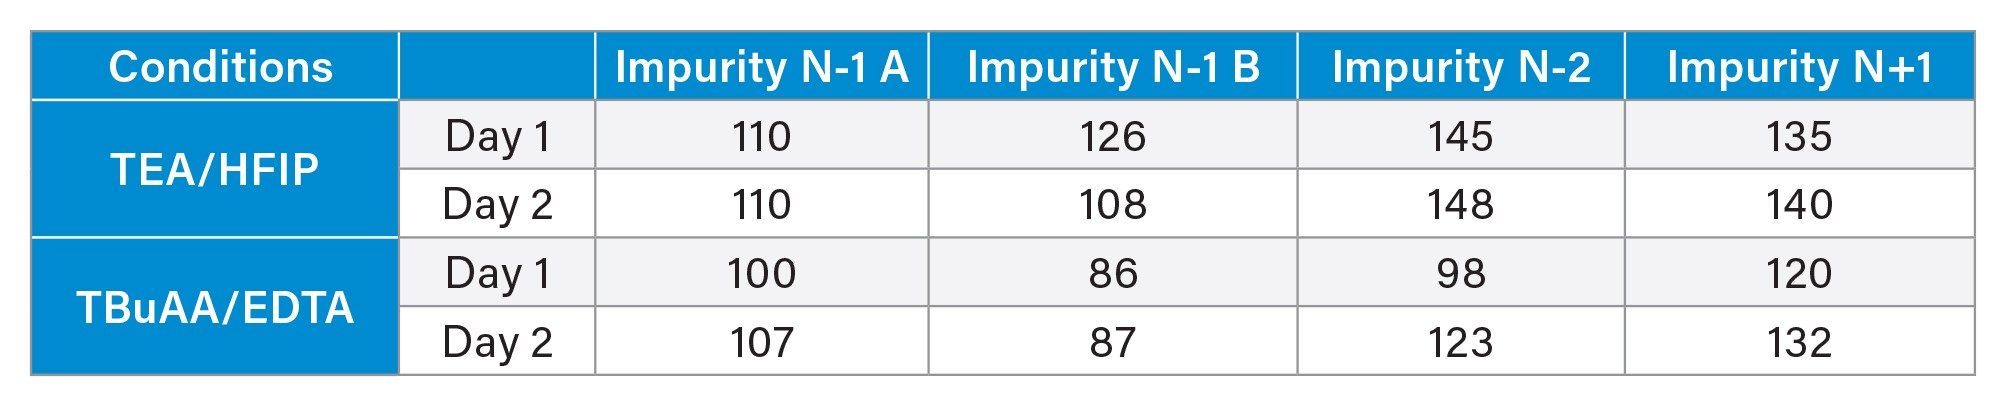
In the second step, method accuracy was assessed by performing triplicate injections of the FLP solution spiked with known amounts of the four impurities at the 1% level. Overall, the recovery values varied between 86 and 148% (Table 6). For instance, the N-1 A impurity showed an average recovery slightly above 100%, indicating excellent accuracy. In contrast, the N+1 impurity showed higher recoveries, 126 % on average for mobile phases TBuAA/EDTA and 137% for mobile phases TEA/HFIP. These results are consistent with previously published data using single-quadrupole mass spectrometry for oligonucleotide impurity quantification.3 Finally, it should be noted that the precision of the triplicate injections was acceptable. The percentage RSD determined for the spike impurities are indeed lower than 2% for TBuAA/EDTA mobile phase and lower than 3% for TEA/HFIP mobile phase.
Method Performance and Limitations
The developed MS method allowed the accurate quantification of oligonucleotide impurities, with a performance similar to the one presented in a reference study.3 In addition, MS signal linearity was demonstrated across the range 0.1-5% relative to the FLP concentration. Two sets of mobile phases were compared to evaluate their influence on performance and ease of use. Suitable method performance was obtained for both sets. However, both have their advantages and disadvantages, and show limited stability over time. With TBuAA/EDTA mobile phases, oligonucleotides eluted as sharp peaks, and the MS spectra showed a predominant charge state, facilitating MS quantification. In contrast, the TEA/HFIP mobile phases resulted in slightly lower chromatographic quality and a more complex charge state distribution profile. This distribution was notably sensitive to the cone voltage settings. However, despite this charge state complexity, higher signal-to-noise ratios were obtained for the TEA/HFIP mobile phase than for TBuAA/EDTA when considering a single charge state (Table 4). Therefore, the selection of the mobile phase should be guided by the specific requirements of the method, particularly in terms of expected sensitivity, chromatographic resolution, and robustness of MS quantification.
Applicability and Compliance
The developed method enables the quantification of truncated species with acceptable accuracy, precision, and sensitivity using a single quadrupole mass detector. This study presents the example of four impurities, but the results could be extrapolated to other species. For fully phosphorothioate (PS) oligonucleotides, a common impurity is the mono-phosphodiester (mono PO) variant. One challenge with this impurity is its minimal mass difference with the FLP (16 mass units, corresponding for example to only 2 m/z for charge state 8) making it indistinguishable by a single quadrupole detector without chromatographic separation. This limitation was confirmed by recording the continuum spectra of both the FLP and the mono PO impurity, which showed a large overlap of the signals. For these types of impurities, a high-resolution mass spectrometer or a triple quadrupole mass spectrometer operated in MRM mode is required. For other types of impurities, such as depurinated species, the main limitation is the availability of reference standards. As observed in this study, the compounds showed different response factors that were influenced by the mobile phase. In the absence of standards, assumptions must be made regarding response factors, introducing uncertainty into the purity calculation.
Finally, the SQ Detector 2 Mass Detector is user-friendly and ideal for routine analyses, such as purity assays. Its integration with Empower Software and full 21 CFR Part 11 compliance make it well suited for GMP applications. Although method setup during development can be somewhat demanding, particularly with TEA/HFIP mobile phases, where summing two SIR channels is necessary to enhance sensitivity, these adjustments are straightforward to implement (Figure 3). Once optimized, the method can be executed reliably and efficiently in routine workflows, ensuring both compliance and robustness.
Conclusion
- The Waters SQ Detector 2 Mass Detector combined with Empower Software provides a reliable, accurate, and GMP-compliant solution for oligonucleotide impurity profiling.
- The method enables quantification of truncated oligonucleotide impurities down to 0.1%, with strong linearity and precision, without requiring complex instrumentation.
- Once optimized, the workflow is robust, stable, and efficient, making it ideally suited for routine QC laboratories.
- The approach supports regulatory compliance while maintaining operational simplicity and cost-effectiveness.
References
- Crooke ST, Witztum JL, Bennett CF, Baker BF. Cell Metabolism, Vol 27, Issue 4, 2018, DOI: 10.1016/j.cmet.2018.03.004.
- Miller M., Lefebvre P., Leightner A., Lauber M.A., Fasth M., Rainville P.D., Shave D. Increasing the Productivity of Oligonucleotide Purification through Column Scaling and Method Optimization. 2024. Waters application note 720008266.
- Rentel C, Gaus H, Bradley K, Luu N, Kolkey K, Mai B, Madsen M, Pearce M, Bock B, Capaldi D. Nucleic Acid Therapeutics, Vol 32, Number 3, 2022, DOI: 10.1089/nat.2021.0056
720009070, October 2025