Application Brief
This is an Application Brief and does not contain a detailed Experimental section.
Robert S. Plumb, Nikunj Tanna
Waters Corporation, United States
Published on November 07, 2025
This is an Application Brief and does not contain a detailed Experimental section.
Precursor ion, constant neutral loss and product ion scanning experiments are powerful mass spectrometry tools which can be used for tracking and confirming the identity of drug-related metabolites in drug candidate preclinical development and human studies. The speed and sensitivity of the Xevo TQ Absolute XR mass spectrometer, combined with these scanning modes which can be configured on the waters_connect for quantitation software making it an ideal platform for drug development laboratories. These acquisition modes were applied to the analysis of urine samples derived from the oral administration of the antihistamine compound methapyrilene to male rats at 50 and 150 m/Kg. The derived MS/MS data allowed for the metabolite identity and localization of the site of metabolism to be confirmed.
Drug Metabolism and Pharmacokinetics (DMPK) studies to support drug discovery and development, provide information of the extent of exposure to the drug, route and rate of elimination and the metabolic fate of the molecule. Analytical support for these studies involves the detection and quantification of the dosed drug and resulting metabolites in a variety of biological fluids (blood, plasma, urine, tissue etc.) and in vitro samples. Tandem quadrupole LC-MS/MS is the dominant technique for the quantitative measurement of drug and metabolites concentrations in DMPK studies due to its sensitivity and speed when operated in multiple reaction monitoring (MRM) or single ion monitoring (SIR) mode. Drug metabolite de novo structural elucidation normally accomplished using accurate mass LC-MS/MS and/or NMR.
During the course of a drug development program multiple studies are performed in cell lines, laboratory animals and humans to identify the effect of dose level on pharmacokinetics, metabolites formation, efficacy, off target pharmacology and toxicity. In these studies it is often necessary to scan for reactive metabolites or confirm and compare the metabolic profile of the drug candidate in multiple studies, e.g., comparing inter species profiles or in a dose escalation study. This metabolite comparison/confirmation can be quickly and efficiently achieved using the neutral loss, precursor ion and product ion scanning functions of a modern tandem quadrupole mass spectrometer such as the Xevo TQ Absolute XR.
This application note describes the acquisition and analysis of neutral loss, precursor ion scanning and product ion scanning data from rat urine samples following the oral dosing methapyrilene using the Xevo TQ Absolute XR mass spectrometer and waters_connect for quantitation software solution.
Rat urine was obtained from a 5- day repeat dose study in the male wistar rat following the oral administration of methapyrilene at either 50 or 150 mg/Kg/day (see Wilson et-al J.Pharma, Biomed. Anal [1]). The urine samples were collected on ice and store frozen at -20 °C prior to analysis. The samples were prepared by protein precipitation with acetonitrile (1:2), following centrifugation (9,000g) the resulting samples was diluted 1:10 with water and a 1 µL of extract was injected onto the chromatography system for analysis by UPLC/MS/MS.
The urine samples were analyzed using reversed–phase chromatography on a 2.1 x 50 mm CORTECS™ C18 2.7 µm Column (p/n: 186007365). The column was maintained at 40 °C and eluted with a linear reversed–phase gradient of 5 – 40% over 10 minutes at 600 µL/min using aqueous 0.1% formic acid as mobile phase solvent A, and 0.1% formic acid in 95:5 (v/v) acetonitrile:water as mobile phase B.
The column effluent was monitored by +ve ESI on the Waters™ Xevo TQ Absolute XR Mass Spectrometer using neutral loss, precursor ion scanning, and product ion scanning. The cone voltage was set to 25 V and a collision energy of 30 eV was employed for all experiments. Neutral loss was acquired for the loss of m/z = 80 over the mass range of m/z = 82 – 500 and m/z = 176 or the mass range m/z = 178 – 600. Precursor ion scanning was performed for the product ions m/z = 97, 119, 135 and 233 over the mass range m/z = 50 – 500. Product ion scanning was performed for the precursor masses m/z = 262, 440, and 454 over the mass range m/z = 50 – 550, relating to the dosed compound, the desmethyl glucuronide, and O-glucuronide metabolites of methapyrilene, respectively.
Instrument control and data analysis was performed using waters_connect for Quantitation Software (including, acquisition method editor, sample submission) and waters_connect LC-MS Toolkit.
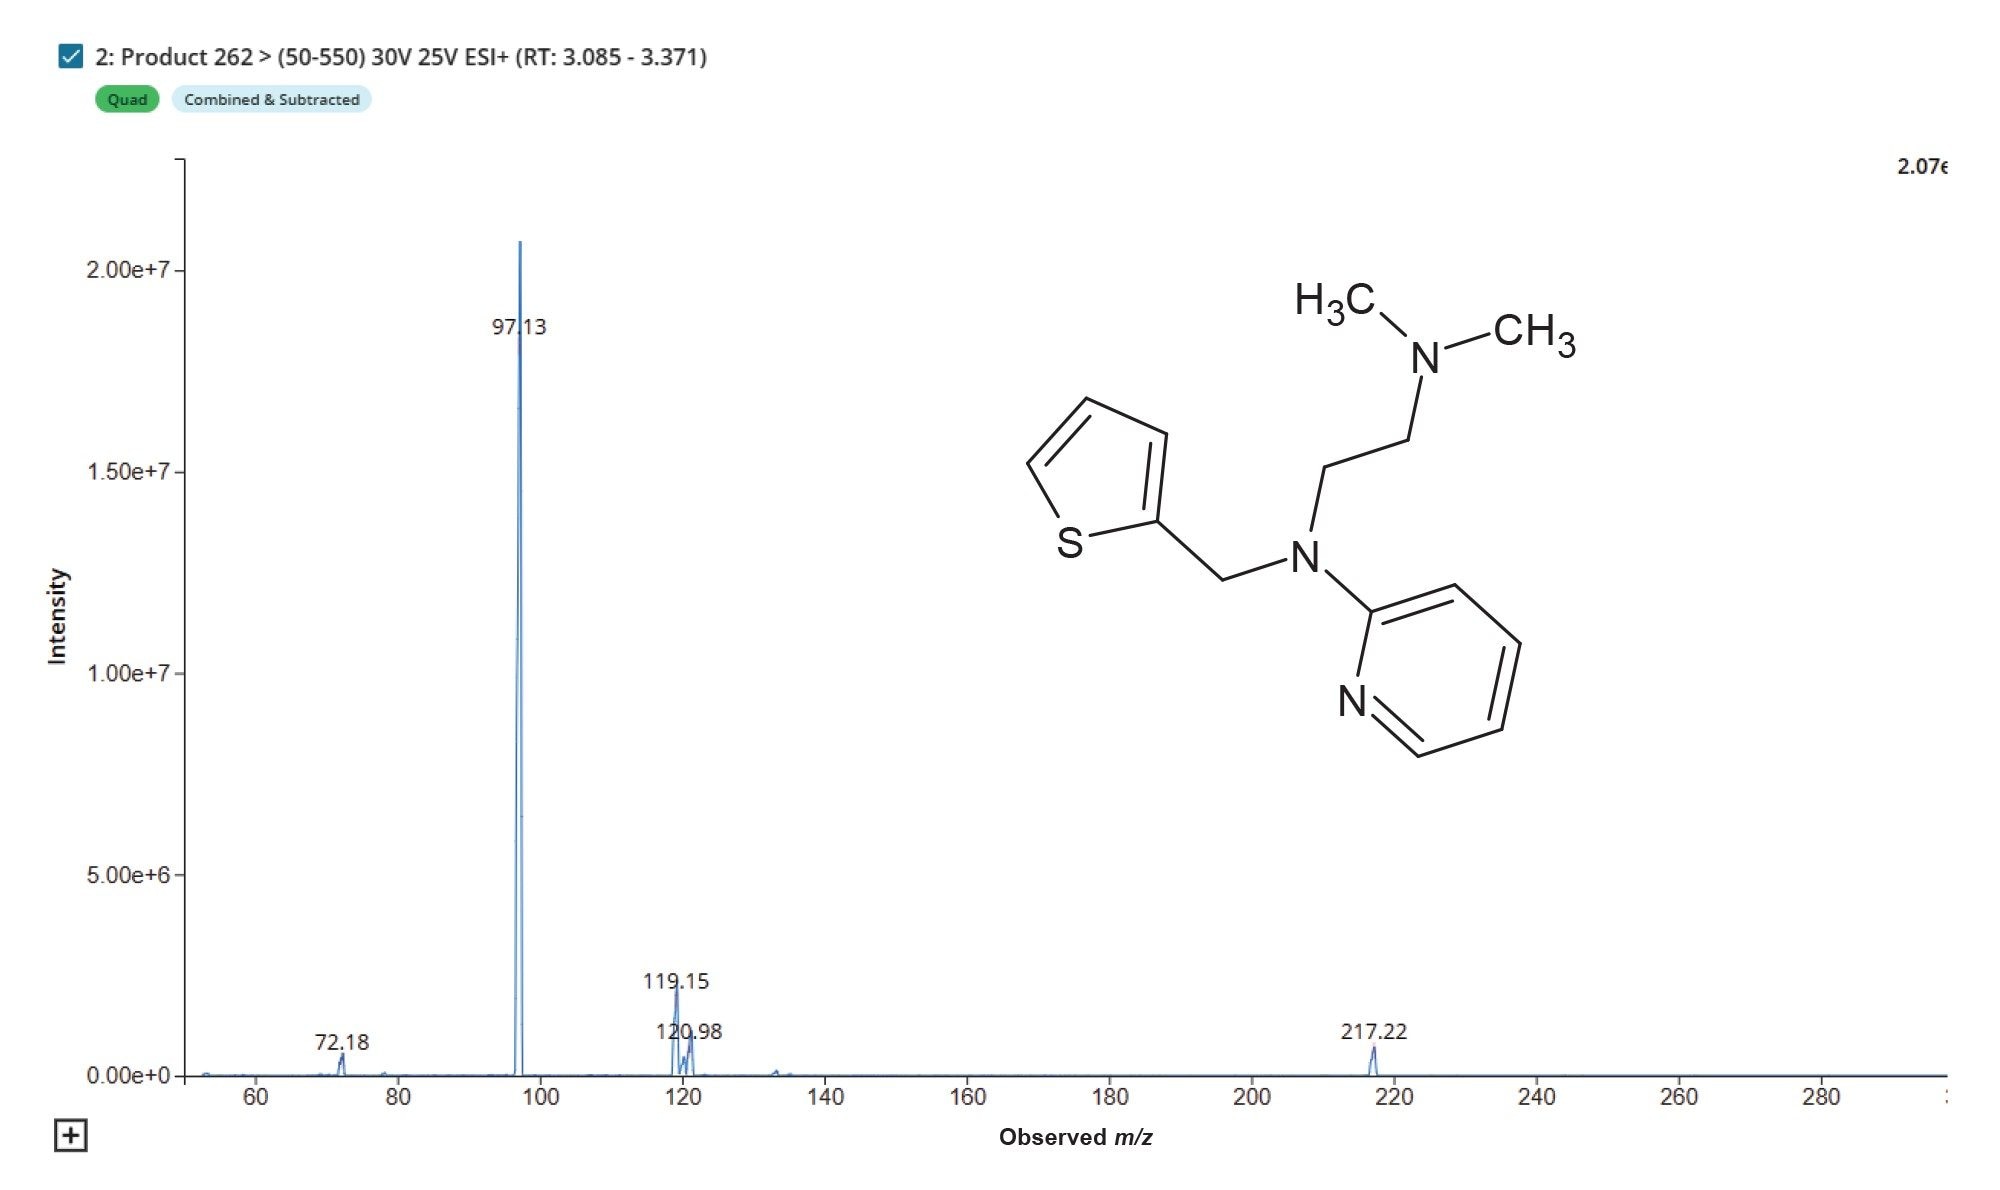
Methapyrilene (MP) eluted from the chromatographic system with retention time of tR = 3.2 min with a base peak of m/z = 262. MS/MS analysis of this peak resulted three diagnostic peak m/z = 217, 119 and 97 which relate to the loss of the tertiary amine moiety, the pyridine ion fragment and the thiophene ring fragment ion respectively, Figure 1.
In drug development samples resulting from reactive metabolite screening, dose ranging, longer term administration, and gender and species comparison studies are routinely profiled to confirm the identity of drug related peaks and monitor changes in metabolite abundance. This task can be quickly achieved using the precursor ion, product ion, and constant neutral loss scanning functions of a modern tandem quadrupole mass spectrometer.
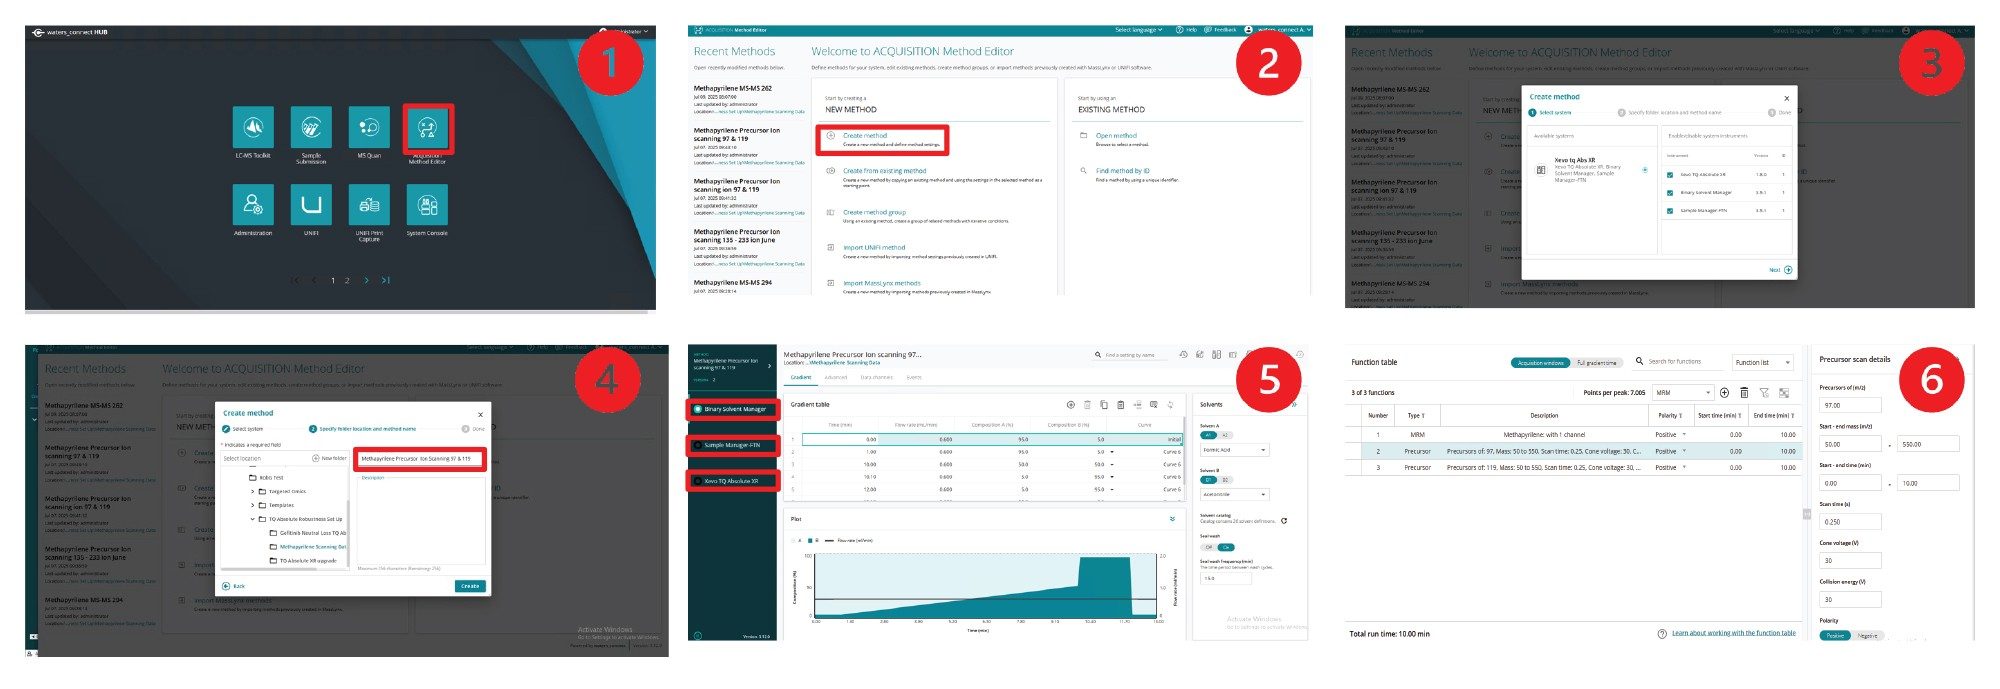
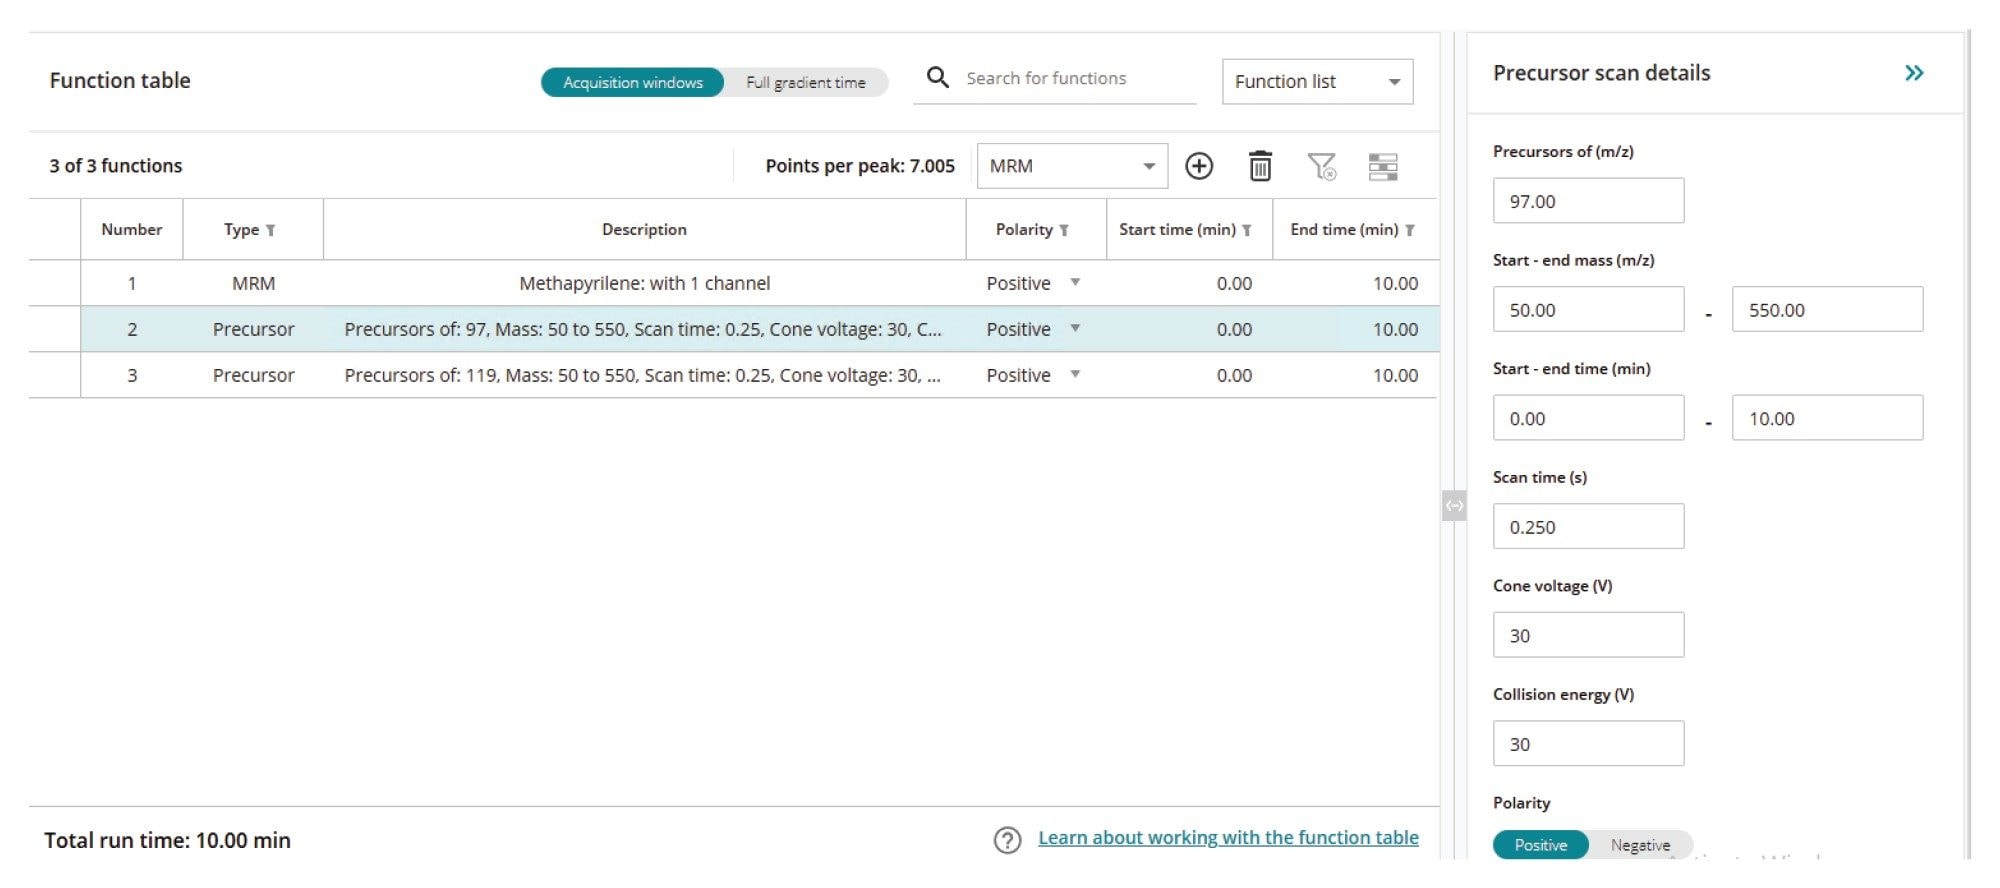
These MS-MS scanning experiments can be quickly configured and executed in the waters_connect for Quantitation software. To create the MS/MS experiment from the waters_connect MS Hub (1), select the acquisition method editor (2), then click on create a new method, select the instrument to be used (3), assign a name to the method (4). Then, using the selection button, set up the chromatographic and autosampler conditions (5). Finally, the MS acquisition parameters can be defined by selecting the mass spectrometer (6), Figure 2. Both MRM and scanning experiments can be selected and executed at the same time by toggling between the analyte list and function list. Multiple scanning functions can also be simultaneously acquired. The scanning functions available include full scan MS, precursor ion scanning, product ion scanning, and constant neutral loss. An example precursor ion scanning method for ion m/z = 97 and 119 with simultaneous MRM data collection in Figure 3.
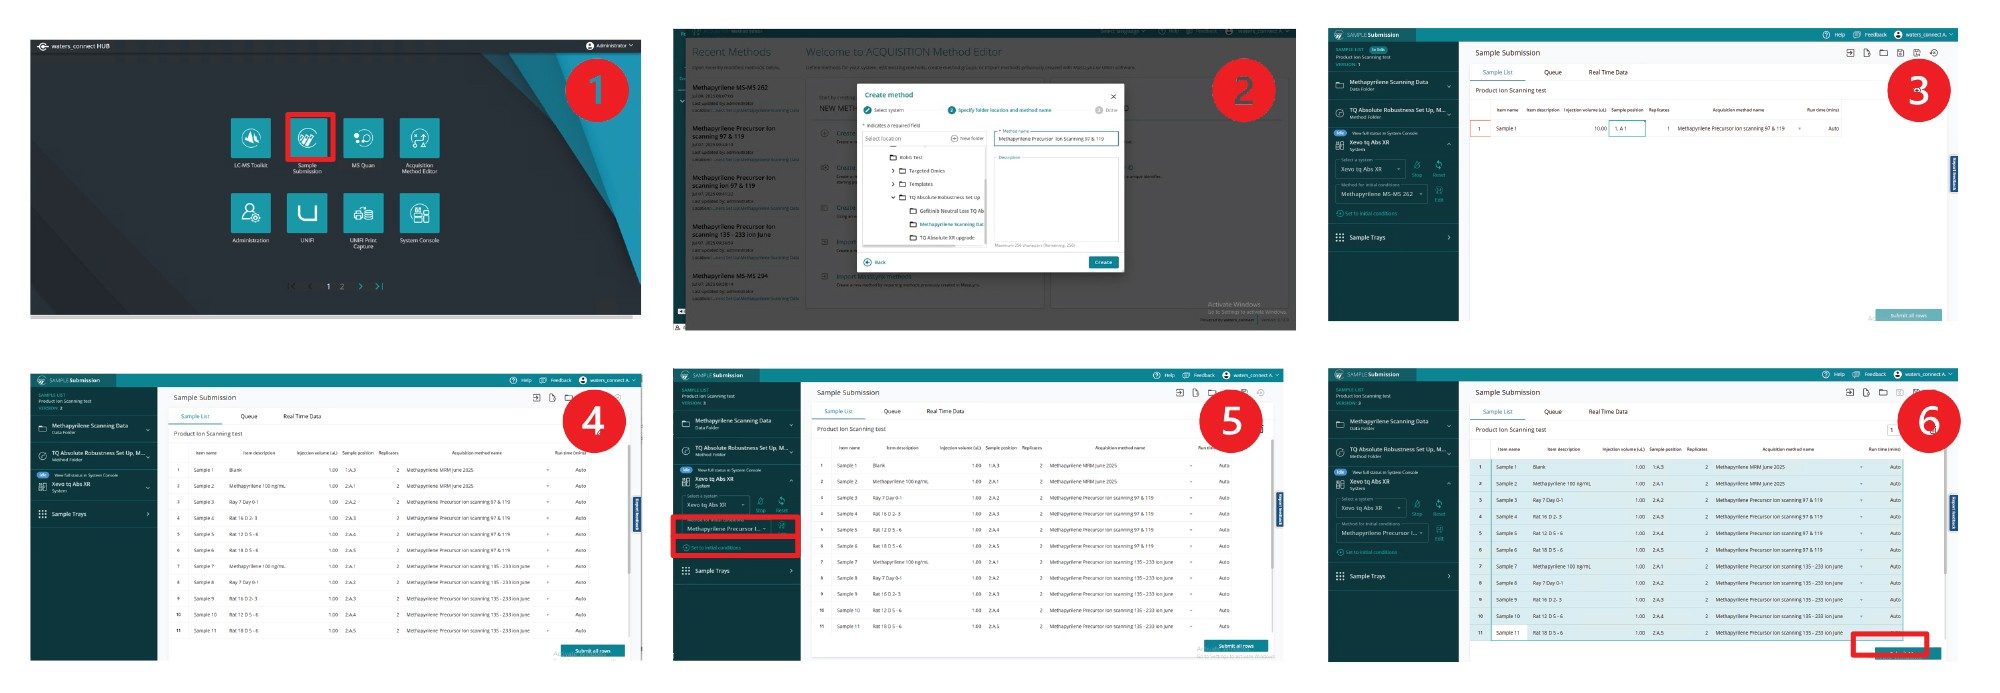
After creating the LC and MS experimental method, study samples can be processed by selecting sample submission from the waters_connect Software hub (1). After selecting the appropriate project, a name is assigned to the sample batch (2) and a sample list can then be completed by assigning sample ID, injection volume, and selecting the method or methods to be used (3-4). Once the batch has been saved the data file location and LC-MS method can be selected on the left hand side green panel and the instrument set to initial conditions (5). When the instrument signal and LC conditions are stable, the samples to be analyzed can be selected and the batch queued for acquisition (6), Figure 4.
Precursor ion scanning is a powerful MS acquisition mode on a tandem quadrupole mass spectrometer that can be used to detect analytes in a sample in which all have the same core features. In this mode of acquisition, first, the resolving quadrupole is operated in scanning mode over a predetermined range while the final resolving quadrupole of the MS is set to detect specific fragment ions (m/z values) formed in the collision cell. In this mode, drug related peaks are detected by the presence of a common fragment ion and the precursor mass of these features is identified.
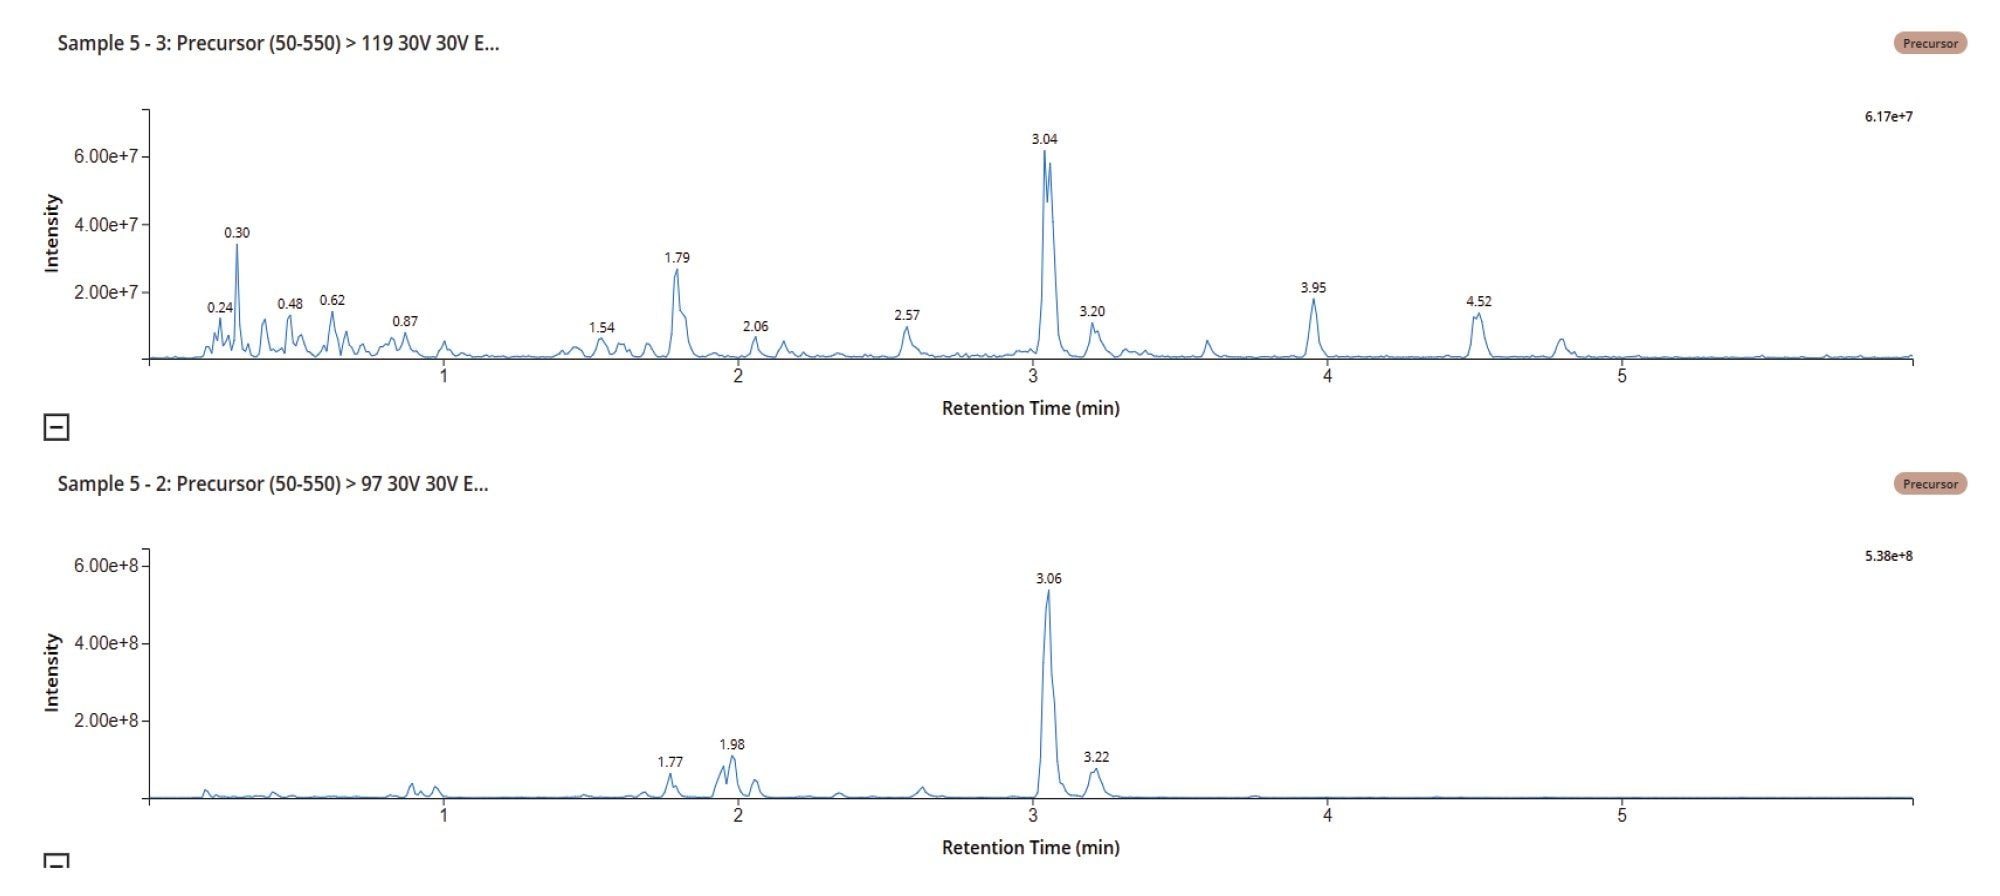
Previously studies have shown that oxygenation on the aliphatic chain, tertiary amine, and pyridine is a primary route of MP metabolism. The urine samples were investigated using precursor ion scanning of the diagnostic fragment ions m/z = 217, 119, and 97 of methapyrilene and m/z = 233 & 135, which represent oxygenation of the m/z = 217 & 119 fragments. The data displayed in Figure 5 show the chromatograms obtained from the urine sample D5 50 mg/Kg using precursor ion scanning for m/z = 97 and 119.
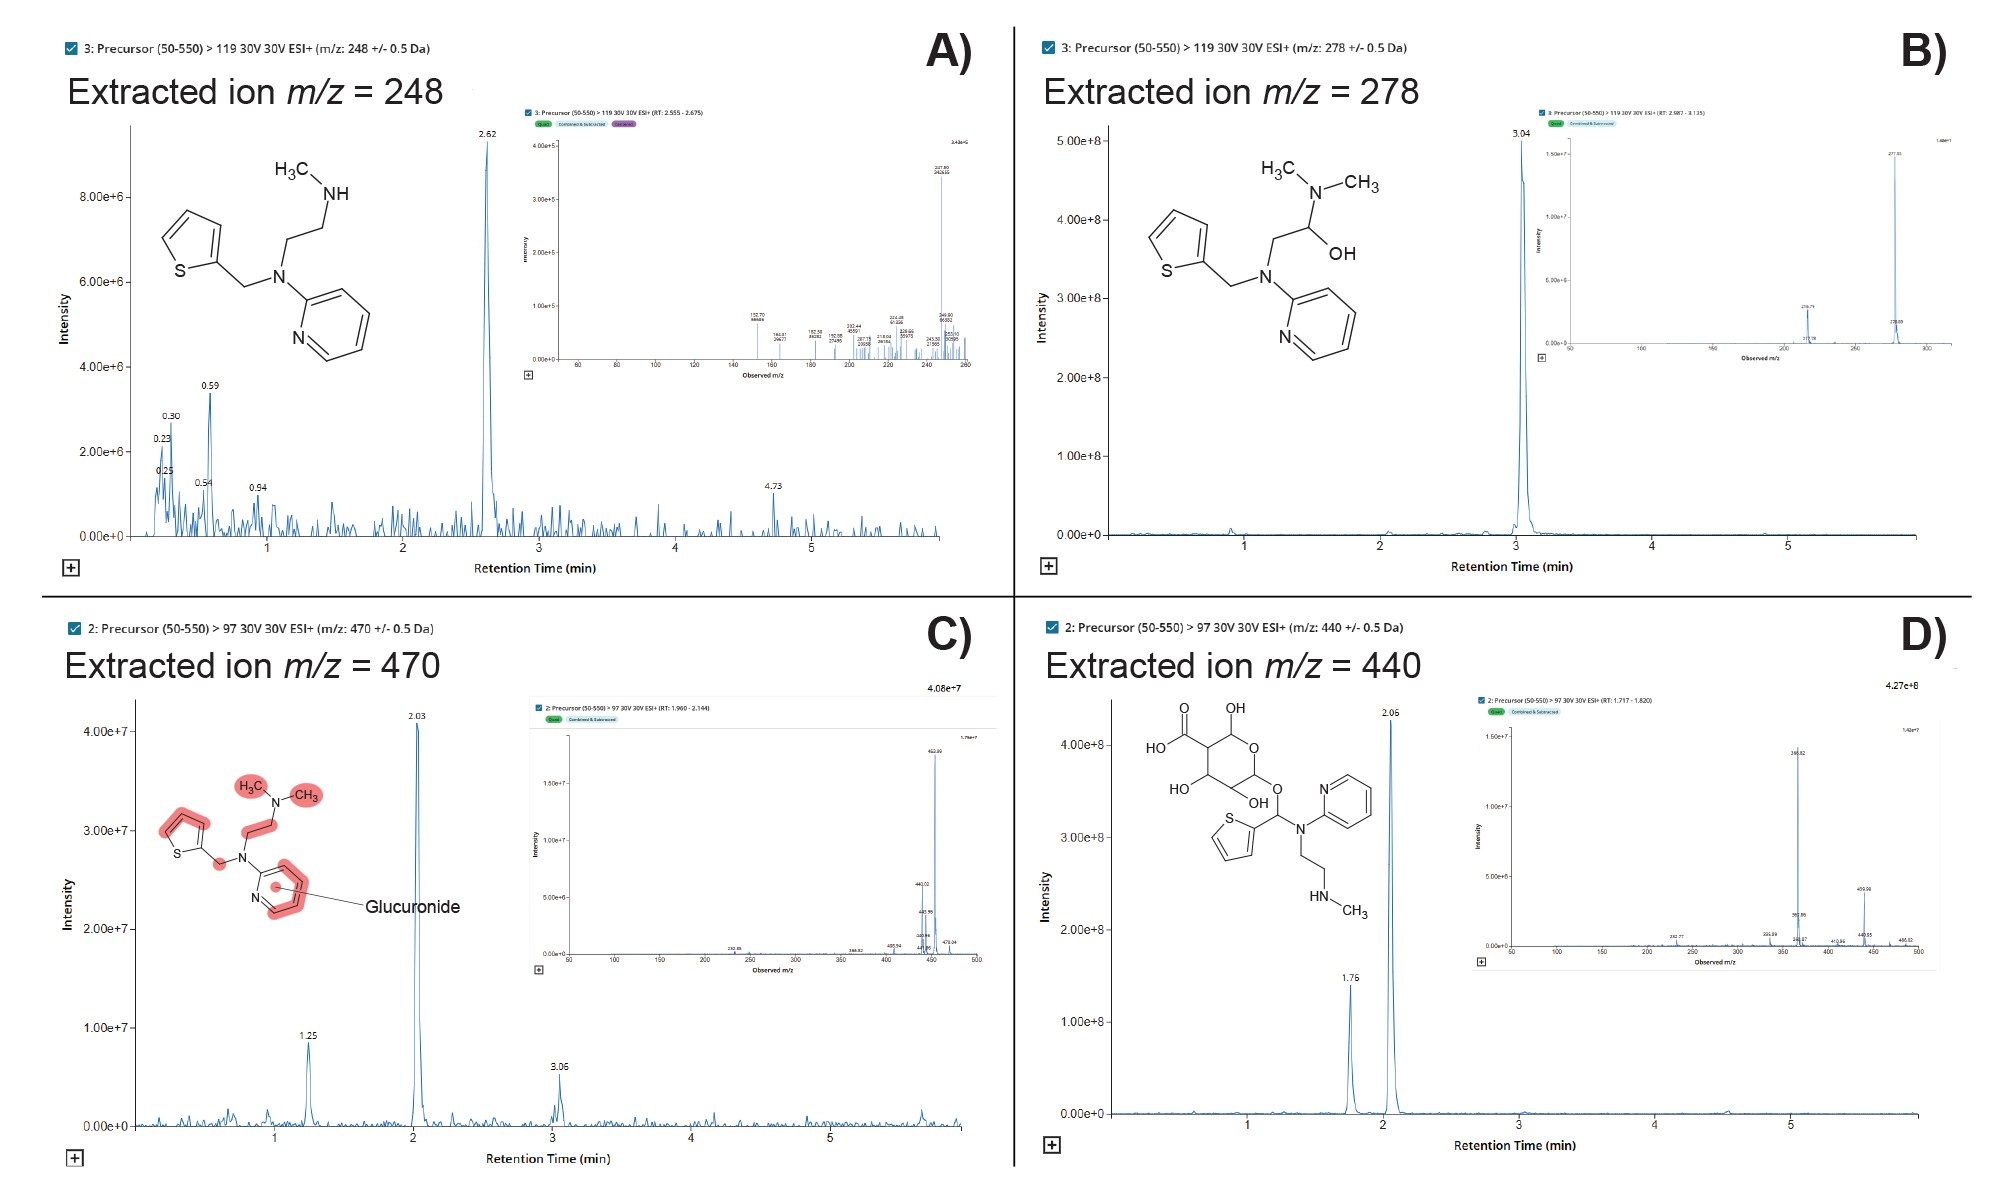
The resulting data was interrogated, using LC-MS Toolkit, to detect drug-related material and metabolite confirm the identity via using the derived MS2 spectrum, with the peak at tR = 2.82, min m/z = 248 (A) being identified as the desmethyl metabolite, the peak at tR = 3.04, min m/z = 278 (B) corresponded to the hydroxyl metabolite of methapyrilene, the peak at tR = 2.03, min m/z = 470 (C) was confirmed as the dihydroxy glucuronide metabolite and the peak at tR = 1.76, min m/z = 440 (D) corresponded to the desmethyl O-glucuronide metabolite, Figure 6.
Constant neutral loss (CNL) is a mass spectrometry acquisition mode that can be used to profile DMPK samples for structural fragment ions or common metabolic species such as sulphation, glucuronidation, or the formation of glutathione. In this mode of acquisition, both the first and final resolving quadrupole are operated in scanning mode with a user determined off-set, m/z value.
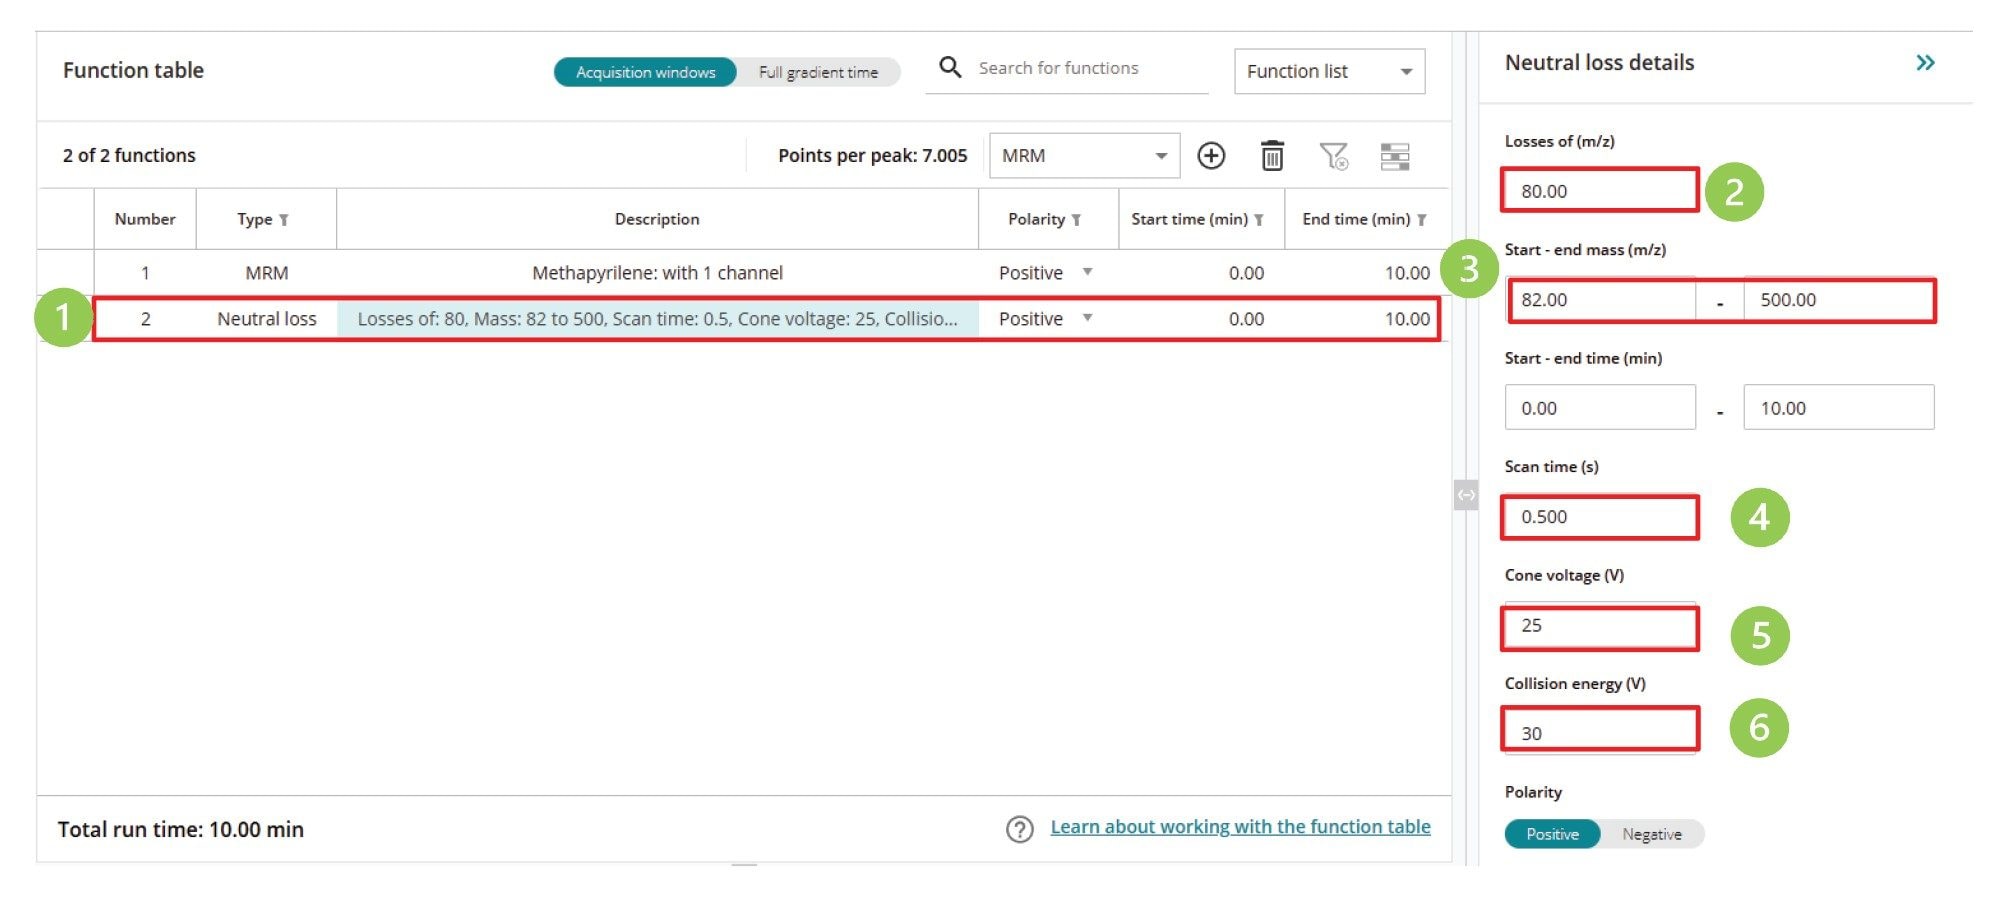
These CNL experiments are quickly and easily configured in waters_connect Software using the same procedure employed to create the precursor ion scanning experiment using the acquisition method editor. Once the neutral loss function has been selected (1), the following values are defined (2) constant neutral loss mass can be selected, (3) scanning mass range, (4) scan speed, (5) cone voltage, and (6) collision energy, Figure 7.
Common drug metabolism conjugation reactions include sulphation, glucuronidation, glycosidation, methylation, acetylation, fatty acid conjugation, and glutathione conjugation. With glucuronidation and sulphation being the most widespread of the conjugation reactions, glutathione conjugation is used by the body to remove potentially toxic electrophile compounds. Features arising from these conjugation reactions can be quickly screened for using CNL experiments, e.g., 80 Da for sulphation, 176 Da for glucuronides, and loss of 129 Da (pyroglutamic acid) for glutathione. Examples of the chromatograms obtained from the analysis of rat urine on D5 following the repeat oral administration of methapyrilene at 50 mg/Kg in Figure 8.
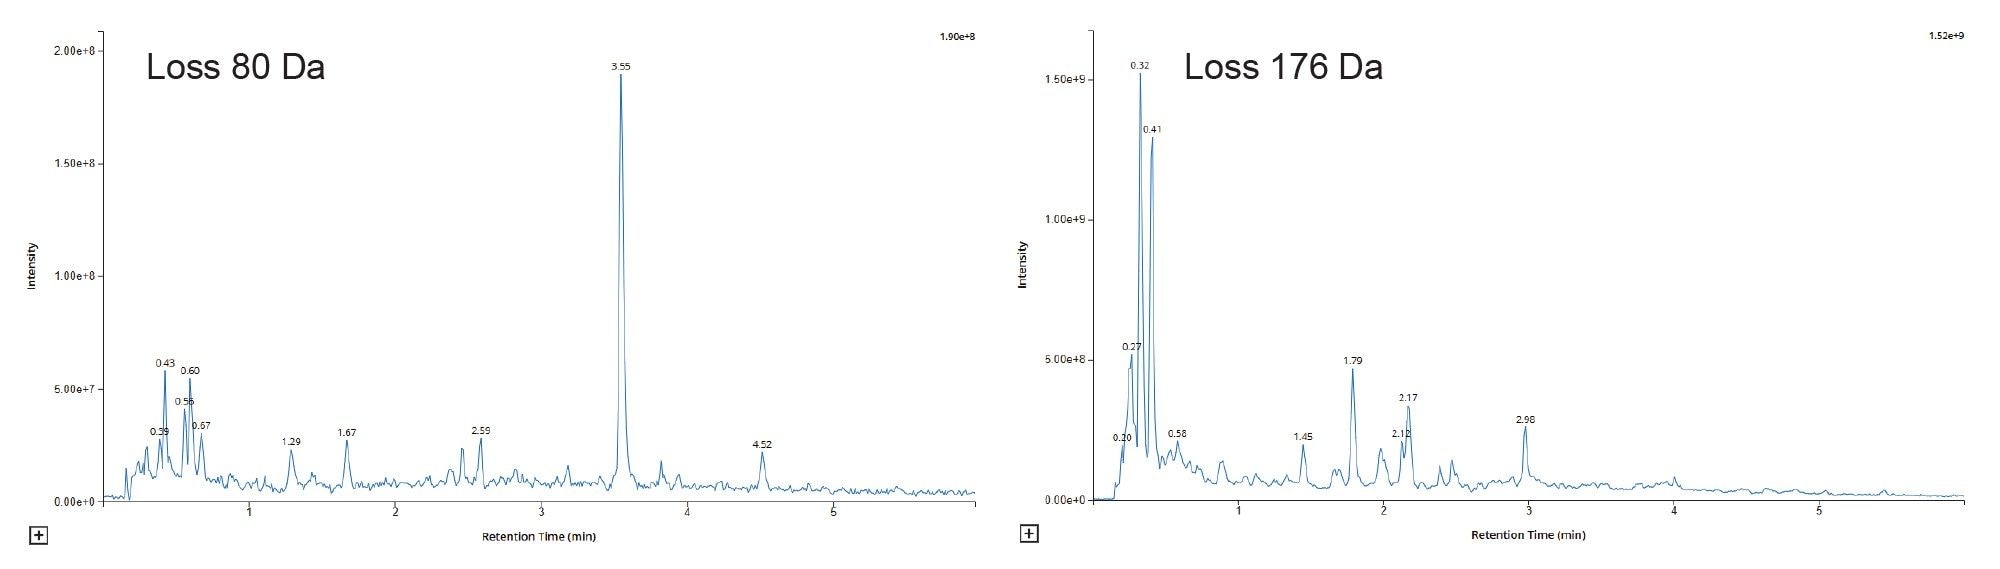
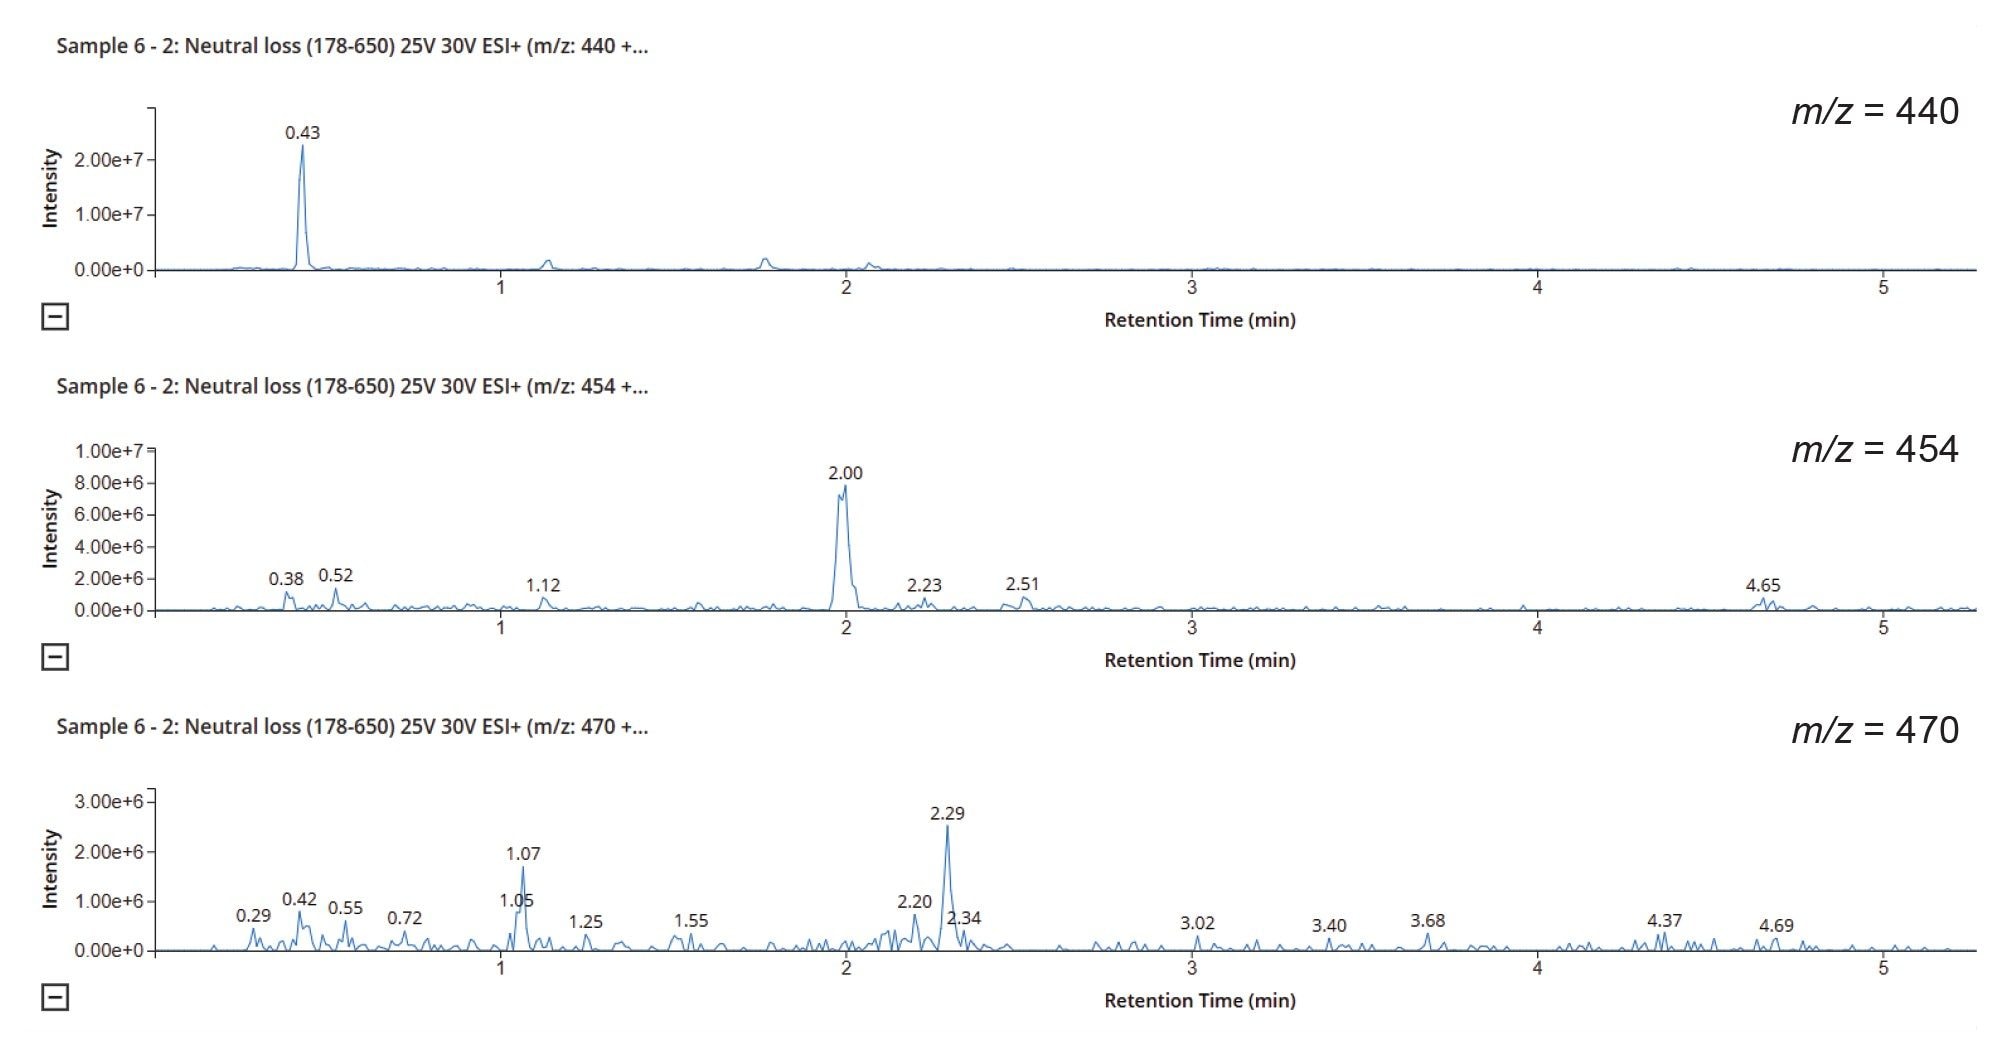
Analysis of the derived data showed that none of the features observed in the CNL = 80 Da chromatogram were drug related. Analysis of the CNL = 176 Da showed that several of the detected peaks were potentially drug related, including dimethyl glucuronide metabolites (m/z = 440), O-glucuronide metabolites (m/z = 454), and dehydroxylated glucuronide metabolites (m/z = 470), Figure 9. The derived data can be used in conjunction with the precursor ion scanning results to identify and classify drug related products in DMPK profiling or reactive metabolite screening studies to streamline compound selection or progression.
Product ion scanning can be used to quickly confirm whether an analyte peak is drug related and identify the possible site of biotransformation. In this product ion scanning acquisition mode, the first resolving quadrupole is set to allow the transition of specific precursor ion(s) (m/z = values), which relate to specific metabolite species. These ions are transferred to the collision cell where they are fragmented using a preset collision energy values for each channel, the resulting fragment ions are then transferred to the final resolving quadrupole which is operated in scanning mode across a predefined m/z range. The scan speed can be adjusted depending upon the number of points required across the chromatographic peak, the peak width, and the number of other functions in the method. This mode of acquisition can be combined with other acquisition modes such as MRM or RADAR to increase the information generated per analytical run.
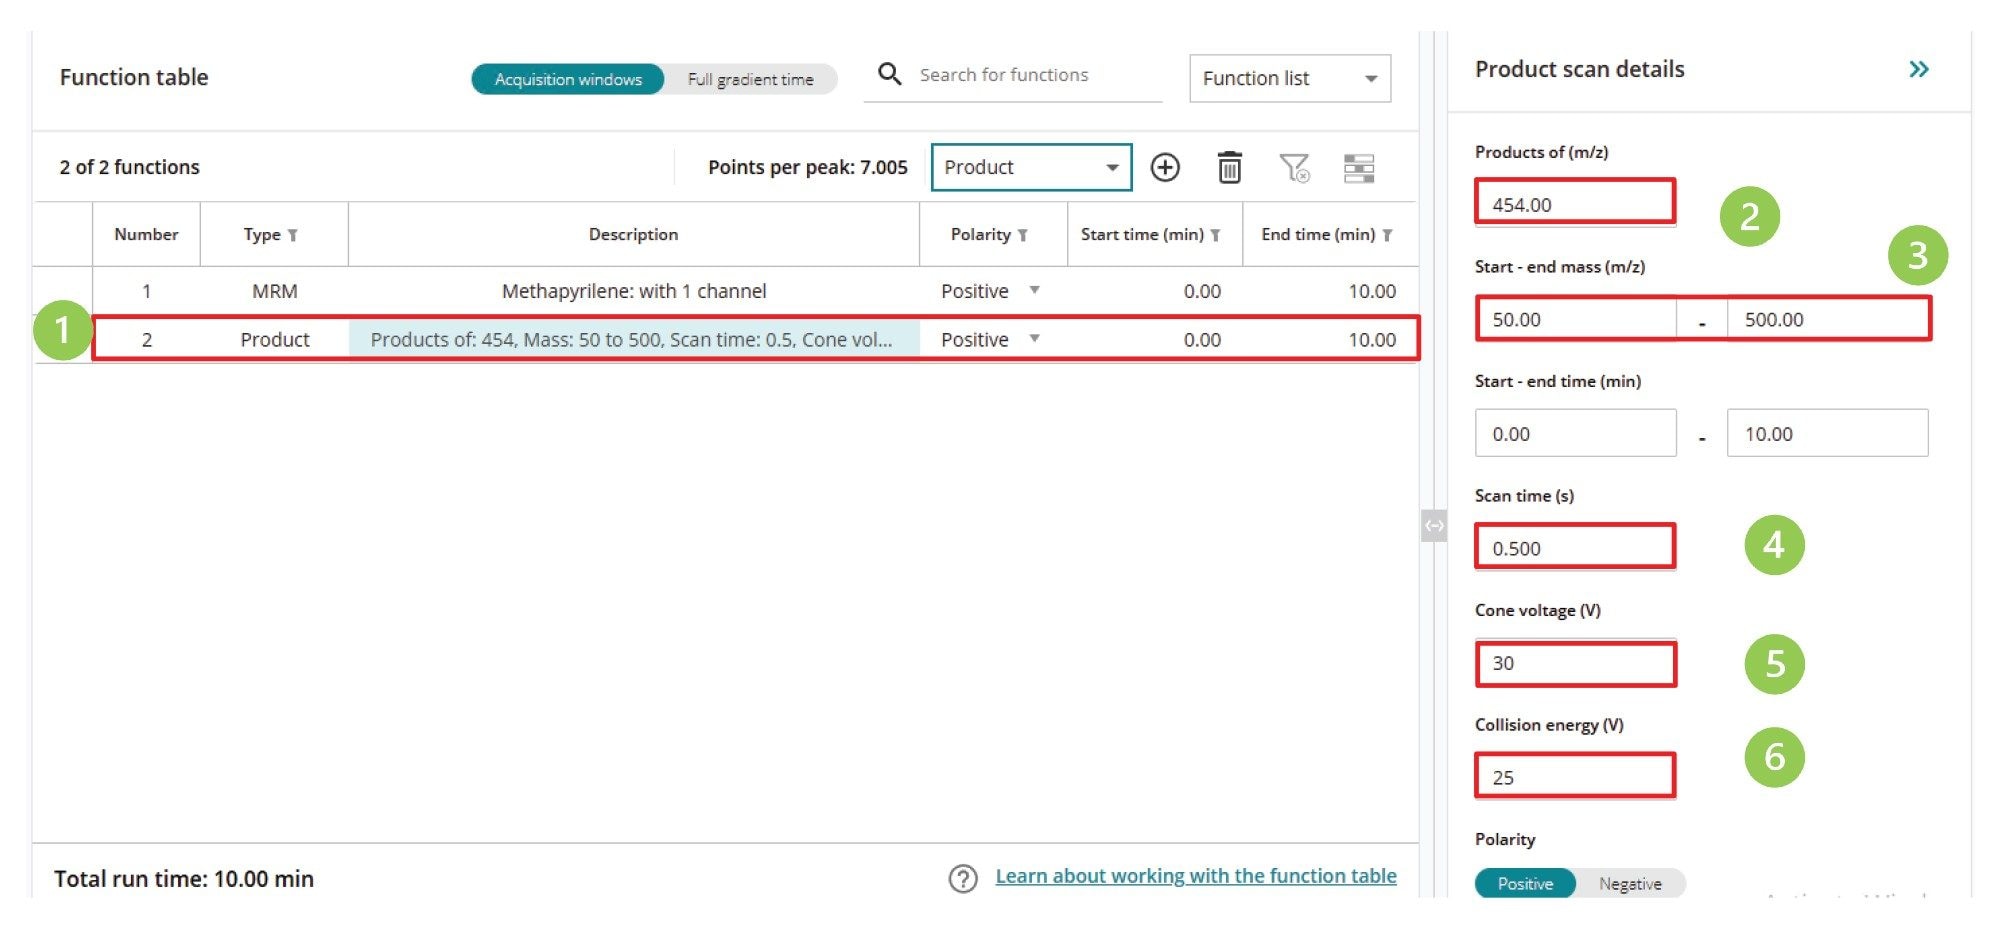
This MS acquisition method is configured in a similar manner to the previous scanning experiments. After the LC and autosampler conditions have been determined, the mode of MS acquisition is defined in the MS acquisition window (1), then the precursor ion (2), mass range (3), scan time (4) cone voltage (5), and collision energy are defined. The method is then saved and is ready for use, Figure 10.
Product ion scanning data was collected in +ve ESI mode from rat urine samples at the 50 mg/Kg ad 150 mg/Kg level for the features m/z = 262, 440, and 454 relating to methapyrilene, and the desmethyl glucuronide, and O-glucuronide metabolites of methapyrilene, respectively. Product ion analysis of methapyrilene authentic standard gave rise to fragment ions m/z = 78.12, 97.13, 119.15 and 217.22, which relate to the fragment ion i) thiophene ring, ii) tertiary amine – ethyl chain moiety, ii) pyridine ring moiety and loss of tertiary amine, respectively.
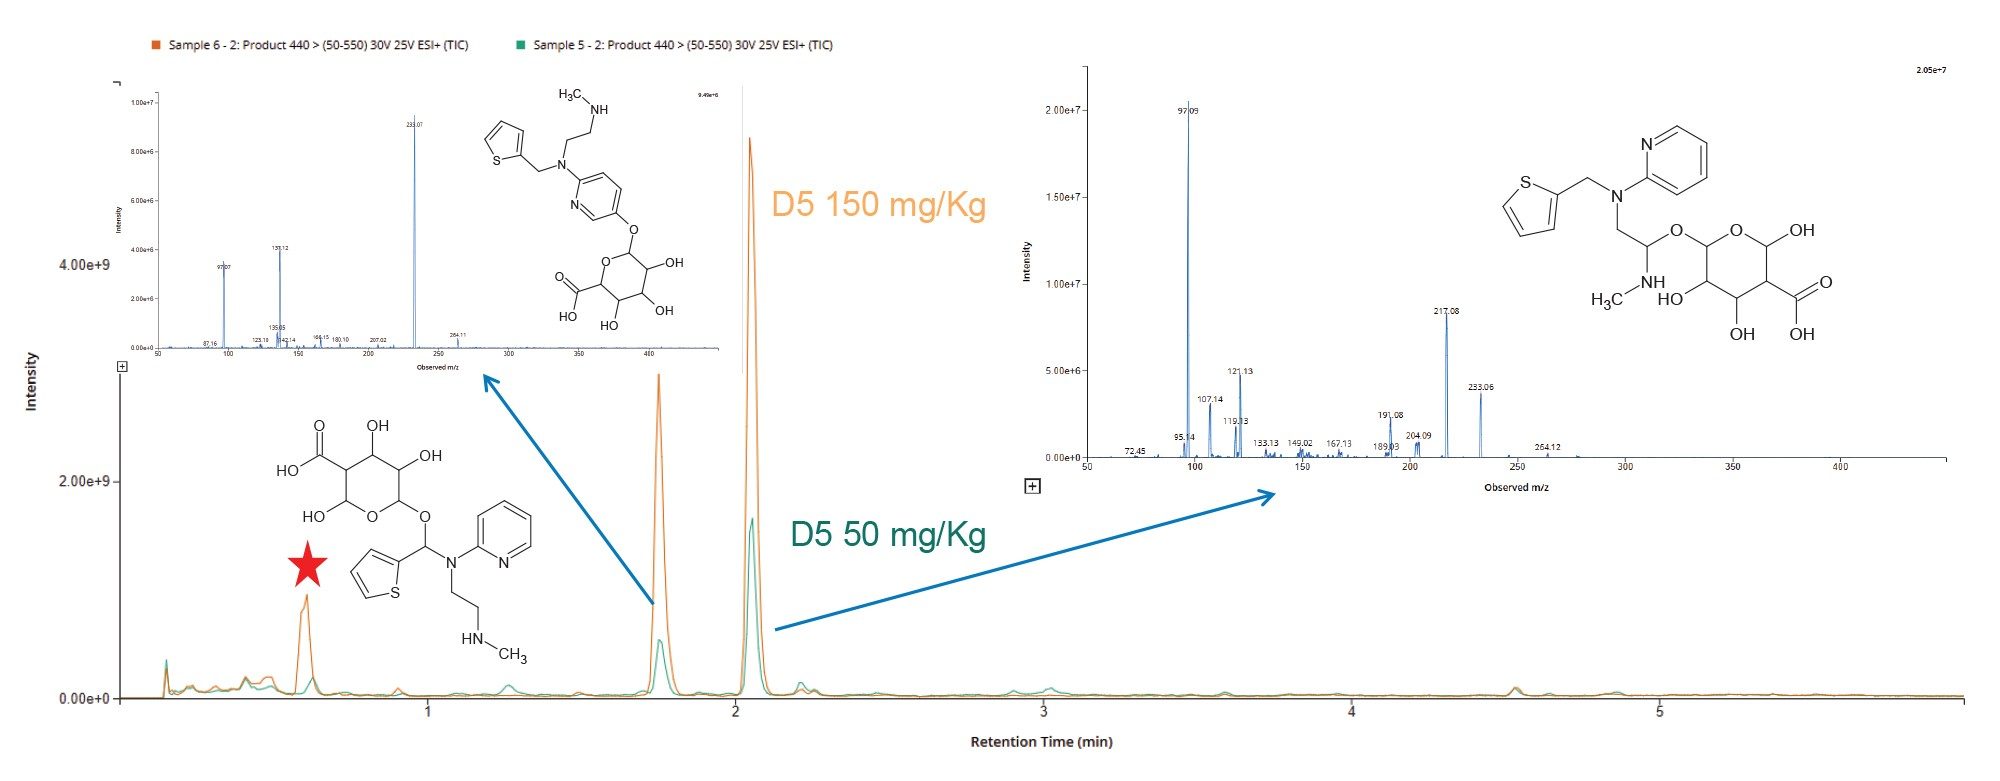
Urine analysis using the product ions m/z = 440 showed significant difference in the extracted ion profile for the D5 50 and 150 mg/Kg dose levels, Figure 11. The LC-MS/MS data shows that there are two major product ions for the desmethyl glucuronide metabolite (m/z = 440) eluting at tR = 1.7 and 2.1 minutes. Analysis of the spectrum produced by these two peaks allowed for the structure and site of metabolism to be confirmed as demethylation followed by O-glucuronidation on the pyridine ring (tR = 1.7 min) and O-glucuronidation on the aliphatic chain, Figure 11. There is also evidence of an extra peak in the 150 mg/Kg dose sample eluting with a retention time of tR = 0.63 minute. Analysis of the spectrum produced for this peak corresponded to demethylation followed by O-glucuronidation on the C6 carbon connecting the tertiary nitrogen to the thiophene ring.
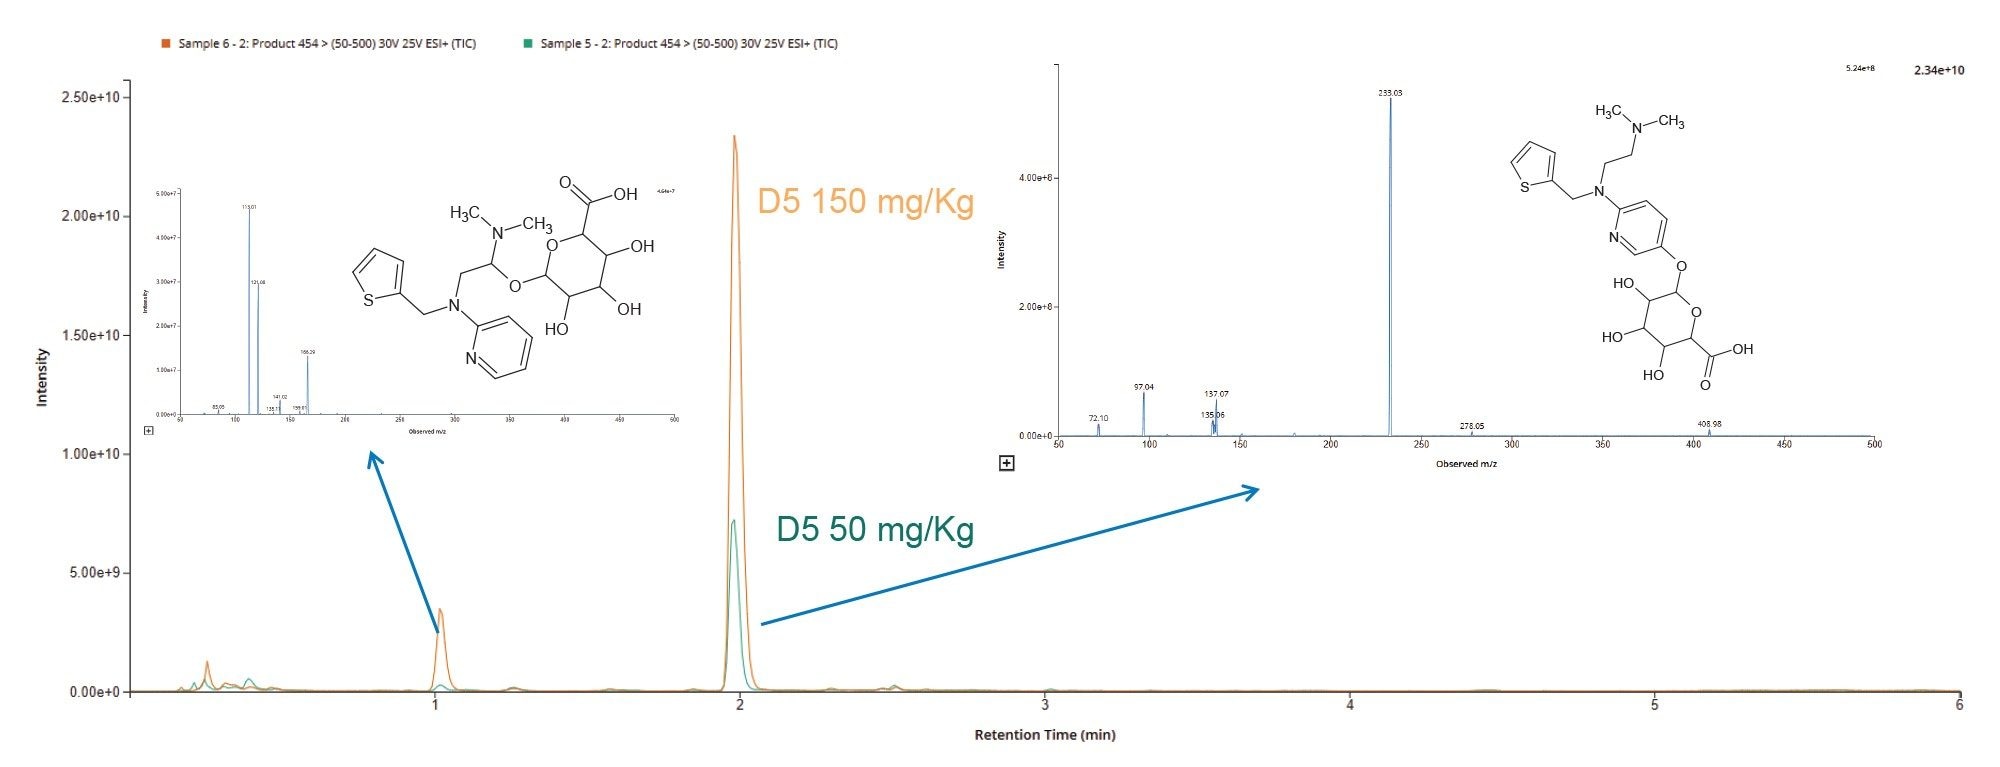
Two major O-glucuronide peaks were observed using +ve ESI product ion scanning of m/z = 454 of the urine samples. The data shows that the methapyrilene metabolic products were consistent between the two dose levels, and the levels appeared to increase consistent with dose level, as shown in Figure 12. Analysis of the spectrum produced for each of these peaks suggests that the peak eluting with a retention time tR = 1.7 min is derived from O-glucuronidation of the aliphatic chain at the C8 or C9 position and the peak eluting at tR = 2.1 minutes relates to O-glucuronide on the pyridine ring.
Tracking and confirming drug metabolites in preclinical or human clinical studies is essential to successful drug candidate development. By employing the scanning functions available on the Waters Xevo TQ Absolute XR Mass Spectrometer, precursor ion scanning, constant neutral loss, and product ion scanning, drug related metabolites can be easily detected and their identity confirmed. These acquisition functions are easy to configure in waters_connect for Quantitation software. The rapid acquisition speed of the Xevo TQ Absolute XR Mass Spectrometer allows these information-rich acquisition modes to be performed in the same acquisition method as MRM acquisition without compromising the quality of the quantitative data.
Samples derived from the oral administration of methapyrilene to male rats was analyzed using the precursor ion, constant neutral loss, and product ion scanning acquisition modes. The data derived from this analysis allowed for the accurate tracking and confirmation of the major drug metabolites in this study.
720009077, October 2025