Comparing Efficiency and Loadability of Sub-2 µm Solid-Core Particle Columns From Various Vendors
Abstract
Column stationary phases can be manufactured in a variety of ways, all of which can have a large impact on column performance in the hands of chromatographers. Varying the type of silica used in making the base particle, or using a different bonding process for the ligand and end capping can impact the retention and selectivity of the separation. Meanwhile, how well a column is packed can affect the peak shape and efficiency of the column. This is why it is important for an analyst to consider different vendors when selecting their columns.
Ultimately, some columns will perform better than others based on the separation requirements defined by the analyst. Part of the performance difference is based on what the column is designed to do, relative to what the analyst is trying to achieve. For instance, a column designed to retain hydrophobic species may not be suitable for the retention of small polar analytes. Most column manufacturers will include the intended purpose of a column in their marketing materials to help guide an analyst in the decision-making process. This application note looks at the efficiency of four different solid-core phases, all of which are designed to be highly efficient compared to fully porous offerings. Additionally, this application note looks at the peak shape for basic analytes at low pH in a loadability study as two of the phases are designed to improve peak shape of basic compounds under those conditions.
Benefits
- Efficiency testing comparison for four different solid-core columns from separate vendors
- Loadability testing showing CORTECS™ C18+ has superior peak shape for basic analytes at low pH compared to solid core columns from other vendors
Introduction
Column manufacturing is a challenging endeavor. Achieving high reproducibility and efficiency for a column stationary phase requires considerable time, effort, and experience. These processes are not only difficult to control but can vary from vendor to vendor as expertise and institutional knowledge varies. The process of creating the stationary phase has a direct impact on column performance for a given assay, through impacts on the particle morphology, surface area, pore size, etc. Taking it one step further, how that material is packed into the column hardware, which can also vary between vendors, can impact the peak symmetry and efficiency of the column. Due to the inherent differences incolumn packing and stationary phase manufacture, it is important to thoroughly test columns for suitability and reproducibility for a given assay.
Experimental
Efficiency Test Sample Description
Stock solutions of thiourea, naphthalene, and acenaphthene created at 1 mg/mL. Octanophenone pure sample used as stock solution. Test mixture created by mixing stock solutions using 60:40 acetonitrile:water diluent to final concentration for thiourea (0.01 mg/mL), naphthalene (0.05 mg/mL), acenaphthene (0.2 mg/mL), and octanophenone (0.1 µL/mL).
Loading Test Sample Description
Stock solutions of amitriptyline and imipramine created at 1 mg/mL using water. Three test samples were created with imipramine (0.5 mg/mL) and various concentrations of amitriptyline per sample. Amitriptyline concentrations were 2.5 µg/mL, 5.0 µg/mL, and 10 µg/mL.
LC Conditions
|
LC system: |
ACQUITY™ UPLC™ H-Class Plus System with Quaternary Solvent Manager (QSM) with optional solvent select valve, Sample Manager Flow Through Needle (SM-FTN), Column Manager, Two Column Manager Auxs, and QDa Mass Detector |
|
Detection: |
254 nm |
|
Columns: |
CORTECS C18+, 2.1 x 50 mm, 1.6 µm (p/n: 186007114) Competitor A C18, 2.1 x 50 mm, 1.9 µm Competitor P C18, 2.1 x 50 mm, 1.7 µm Competitor T C18+, 2.1 x 50 mm, 1.5 µm |
|
Column temperature: |
30 °C |
|
Sample temperature: |
10 °C |
|
Injection volume: |
1.0 µL (efficiency), 5.0 µL (loading) |
|
Flow rate: |
0.50 mL/min (efficiency), 0.6 mL/min (loading) |
|
Mobile phase A: |
Milli-Q Water |
|
Mobile phase B: |
Acetonitrile |
|
Mobile phase C: |
Methanol |
|
Mobile phase D1: |
2% Formic acid in water |
|
Efficiency mobile phase composition: |
60:40 (B:A). Run Time: 5 minutes |
|
Loading test gradient: |
5% Constant D1. Linear gradient of 25–35% B in 2 minutes. Linear gradient to 95% B in 1 minute. Return to 25% B and hold for 2 minutes. Total run time: 5 minutes. |
Data Management
|
Chromatography software: |
Empower™ 3 Feature Release 4 |
Results and Discussion
The four columns selected for this application all contain sub-2 µm solid-core particles from four different vendors. Table 1 shows the critical attributes of the stationary phase as listed on the different vendor's websites.
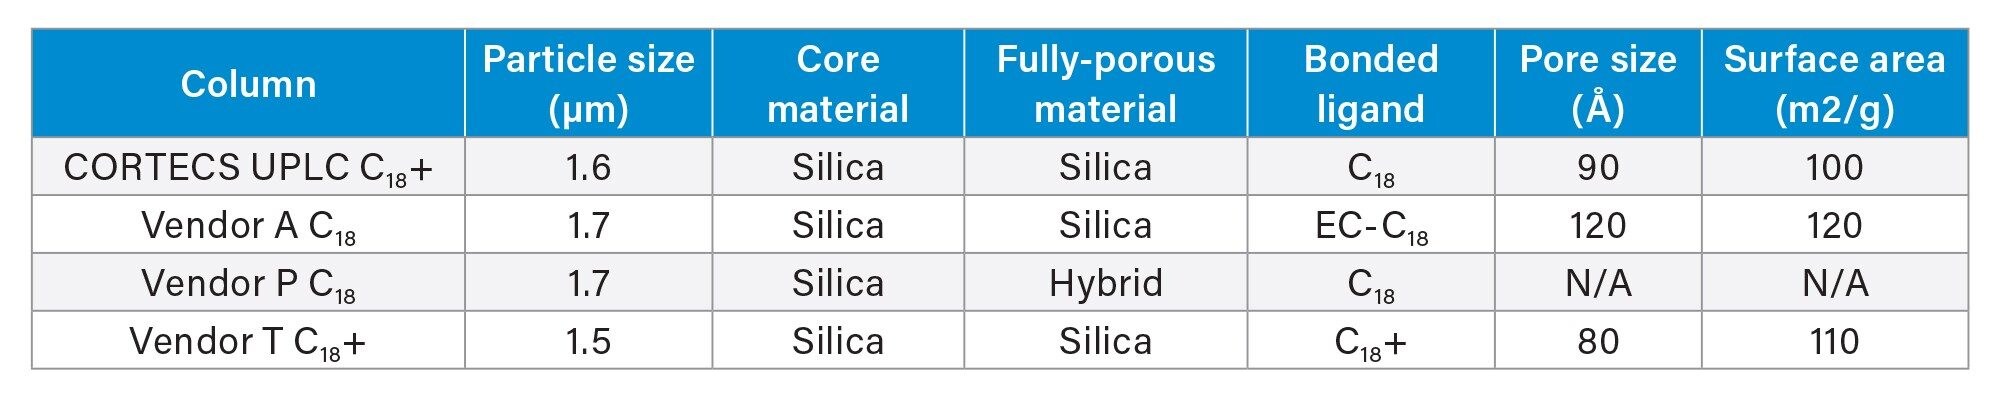
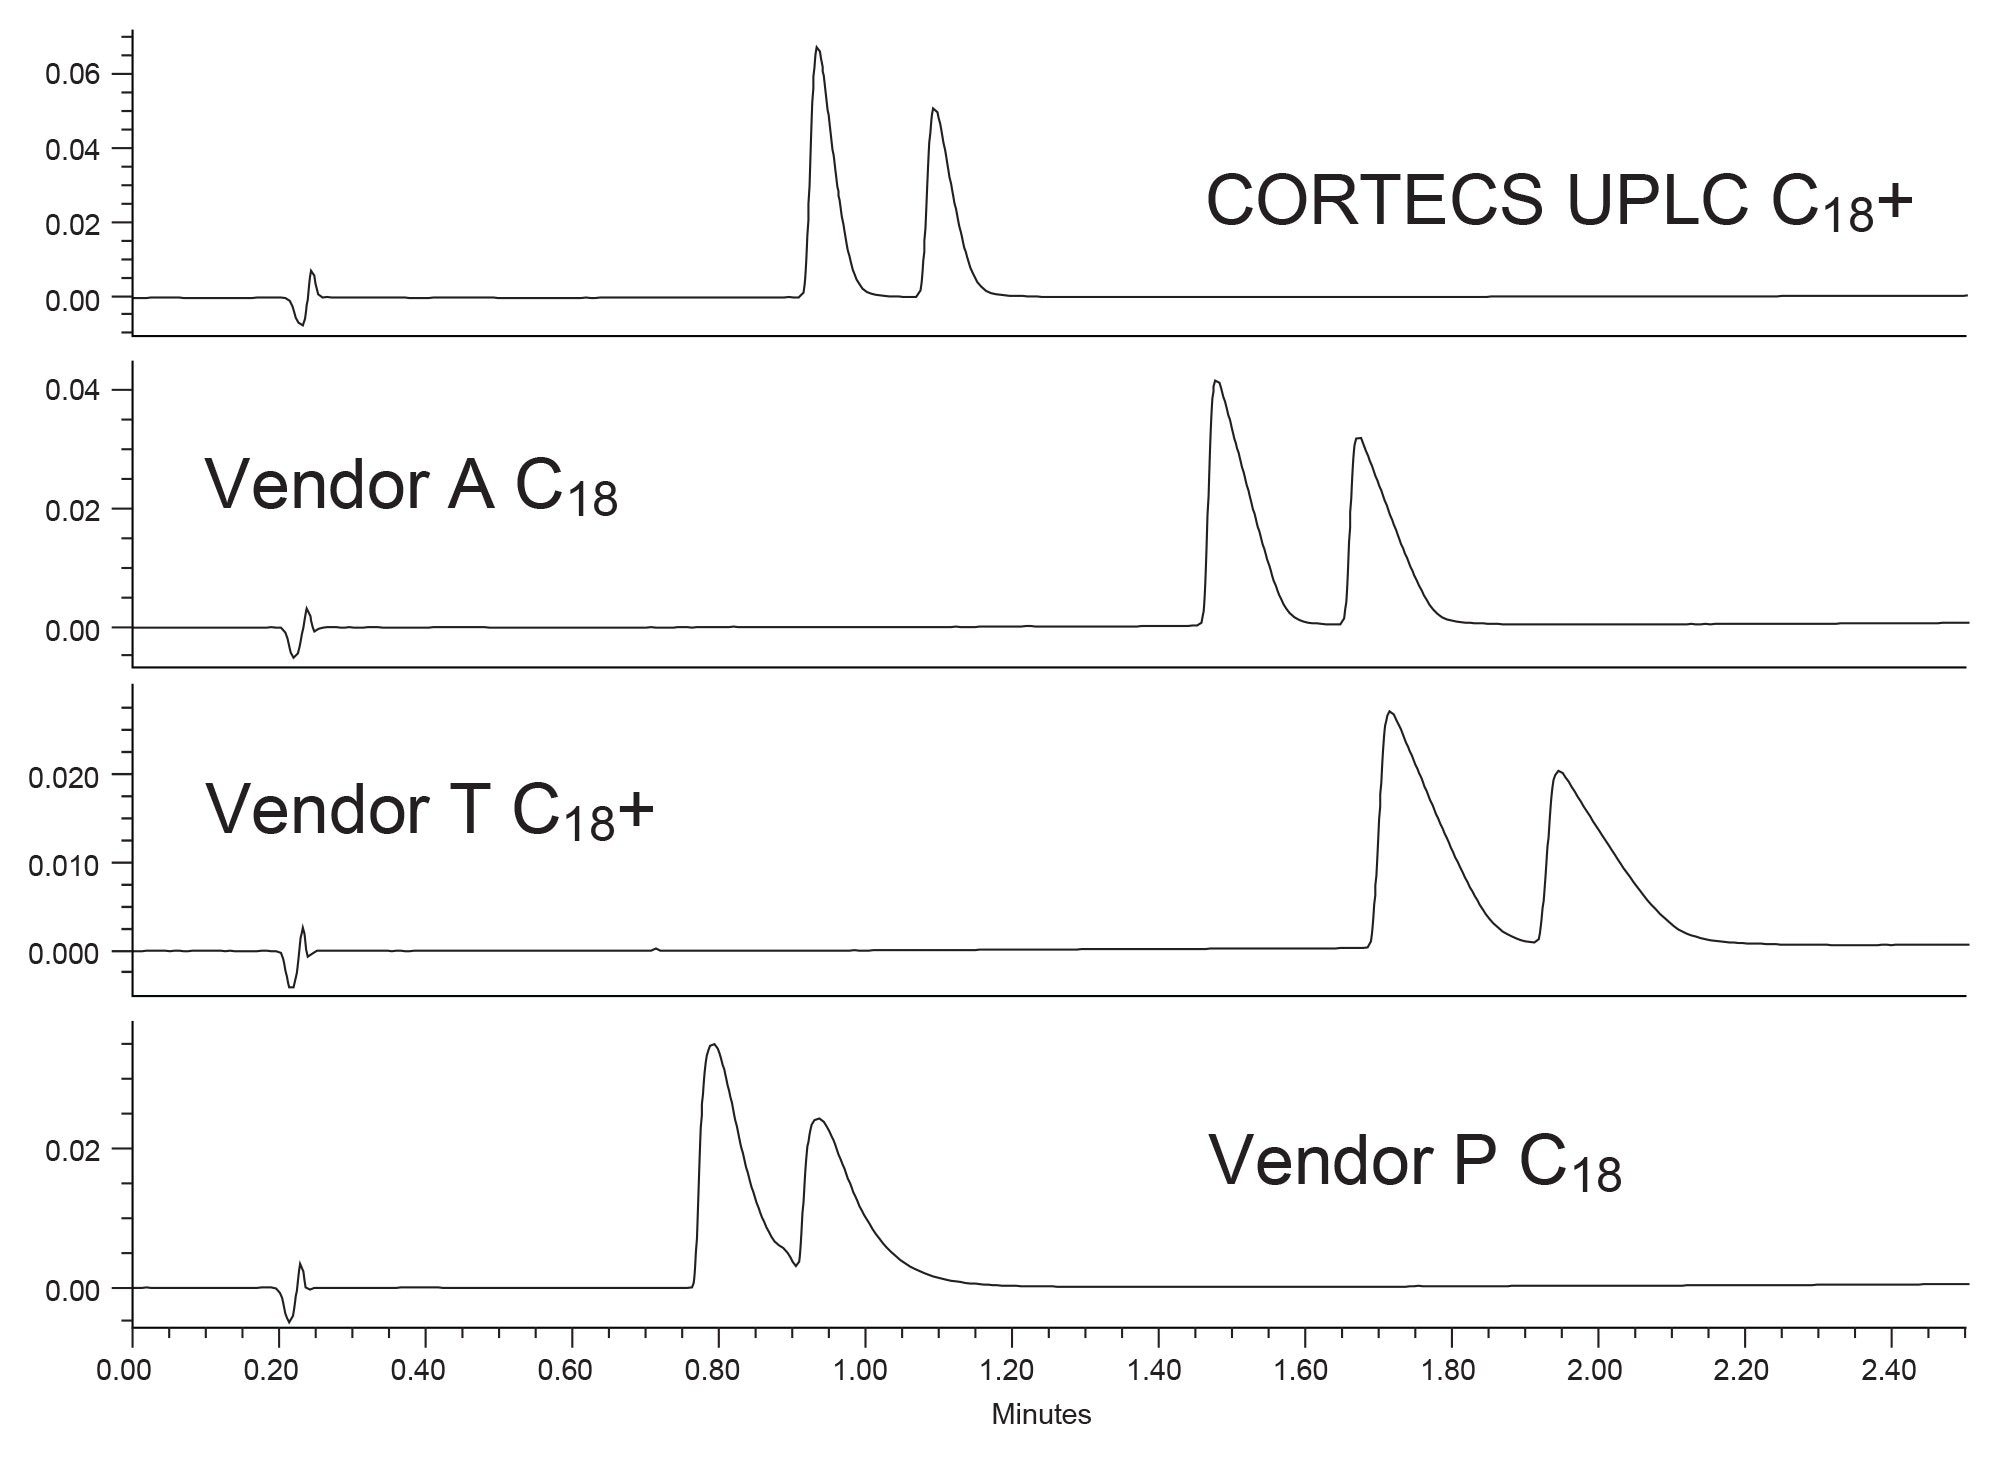
All the columns tested use non-porous silica “cores” as the basis for the stationary phase, with three of the four using silica fully porous outer layers. Only one column, from Vendor P uses a different outer layer material, in this case a hybrid material incorporating an inorganic-organic material. All four columns have bonded C18 ligands with pore sizes ranging between 80–120 Å. Vendor P did not list a pore size or surface area on their website. Prior to any application-based testing, a batch test was performed to compare the efficiency of the columns. To do this, a mixture of naphthalene, acenaphthene, and octanophenone was created. Batch test conditions were determined by examining the vendor batch tests outlined in the column QC documentation and finding a reasonable compromise across the tests. Figure 1 shows the chromatograms of the batch test results for the four columns tested.
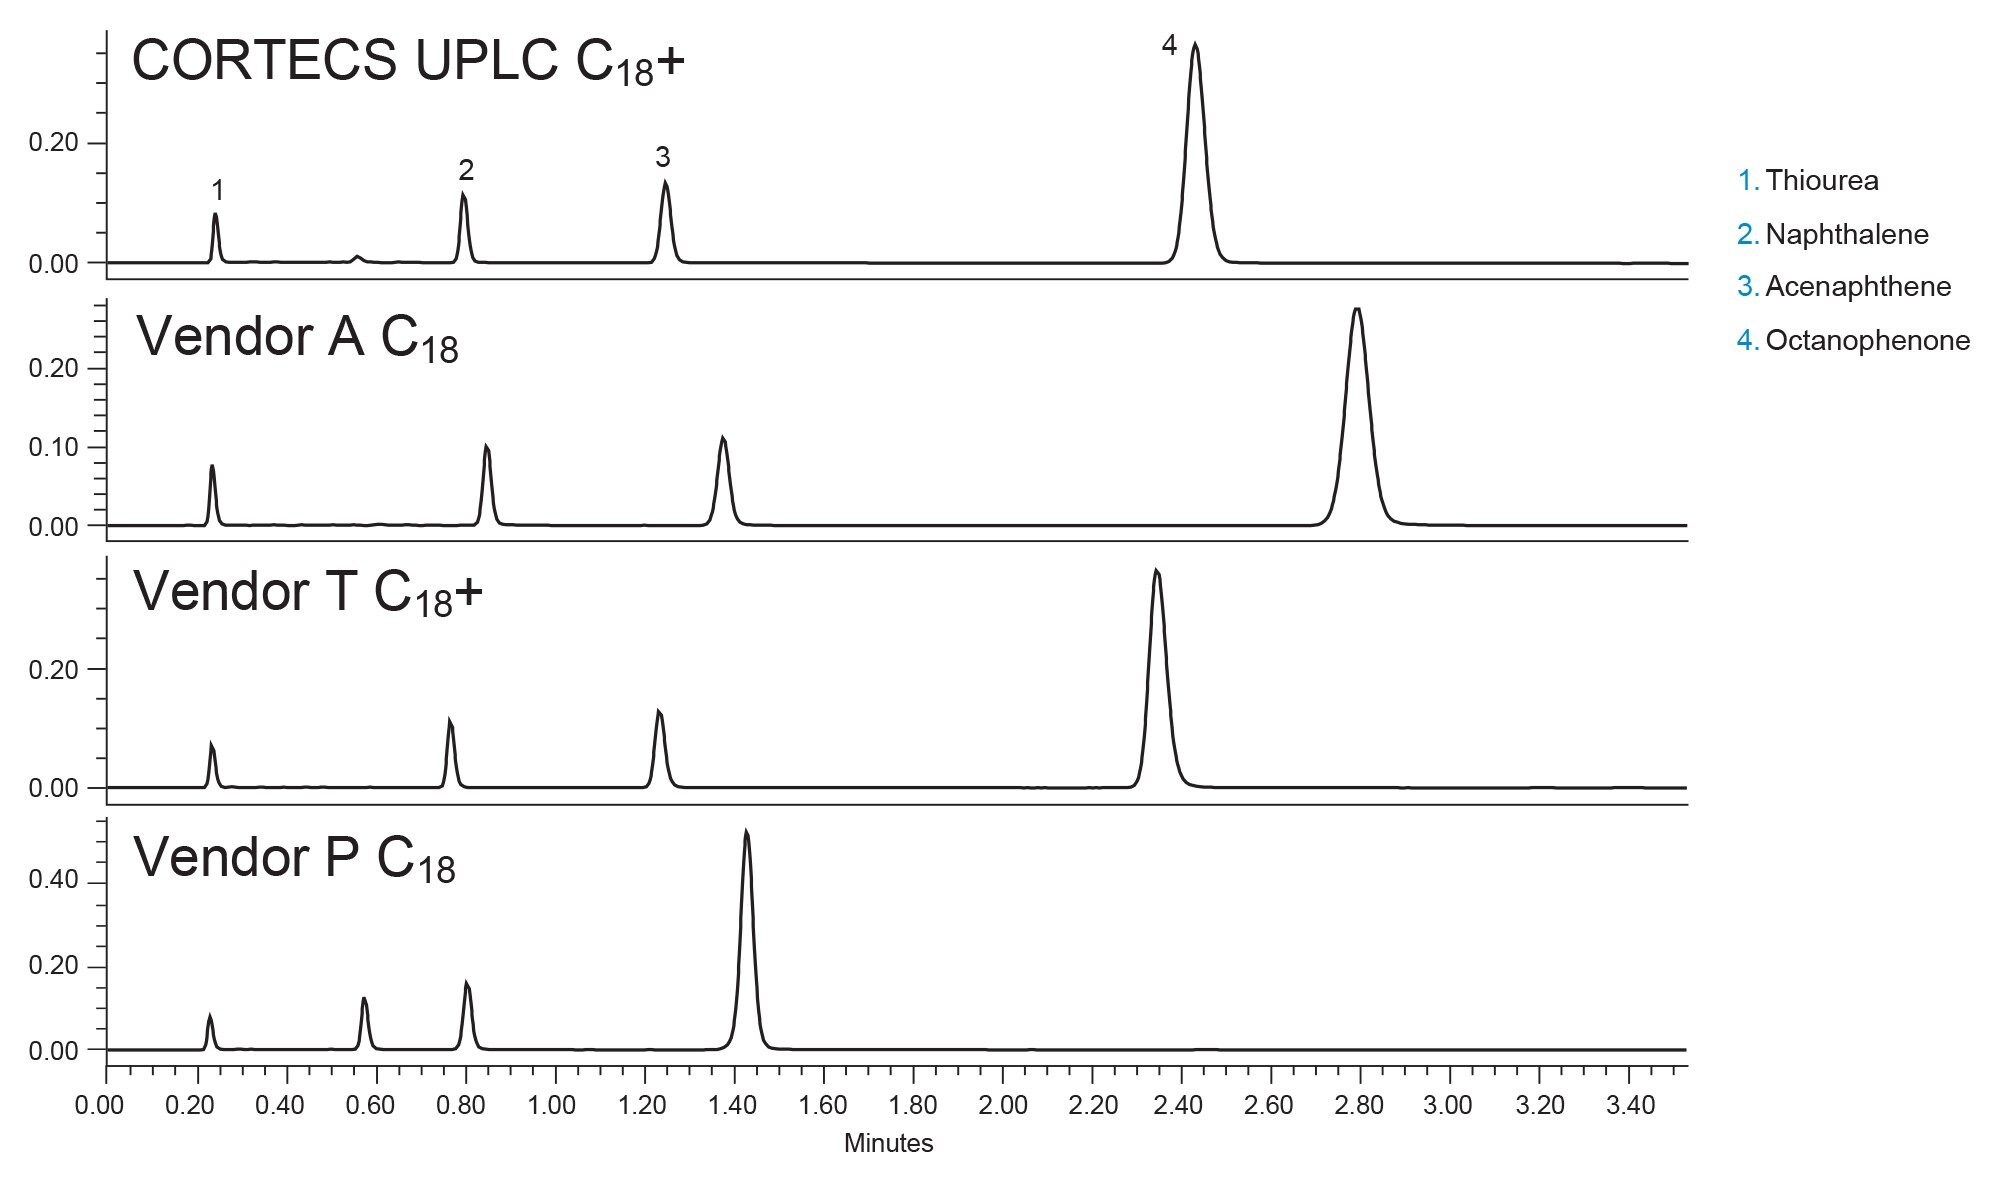
From first glance the columns seem to be comparable. Vendor P is less retentive than the other phases, possibly due to a difference in material used in the base particle, or from a difference in surface area. The other three phases however have similar retention with good separation of the probes and symmetrical peak shape. Table 2 shows the USP plate counts for acenaphthene and octanophenone on the four columns. System pressure is also shown.
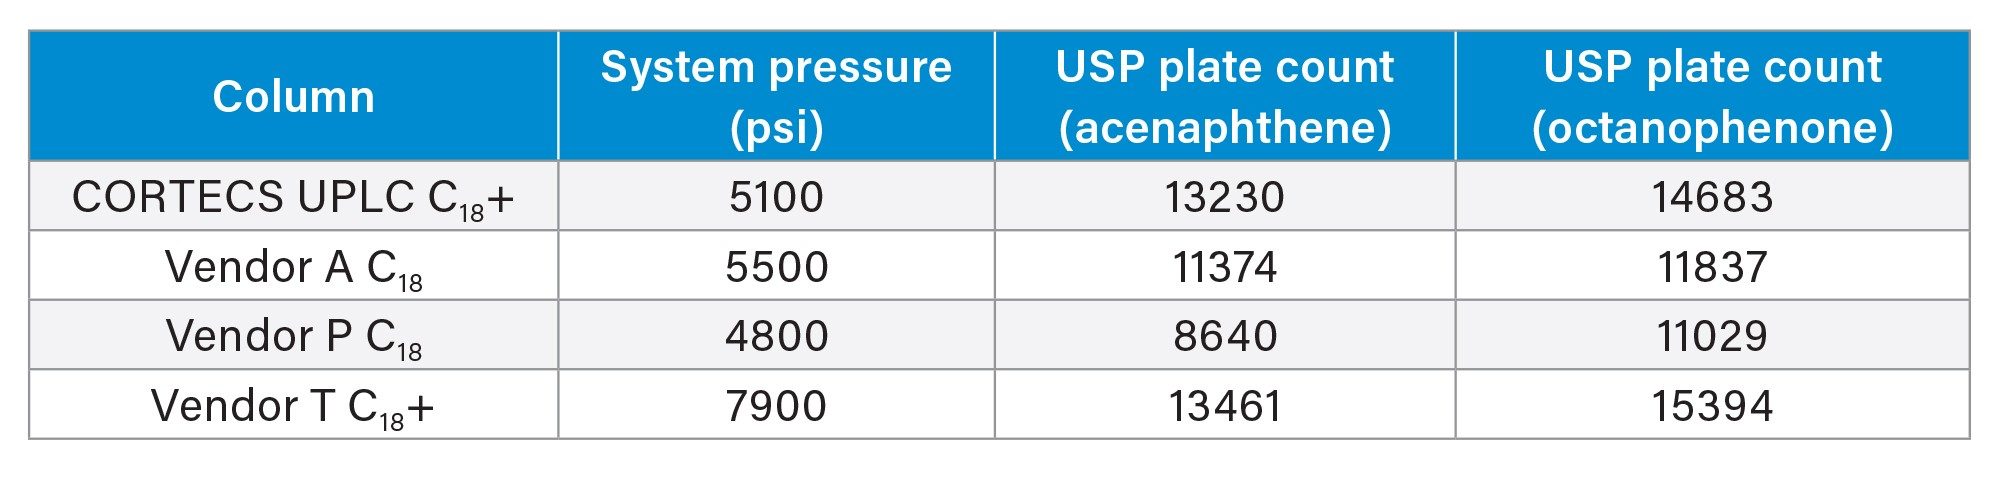
As expected, the column from Vendor T, which has a 1.5 µm particle size has considerably higher system pressure compared to the other columns. This would also explain why Vendor T has the highest efficiency values for octanophenone compared to the other tested columns even though CORTECS UPLC C18+ achieves a plate count within 5% at a lower back pressure. Acenaphthene USP Plate Counts are comparable for both the CORTECS C18+ and the Vendor T C18+ columns, with Vendor A being slightly less efficient and Vendor P being even lower in efficiency. From purely a batch test standpoint, the CORTECS UPLC C18+ and the Vendor T C18+ seem to be the best choices so far, with Vendor A being a close second followed by Vendor P.
While looking at a batch test is a good first step in choosing a column, actual performance for an assay may be different. Conditions for actual analyses are not optimized for things like plate count measurements but are optimized for a different purpose, such as achieving good peak shape or separating critical pairs. To examine the use of the columns in a more realistic example, sample mixtures of two basic analytes, imipramine, and amitriptyline, were created with varying concentrations of amitriptyline. These mixtures were then injected onto the four columns using formic acid, a low ionic strength mobile phase. For both the CORTECS UPLC C18+ and the Vendor T C18+ the stationary phases should produce reasonable peak shape for the analytes as both are designed to improve basic peak shape under these conditions. Figure 2 shows the chromatograms of three different mixtures injected on the four columns.
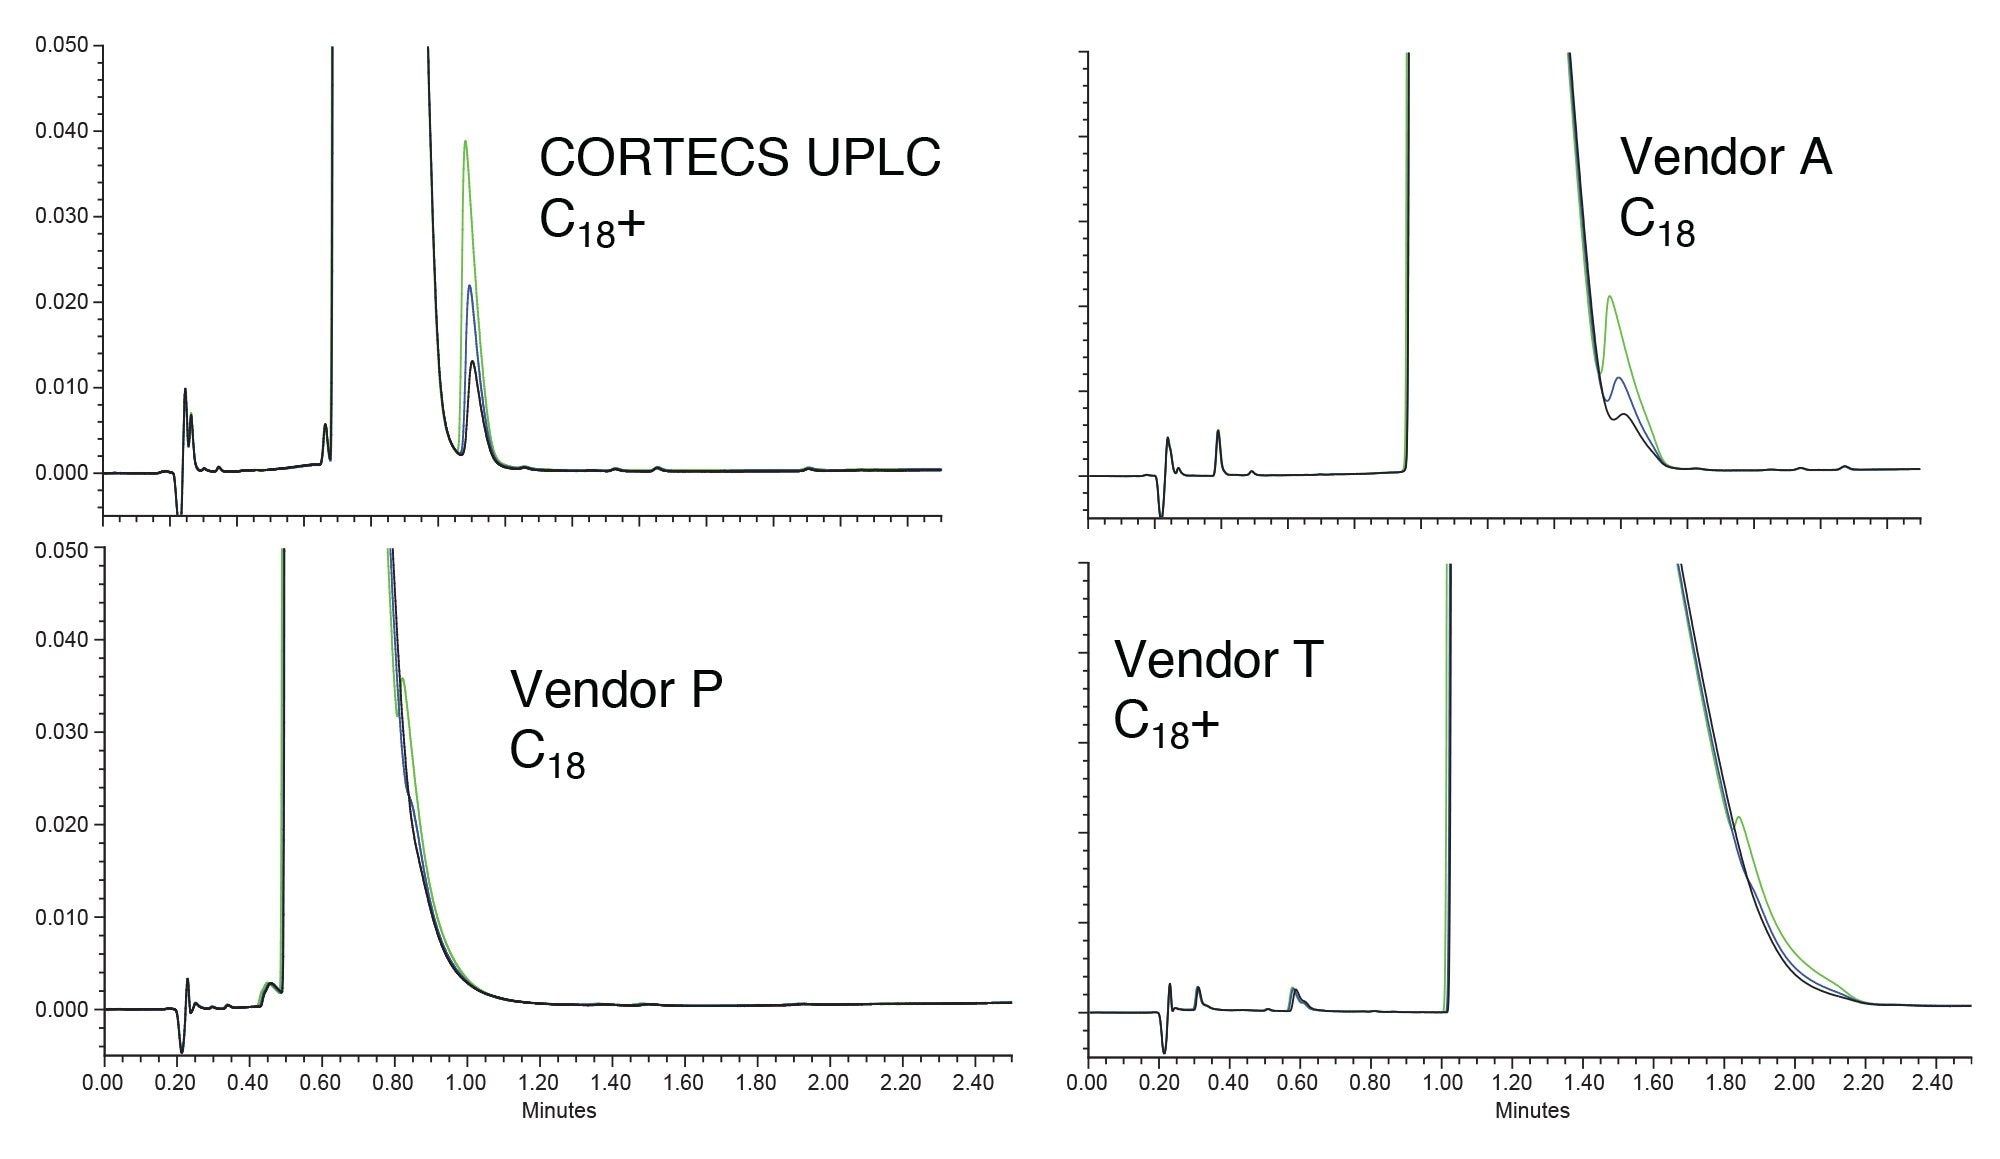
The amitriptyline peak, which should elute after the imipramine, is easily detectable on the CORTECS UPLC C18+ Column. While the imipramine peak may be very wide due to mass overload, the peak is sharper on the CORTECS UPLC C18+ compared to the other columns. The Vendor T C18+ column, which should have good peak shape for bases, shows a wider imipramine peak than the Vendor A column. Additionally, neither column can resolve the amitriptyline peak from the overloaded imipramine. Vendor P has the second narrowest peak for imipramine but is also unable to resolve the amitriptyline peak. For this example, the column with the best performance is clearly the CORTECS UPLC C18+ Column, followed by the Vendor A C18. To further examine peak shape for these compounds a mixture was created with 10 µg/mL of each analyte. Figure 3 shows the resulting chromatogram of that analysis.
Even at the lower concentration level for imipramine, the CORTECS UPLC C18+ has the best peak shape for these analytes. The other three columns show definite signs of overload as indicated by the shark-fin shaped peaks. Interestingly, the Vendor T C18+ column, which is supposedly designed to improve peak shape for bases, is the worst performing. Of the columns, only one was unable to fully resolve these two analytes at this concentration and that was the CORTECS UPLC C18+ Column.
Selecting a solid-core stationary phase is more complex than looking at efficiency measurements. Examining the column performance under assay conditions is critical especially since columns designed for the same purpose may perform differently. For the analysis of basic analytes at low pH using formic acid mobile phases, the CORTECS UPLC C18+ outperforms other solid-core phases including one specifically designed to improve basic analyte peak shape. Combining the performance for basic analytes with the high efficiency results obtained during batch testing, the CORTECS UPLC C18+ is a strong choice for any assay where solid-core columns are needed.
Conclusion
Column stationary phases vary in many ways. Even if similar materials are used, the process employed to create the phase can have a strong impact on the column’s performance. Manufacturing processes, along with column packing procedures vary from vendor to vendor meaning that two columns made by different vendors may have very different performance even if they are made in very similar ways and designed with the same attributes.
A comparison of four different solid-core C18 stationary phases was performed. First, a batch test was used to assess the column's retentivity and efficiency. During this test the Vendor T C18+ column had the highest USP Plate Counts for both acenaphthene and octanophenone with the CORTECS UPLC C18+ Column having only marginally lower values. The CORTECS UPLC C18+ Column was operating at about 2,000 psi lower system pressure than the Vendor T column as well. The next test used to compare the phases was a loading study using two basic analytes, amitriptyline, and imipramine. For this test, three different samples were made using varying concentrations of amitriptyline with a constant, albeit overloaded, concentration of imipramine. Of the columns tested, only the CORTECS UPLC C18+ Column was able to adequately detect the amitriptyline peak. The other three columns show heavy co-elution of the two peaks, with Vendor T and Vendor P columns showing total co-elution. Reducing the concentration of imipramine and re-testing showed that the CORTECS UPLC C18+ has the best peak shape for both analytes. The other columns tested showed wide peaks, and in the case of Vendor P’s columns co-elution between the two probes.
720008367, May 2024