• Applikationsbericht

Profiling and Quantification of Mono and Disaccharides and Selected Alditols in Juice, Beer, Wine, and Whiskey

Profiling and Quantification of Mono and Disaccharides and Selected Alditols in Juice, Beer, Wine, and Whiskey

  • Mark E. Benvenuti
  • Gareth E. Cleland
  • Jennifer A. Burgess
  • Waters Corporation

Abstract

The analysis of sugars and sugar alcohols remains a challenging application, owing to the lack of chromophores and the similarity between these molecules. Many of these sugar compounds are isomers of one another.

Due to its separation power, accuracy, and speed of analysis, HPLC has become the method of choice for the analysis of sugars. An alternative to Refractive Index (RI) and Evaporative Light Scattering (ELS) detection is the use of mass detection with electrospray ionization (ESI). Mass detection is complementary to traditional detectors used for LC. It offers the opportunity to decrease detection limits and also to obtain mass spectral information on the components in the sample. The combination of both chromatographic retention time and mass information results in increased selectivity for the analysis of sugars and sugar alcohols.

In this application note, we describe the application of the ACQUITY QDa Detector coupled to the ACQUITY Arc System for the profiling and quantification of sugars in juice, wine, beer, and whiskey samples.

Benefits

  • Detection of sugars at lower levels than with Refractive Index (RI) or Evaporative Light Scattering Detection (ELS).
  • Minimum sample preparation required and samples can be diluted to reduce matrix effects.
  • Chromatographic separation of the difficult isomer pairs sorbitol and mannitol.

Introduction

Sugars and sugar alcohols are classes of carbohydrates that are important in human nutrition and natural constituents of foods. With the increasing incidence of obesity and diabetes across the developed world, interest in monitoring sugar intake has vastly increased in recent years. Consequently, there are now requirements to provide accurate information on product labeling in order to comply with increasingly stringent regulatory demands. Profiling the sugar content of products is also a useful tool in assessing product authenticity and potential adulteration. 

The analysis of sugars and sugar alcohols remains a challenging application,  owing to the lack of chromophores and the similarity between these molecules. Many of these sugar compounds are isomers of one another, as can be seen in Figure 1, which illustrates the formulae and structures of the compounds analyzed in this study. Due to its separation power, accuracy, and speed of analysis, HPLC has become the method of choice for the analysis of sugars. An alternative to RI and ELS detection is the use of mass detection with electrospray ionization (ESI). Mass detection is complementary to traditional detectors used for LC.

Figure 1. Structures and formula for the sugar compounds analyzed.

Experimental

LC conditions

LC system:

ACQUITY Arc

Data system:

Empower 3

Runtime:

40.0 min

Column:

XBridge XP BEH Amide 2.5 µm, 3.0 x 150 mm

Column temp.:

85 °C

Mobile phase A:

90% acetonitrile: 5% IPA:5% water*

Mobile phase B:

80% acetonitrile: 20% water*

Flow rate:

0.8 mL/min

Injection volume:

1 µL

*Both containing 500 ppb guanidine hydrochloride and 0.05% diethylamine.

Gradient

Flow (min)

Rate (mL/min)

%A

%B

Initial

0.8

100.0

0.0

4.5

0.8

100.0

0.0

18.0

0.8

0.0

100.0

25.0

0.8

0.0

100.0

25.1

0.8

100.0

0.0

40.0

0.8

100.0

0.0

MS conditions

MS system:

ACQUITY QDa (Performance mode)

Ionization mode:

ESI-

Capillary voltage:

0.8 V

Cone voltage:

5.0 V

Probe temp.:

600 °C

Acquisition rate:

2 Hz

Full scan:

50 to 800 Hz

Curve fit:

Quadratic, 1/x weighting

Smoothing:

Mean filter, Level 7

Standard preparation

A 100 mg/L stock of the nine saccharides listed above was prepared in 1:1 acetonitrile-water. This stock was further diluted  to produce nine individual levels (1, 2, 4, 5, 10, 20, 40, 50, and 100 mg/L).

Sample preparation

All samples were purchased locally. The juice samples assessed included orange, apple, pineapple, pomegranate, and grape. The alcoholic beverages assessed included five beers, three lagers (one non-alcoholic), a lemon flavored beer, one hard cider, one sherry, one red wine, and four whiskeys. The beer samples were sonicated to remove carbonation. All of the samples were filtered through a 0.22 µm PVDF syringe filter and diluted in 1:1 acetonitrile-water. The dilution factors are listed in Table 1.

Table 1. Dilution factors for the “off-the-shelf” samples studied.
SIR channels:    
Analyte Formula SIR (m/z)([M+Cl]-
Arabinose C5H10O5 185
Fructose C6H12O6 215
Glucose C6H12O6 215
Inositol C6H12O6 215
Sorbitol C6H14O6 217
Mannitol C6H14O6 217
Sucrose C12H22O11 377
Maltose C12H22O11 377
Maltotriose C18H32O16 539


It offers the opportunity to decrease detection limits and also to obtain mass spectral information on the components in the sample. The combination of both chromatographic retention time and mass information results in increased selectivity for the analysis of sugars and sugar alcohols. Here we show the application of the Waters ACQUITY QDa Mass Detector coupled to the ACQUITY Arc System for the profiling and quantification of sugars in juice, wine, beer, and whiskey samples.

Results and Discussion

Figure 2 shows the ACQUITY Arc System with the ACQUITY QDa Mass Detector and a PDA Detector. The PDA is shown for reference but was not used in this application. Figure 3 shows the SIR chromatograms for a mixed standard at 100 mg/L for each of the analytes listed above. Excellent separation of all of the standards was achieved. Initially, using isocratic conditions the lower mass saccharides were separated, including the difficult pair sorbitol and mannitol. After 4.5 minutes a gradient was started which allowed timely separation of the larger molecular weight saccharides in the mix.

Figure 2. ACQUITY Arc System with the PDA and ACQUITY QDa detectors.
Figure 3. SIR chromatograms of the nine saccharide standards used in the study. The annnotated m/z represents the [M+Cl]- adducts.

The mass spectra extracted from the SIR of each standard is shown in Figure 4. The use of guanidine chloride in the mobile phase ensured that the compounds were driven to their chloride adduct ([M+Cl]- ion). The smaller 37Cl adduct response was also present. Figure 5 shows the calibrations curves for the compounds studied. An R2 value >0.995 was achieved for all of the analytes.

Figure 4. Mass spectral information extracted from SIRs of the nine saccharide standards. The annotated m/z represents the [ M+ Cl ]- adducts.
Figure 5. Calibration curves for the nine saccharide standards analyzed showing R2 values obtained for each analyte.

Figure 6 (A–E) shows the SIR profiles of a lager beer. In Figure 6A (m/z 185) arabinose is present. Other peaks are also apparent,  suggesting the presence of other pentose saccharides. In Figure 6B (m/z 215) traces of fructose and glucose can be seen. The enhanced sensitivity of the ACQUITY QDa allows improved detection of these compounds, as opposed to less sensitive methods such as Refractive Index.1 In Figure 6C (m/z 217) traces of sorbitol and mannitol are present. We also saw small peaks representing the extraction of the Cl37 adducts of fructose and glucose, which have the same molecular weight as sorbitol and mannitol. In  Figure 5D and 5E (m/z 377 and 539 respectively), we observed the DP2 and DP3 compounds maltose and maltotriose, along with isomers of the same mass, which would be expected for a beverage derived from grain. 

Figure 6. Annotated SIR profile of a lager beer annotated with saccharides found to be present.

A sherry wine profile is shown in Figure 7 (A–E). The main analytes found to be present in sherry are fructose and glucose (Figure 7B). A small amount of arabinose was present (Figure 7A), along with trace levels of sorbitol and mannitol (Figure 7C). Maltose was also apparent (Figure 7D). The DP3 compounds were absent (Figure 7E), as would be expected, since wine is  derived from grapes rather than from grains.

Figure 7. SIR profile of a sherry wine annotated with saccharides found to be present.

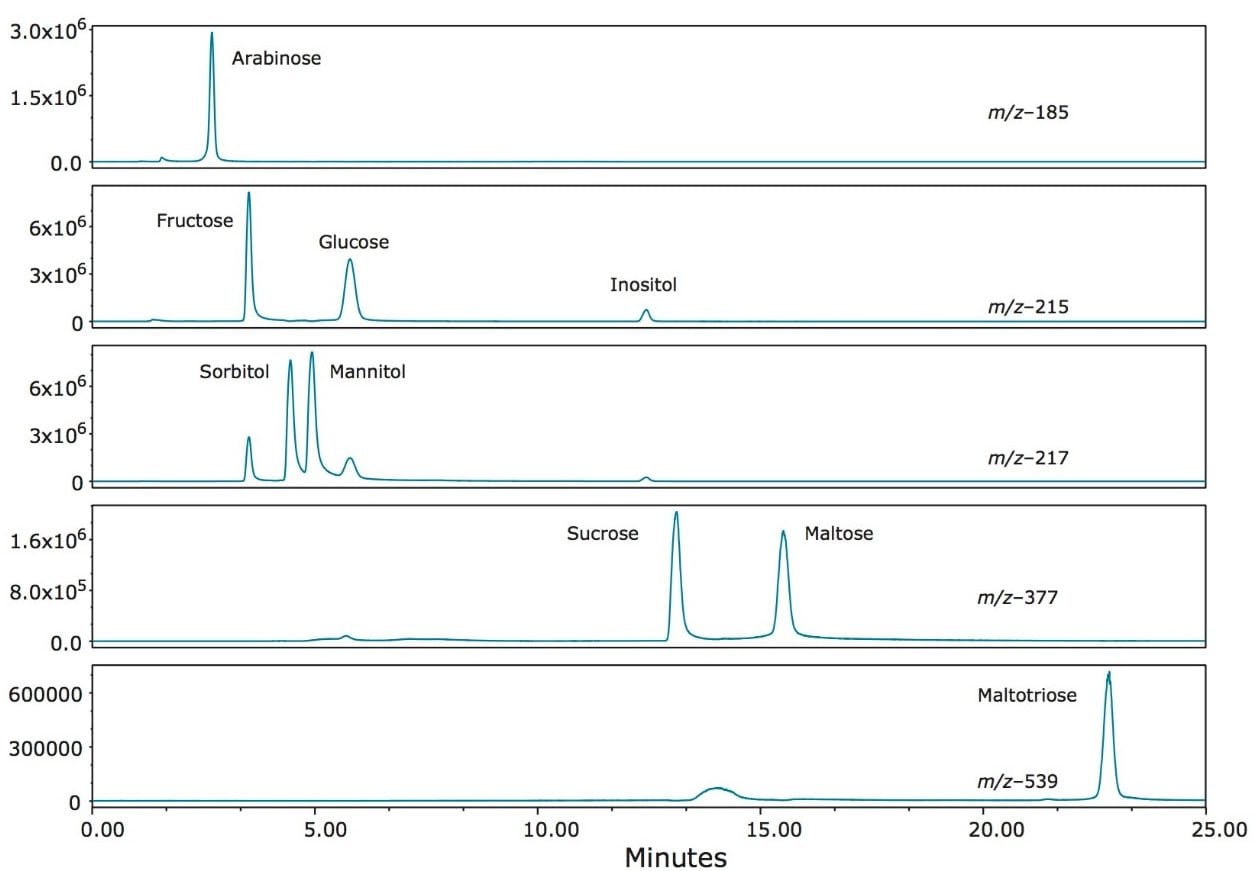
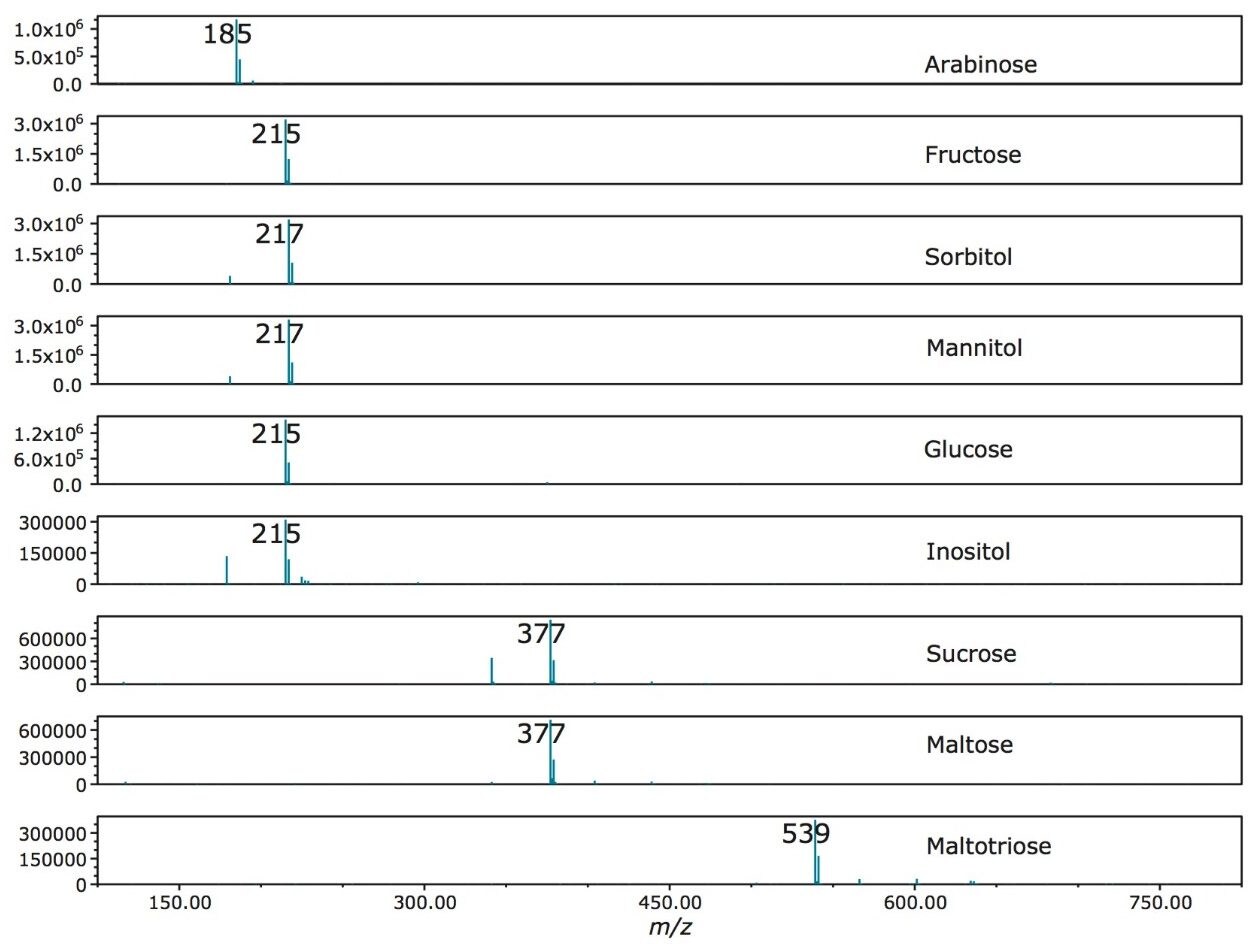
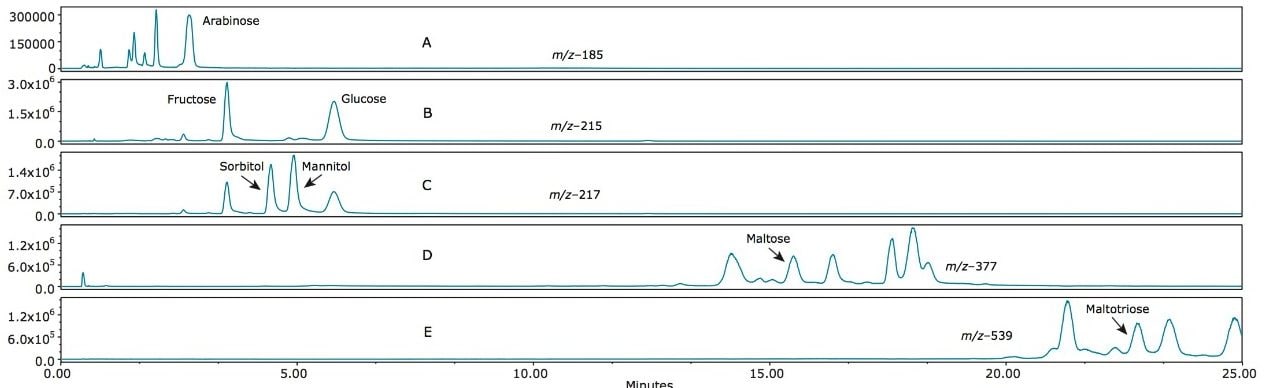
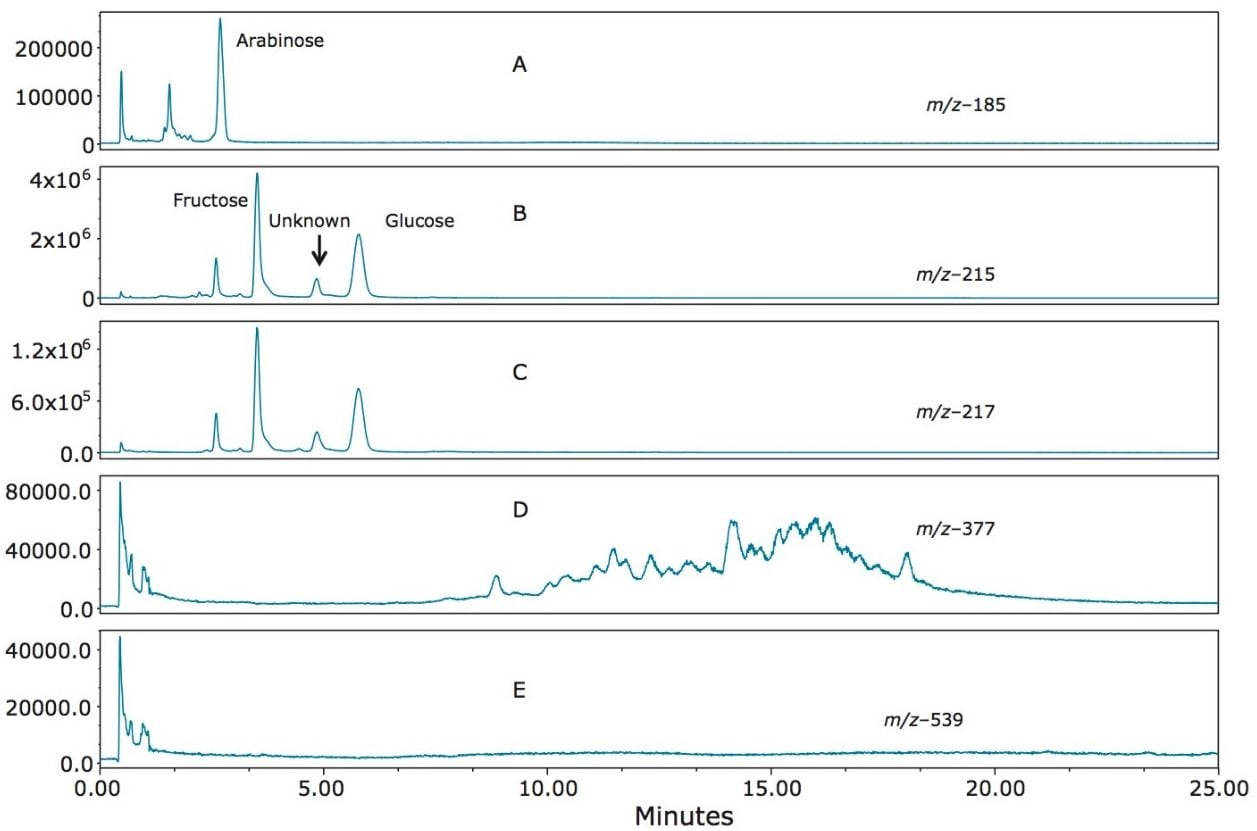
Figure 8 (A–E) shows the SIR profile of a whiskey sample. The presence of arabinose (Figure 8A), fructose and glucose (Figure 8B) was evident. Of particular interest was an unknown saccharide apparent in Figures 8B (m/z 215) and 8C (m/z 217) at retention time 4.85 minutes. Using retention time alone with an RI or ELS detector, this peak would most likely have been misidentified as mannitol. The presence of this peak at both m/z 215 and m/z 217 indicated that this component has the same  mass as a monosaccharide, rather than an alditol. Mannitol does not have an ion at m/z 215, as can be seen in Figures 2 and 3.

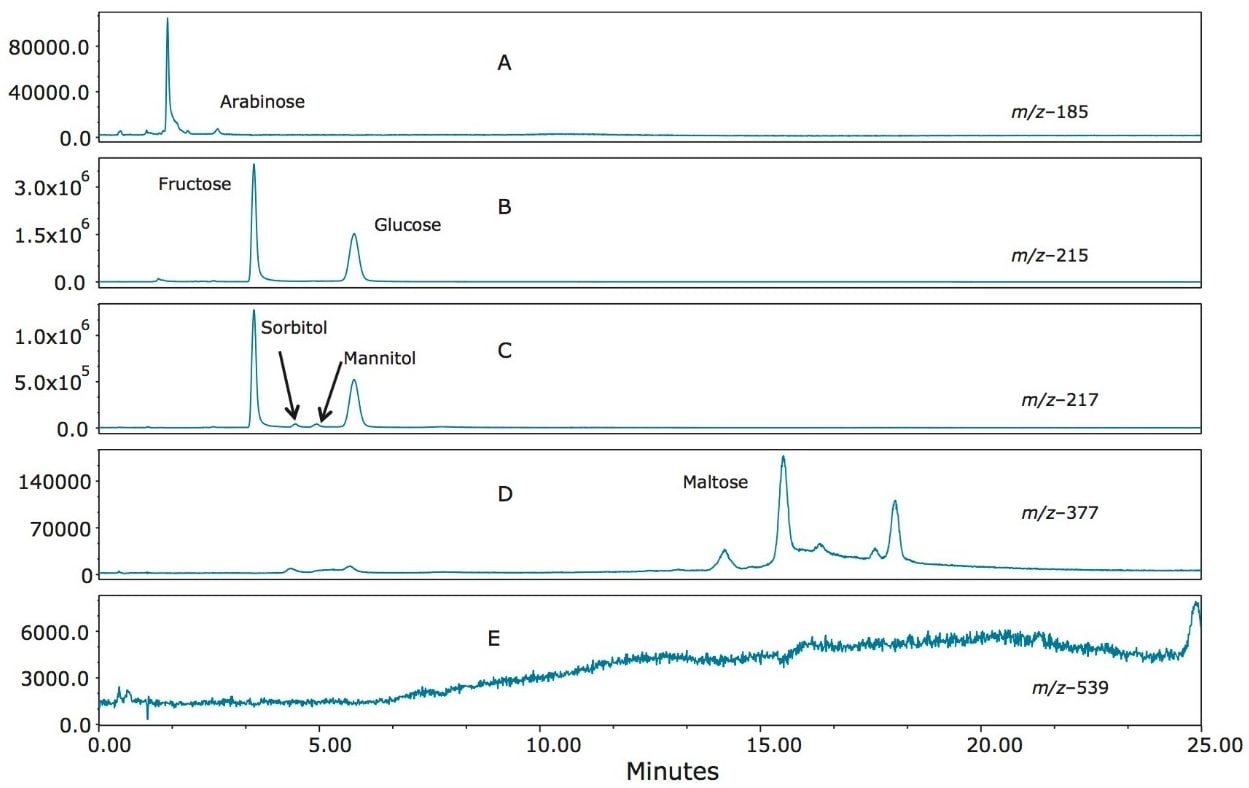
Finally, the SIR chromatograms from an apple juice sample are shown in Figure 9 (A–E). The presence of arabinose, fructose, glucose, sorbitol, and sucrose are highlighted.

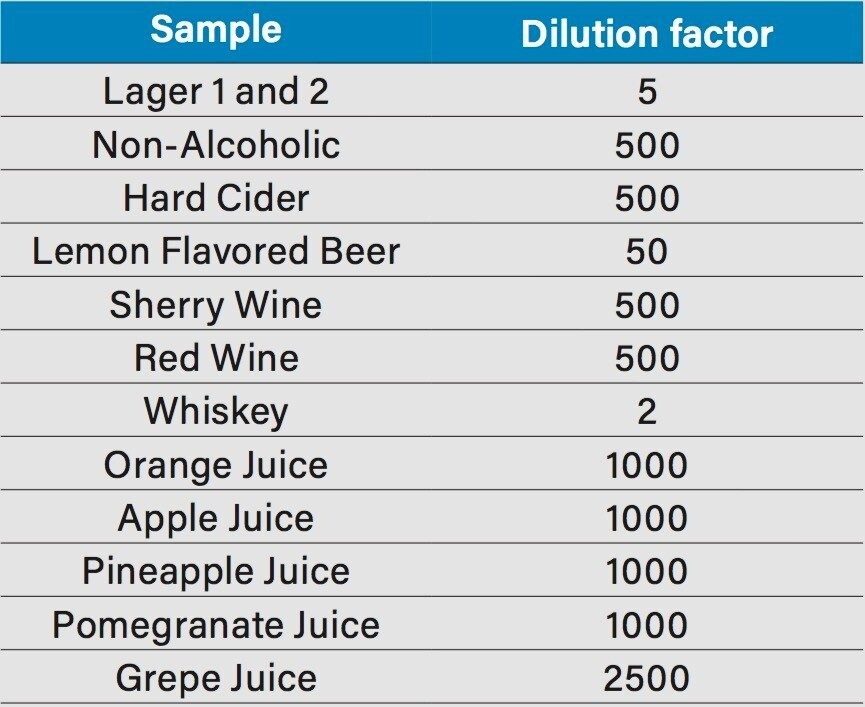
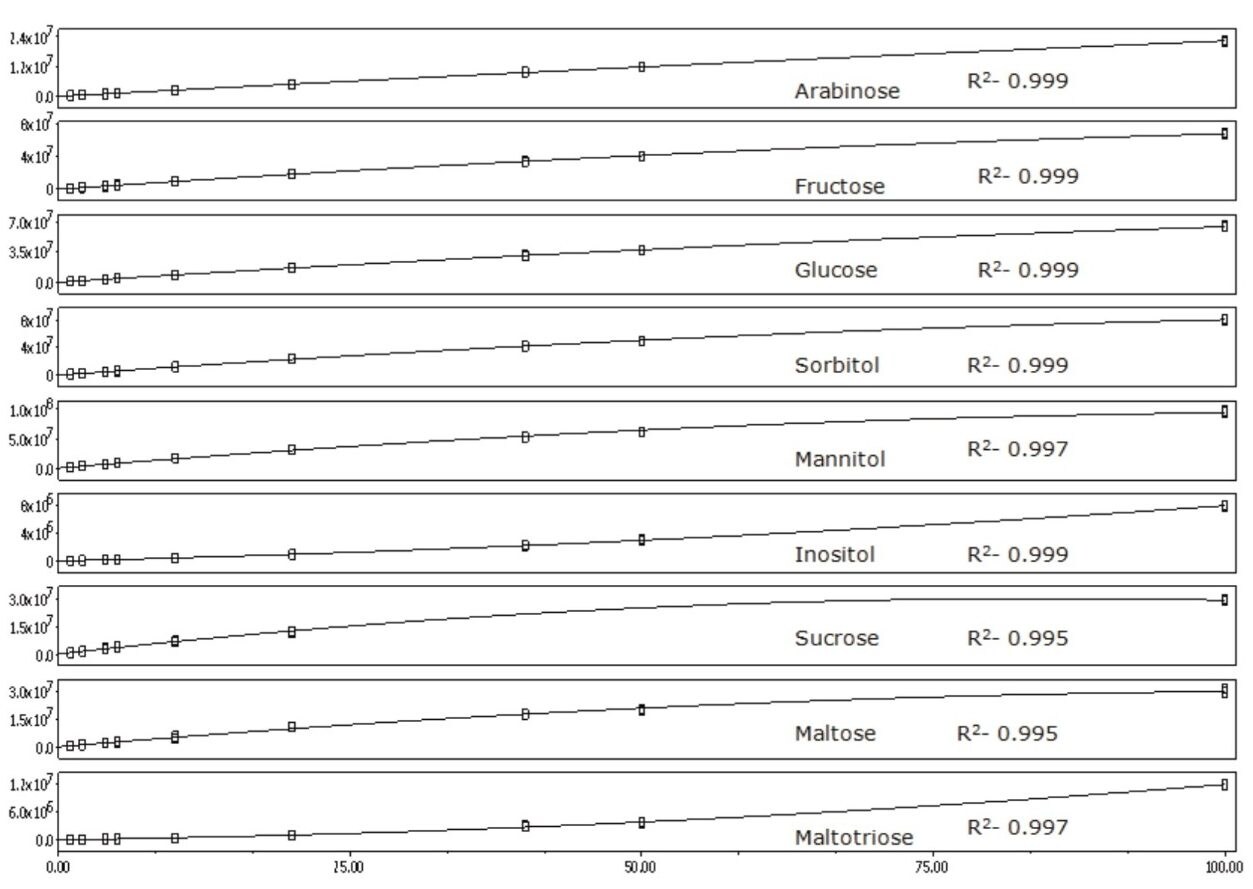
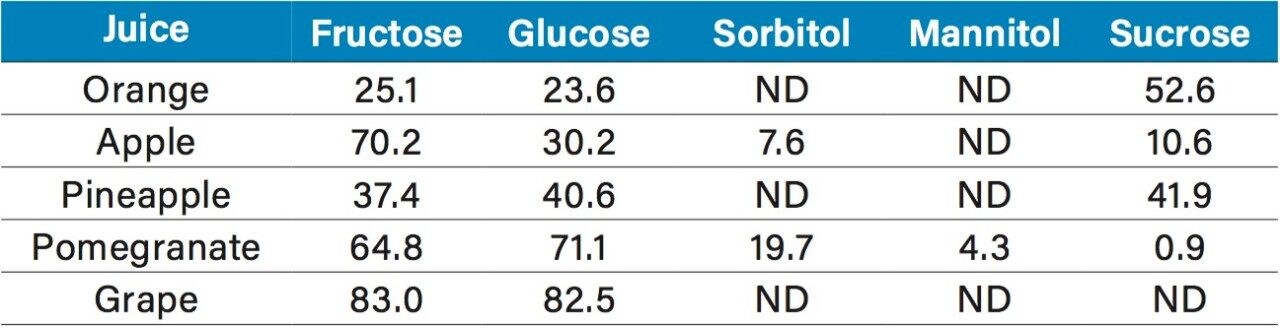
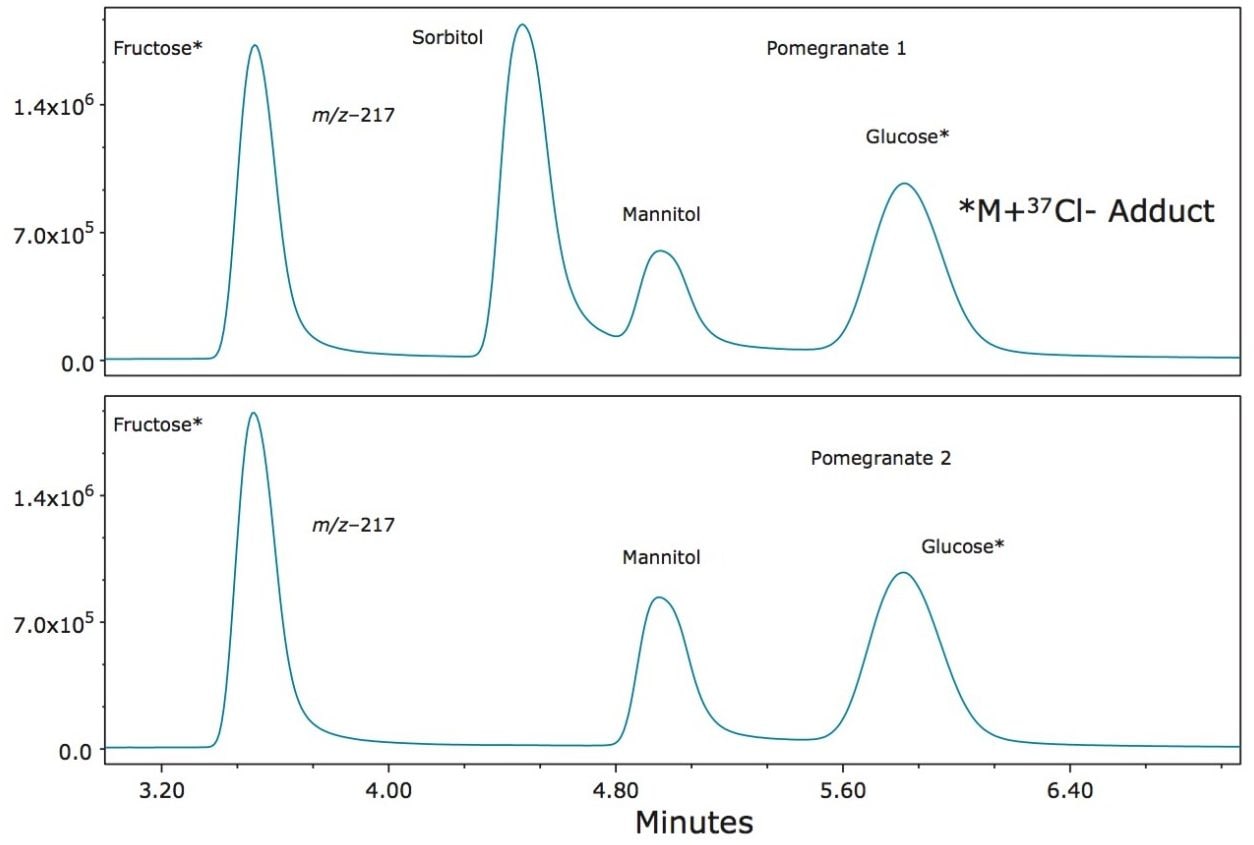
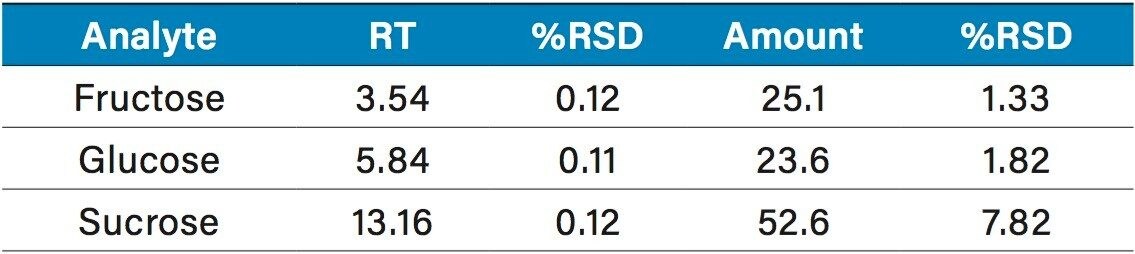
The quantification of various fruit juices is shown in Table 2. Fructose, glucose, and sucrose were present in the orange, apple,  and pineapple juices. The amounts and ratios of sugars in these juices are similar to those reported elsewhere.2,3 Of particular interest was the detection of sorbitol in pomegranate juice. Sorbitol is not usually present in pomegranate juice4 and its detection could be evidence of adulteration. A second sample tested showed no sorbitol (Figure 10). The grape juice sample showed  fructose, glucose, but no sucrose as expected.2,3

Figure 8. SIR profile of a whiskey annotated with saccharides found, and an unknown saccharide found to be present at m/z 215.
Figure 9. SIR profile of an apple juice sample annotated with saccharides found to be present.
Table 2. Calculated concentrations from the quantification studies of the various fruit juices profiled in this study (g/L).
Figure 10. Zoomed-in SIR chromatograms annotated with saccharides found to be present in two pomegranate juice samples. One sample showed the presence of sorbitol, indicating a potential adulteration.
Table 3. Reproducibility data for retention time (min) and amount (g/L) based on seven injections of orange juice.

Conclusion

  • The ACQUITY QDa Mass Detector coupled to the ACQUITY Arc System provides improved sensitivity and selectivity to analyze and quantify mono and disaccharide samples in a single injection.
  • Mass detection is a viable alternative to Refractive Index (RI) or Evaporative Light Scattering (ELS) methods.
  • This enhanced sensitivity allows the analysis of samples at higher dilution levels, which minimizes matrix effects.
  • The combination of mass detection and chromatographic separation provides increased selectivity in identifying analytes of interest, while reducing false positives.

References

  1. M Castellari et al. Determination of Carboxylic Acids, Carbohydrates, Glycerol, Ethanol, and 5- HMF in Beer by High-Performance Liquid Chromatography and UV–Refractive Index Double Detection. Journal of Chromatographic Science. 39: 236–238, January 2001. 
  2. M L Sanz et al. Inositols and carbohydrates in different fresh fruit juices. Food Chemistry. 87: 325–328, 2004.
  3. M Benvenuti. Analysis of Food Sugars in Various Matrices. Waters application note no. 720004677EN, May, 2013.
  4. R Jahromi. 6.21 Reference Guide for Pomegranate. Revision June 2012.

720005609, March 2017

Zurück zum Seitenanfang Zurück zum Seitenanfang