• Applikationsbericht

Advantages of Oasis PRiME HLB for the LC-MS/MS Analysis of Vitamin D Metabolites in Serum for Clinical Research

Advantages of Oasis PRiME HLB for the LC-MS/MS Analysis of Vitamin D Metabolites in Serum for Clinical Research

  • Robert Wardle
  • Lisa J. Calton
  • Waters Corporation
Sun

For research use only. Not for use in diagnostic procedures.

This is an Application Brief and does not contain a detailed Experimental section.

Abstract

A clinical research method has successfully been developed for the LC-MS/MS analysis of 25OHD3, 25OHD2, C3-epi-25OHD3 and 24,25(OH)2D3 in serum. The advantages of the phospholipid removal properties of Oasis PRiME HLB have been demonstrated for the analysis of these vitamin D metabolites and include the following benefits:

  • Removal of phospholipids from serum samples using a simplified extraction workflow
  • Excellent precision performance for all analytes at all concentration levels tested (≤8.2% CV)
  • Good agreement was observed to the DEQAS NIST assigned values for 25OHD3
  • Increased analytically sensitivity for 25OHD3, 25OHD2, C3-epi-25OHD3, and 24,25(OH)2D3 negating the need for derivatization.

Benefits

  • For LC-MS/MS vitamin D metabolite analysis, Oasis PRiME HLB minimizes phospholipid interferences and improves analytical sensitivity, without the need for lengthy derivitization.

Introduction

Goal

To successfully develop an LC-MS/MS method for the analysis of 25-hydroxyvitamin D3 (25OHD3), 25-hydroxyvitamin D2 (25OHD2), 24,25-dihydroxyvitamin D3 (24,25(OH)2D3), and C3-epi-25-hydroxyvitamin D3 (C3-epi-25OHD3), using the Xevo TQ-S micro Mass Spectrometer and utilizing Waters Oasis PRiME HLB to minimize phospholipid interferences and improve analytical sensitivity.

Background

Matrix interferences can be challenging when measuring serum levels of vitamin D metabolites by LC-MS/MS. In particular, lysophosphatidylcholines (LysoPCs 16:0, 18:1, and 18:0) – which have similar hydrophobicity to 25-hydroxyvitamin D (25OHD)–have been shown to cause ion suppression in mass spectrometric methods. Despite being structurally very different, LysoPCs have proved challenging to remove during sample preparation and are difficult to separate chromatographically from vitamin D metabolites.

Figure 1. Oasis PRiME HLB µElution solid phase extraction (SPE) Plate.

Experimental

The Solution

Here we describe an approach for method optimization using Oasis PRiME HLB µElution solid phase extraction (SPE) Plates (Figure 1) that assesses the reduction of LysoPCs compared to Oasis HLB SPE and protein precipitation. Using a Waters ACQUITY UPLC HSS PFP Column, chromatographic separation of 25OHD2, 25OHD3, 24,25(OH)2D3, and C3-epi-25OHD3 was achieved and peak area profiles were compared with targeted LysoPCs (16:0, 18:1, and 18:0, having precursor ions of m/z 496, m/z 522, and m/z 524 and product ions of m/z 184) for the three sample extraction methods. Performance of the optimized extraction method was assessed using a Waters ACQUITY UPLC I-Class (FTN)/ Xevo TQ-S micro System.

Sample Preparation and Analysis

Stable labeled internal standards were added to 100 µL of calibrator, QC, or sample and protein precipitation performed using a methanol/zinc sulfate(aq) solution. 

Following centrifugation, the supernatant was transferred to an Oasis PRiME HLB µElution Plate. An elution profile was generated by analyzing the eluate from varying concentrations (0–100%) of acetonitrile(aq), with triplicate preparations for each level passed through the SPE sorbent. 

An ACQUITY UPLC I-Class System was used to separate diluted eluate using a 2.1 x 100 mm ACQUITY UPLC HSS PFP Column with a water, methanol, ammonium acetate, and formic acid gradient and analyzed on a Xevo TQD using the MRM transitions and precursor scan parameters listed in Table 1.

Table 1. MRM transitions and precursor scan parameters.

Results and Discussion

Mean peak areas from the triplicate preparations for each vitamin D metabolite and LysoPCs tested were plotted on scatter charts to view  their elution profiles (Figure 2).

The elution profile demonstrates that LysoPCs begin to elute from the Oasis PRiME HLB sorbent at a similar organic concentration to the vitamin D metabolites, as they have very similar hydrophobic properties. However, at concentrations >90% acetonitrile(aq) almost all LysoPCs are retained on the Oasis PRiME HLB SPE sorbent, while the vitamin D metabolites are released. Therefore, 25% acetonitrile(aq) wash and 100% acetonitrile elution conditions were selected for the optimized method.

LysoPCs and vitamin D metabolites mean peak areas obtained from the optimized Oasis PRiME HLB protocol were compared to a simple protein precipitation extraction  using methanol/zinc sulfate(aq) and an optimized Oasis PRiME HLB protocol, which used methanol as the elution solvent. The results  are summarized in Figure 3.

Using Oasis PRiME HLB with acetonitrile, >99% of all targeted LysoPCs were removed when compared to Oasis HLB with methanol and protein precipitation. This resulted in an increase of 5x in vitamin D metabolites peak areas when compared to Oasis HLB and an increase of 10x when compared to protein precipitation.

Figure 2. Elution profile plots for vitamin D metabolites and LysoPCs with different concentrations (0–100%) of acetonitrile being passed through the Oasis PRiME HLB SPE Plate.
Figure 3. Comparison of vitamin D metabolites and LysoPC peak areas from samples prepared by protein precipitation (PPT), Oasis HLB (HLB MeOH), and Oasis PRiME HLB (PRiME MeCN).

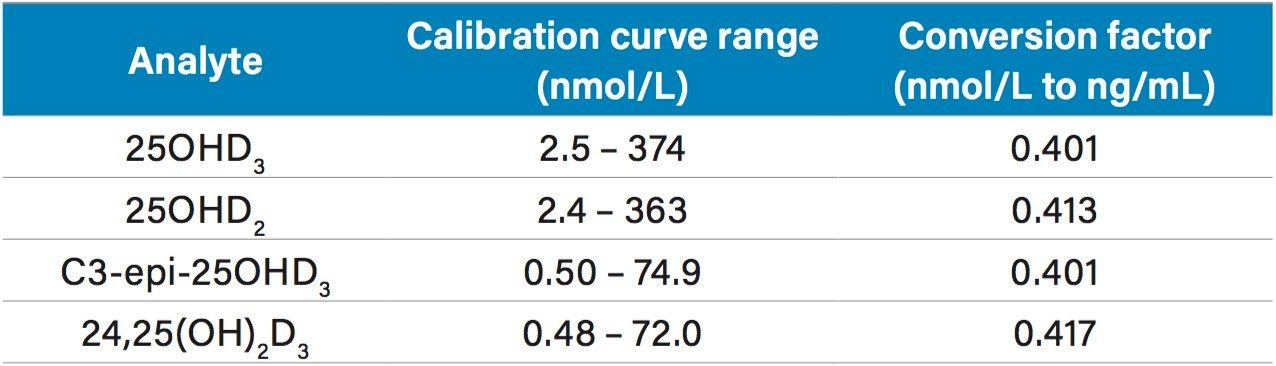
Performance of the optimized extraction method was assessed using an ACQUITY UPLC I-Class/Xevo TQ-S micro System. Over five days, all calibration curve correlation coefficients (r²)  were >0.99 across the following concentration ranges (Table 2) for 25OHD3, 25OHD2, C3-epi-25OHD3 and 24,25(OH)2D3, with conversion factors from nmol/L to ng/mL being shown.

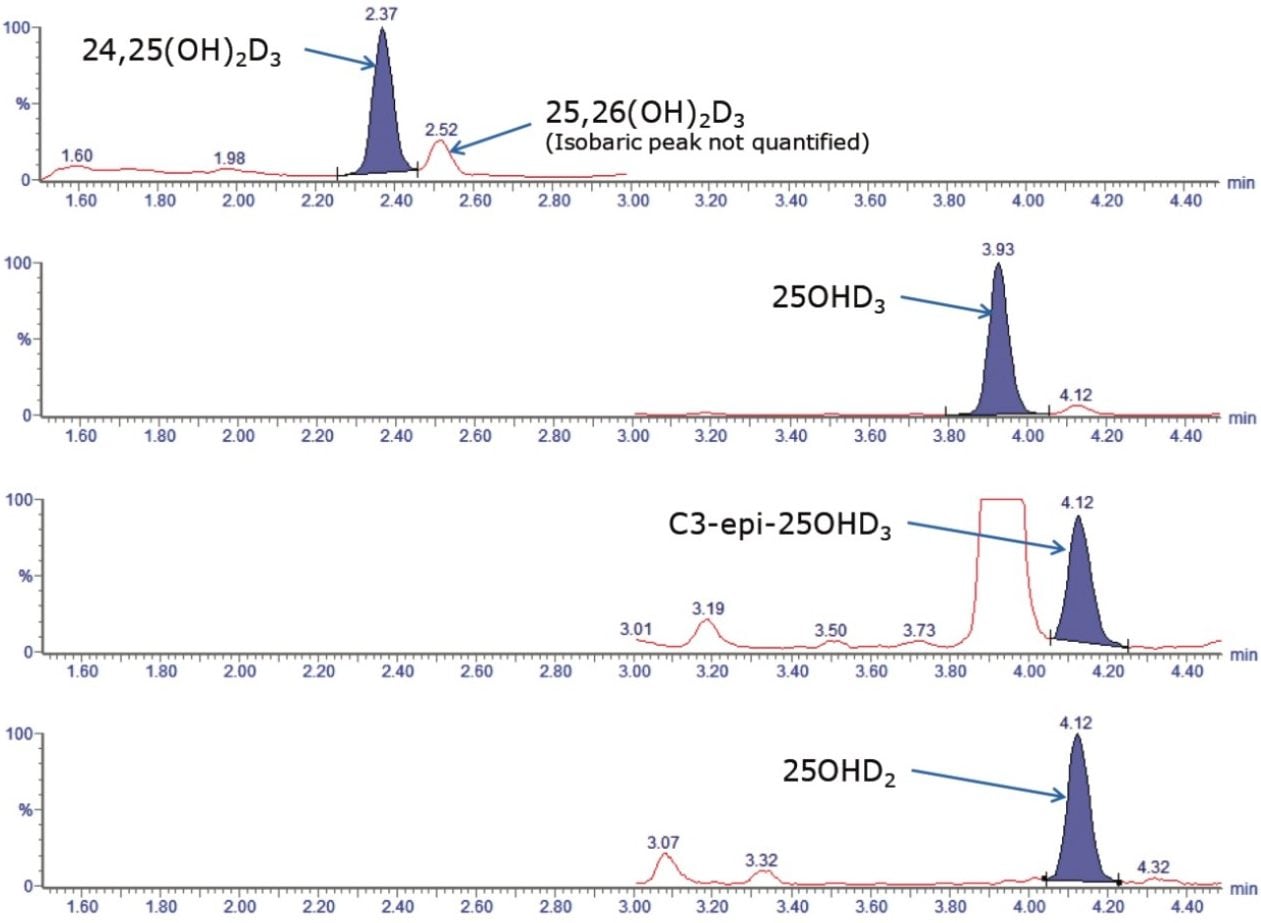
Separation of the C3-epi-25OHD from 25OHD was achieved for both 25OHD2 and 25OHD3 using the ACQUITY UPLC HSS PFP Column. An additional isobaric peak present in both the quantifier and qualifier transitions for 24,25(OH)2D3 was also separated and confirmed to be 25,26(OH)2D3. An example chromatogram  is shown in Figure 4, demonstrating a runtime of <8 minutes injection-to-injection.

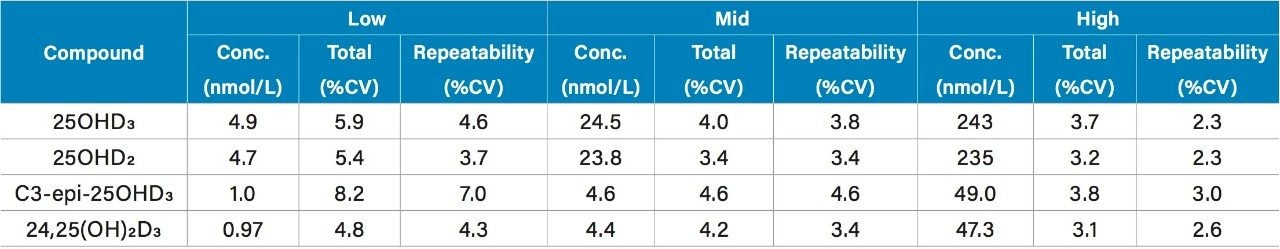
Total precision and repeatability of the method was assessed by extracting and quantifying serum samples using five replicates at low, mid and high concentrations across five days (n=25). All results were ≤8.2%CV as shown in Table 3.

Accuracy was assessed by analyzing DEQAS (Vitamin D External Quality Assessment Scheme) and NIST SRM972a (National Institute of Standards and Technologies Standard Reference Materials 972a) samples and calculated concentrations were compared to the NIST assigned values. For 25OHD3, a Deming regression equation of y=1.02x-1.09  and Altman Bland analysis demonstrated good agreement with minimal bias (-0.1%). Only seven data points were available for 25OHD2, with an overall mean percentage difference of -0.9% (range -9.7%–10.0%) obtained when compared to the  NIST assigned values. A large scatter was observed for C3-epi-25OHD3 DEQAS samples, but there was good agreement  when compared to NIST SRM972a material, having a bias of within ±6.7% for all samples tested (triplicate preparations  of three samples containing C3-epi-25OHD3). A large scatter was also observed in 15 samples assessed for 24,25(OH)2D3,  when compared to LC-MS/MS ALTM values of a DEQAS pilot study (NIST assigned values are not available). The LC-MS/MS ALTM was derived from only six laboratories, with returned results indicating a large standard deviation between the participating laboratories.

Table 2. Calibration curve ranges for each vitamin D metabolite.
Figure 4. Chromatogram of an extracted serum sample containing endogenous 25OHD2, 25OHD3 , 24,25(OH)2D3 , C3-epi-25OHD3 and 25,26(OH)2D3 .
Table 3. Total precision and repeatability assessment for the analysis of vitamin D metabolites in serum.

Analytical sensitivity was assessed by extracting ten replicates of stripped serum samples spiked at low to high concentrations  over three days (n=30). A precision of <20%CV and S:N (ptp) of >10:1 were obtained at 1 nmol/L for 25OHD3, 25OHD2 and 0.5 nmol/L for 24,25(OH)2D3 and C3-epi-25OHD3.

Conclusion

A clinical research method has successfully been developed for the LC-MS/MS analysis of 25OHD3, 25OHD2, C3-epi-25OHD3 and 24,25(OH)2D3 in serum. The advantages of the phospholipid removal properties of Oasis PRiME HLB have been demonstrated for the analysis of these vitamin D metabolites and include the following benefits:

  • Removal of phospholipids from serum samples using a simplified extraction workflow
  • Excellent precision performance for all analytes at all concentration levels tested (≤8.2% CV)
  • Good agreement was observed to the DEQAS NIST assigned values for 25OHD3
  • Increased analytically sensitivity for 25OHD3, 25OHD2, C3-epi-25OHD3, and 24,25(OH)2D3 negating the need for derivatization

References

720005965, May 2017

Zurück zum Seitenanfang Zurück zum Seitenanfang