• Applikationsbericht

Application of Desorption Electrospray Ionization (DESI) for Breast Tissue Imaging in Clinical Research

Application of Desorption Electrospray Ionization (DESI) for Breast Tissue Imaging in Clinical Research

  • Dipa Gurung
  • Zoltan Takats
  • Emmanuelle Claude
  • Waters Corporation
  • Imperial College

For research use only. Not for use in diagnostic procedures.

This is an Application Brief and does not contain a detailed Experimental section.

Abstract

Introduction of the desorption electrospray ionization (DESI) technique coupled to mass spectrometry imaging (MSI) using a Xevo G2-XS Quadrupole Time-of-flight (QTof) Mass Spectrometer for distinguishing tissue types in breast samples for clinical research.

Benefits

  • DESI imaging provides effective spatial localization of biomolecules within breast tissue sections with minimal sample preparation.

Introduction

Over the past decade, mass spectrometry imaging has been used increasingly by researchers to investigate the distribution of metabolites, drugs, peptides, and proteins at tissue surfaces. The potential for the application of MSI to unambiguously map hundreds of biomolecules in a single analysis has led to this approach being used in research studies of cancer. Recently, there has been a significant increase in the application of desorption electrospray ionization (DESI) because this soft ionization technique can be performed under ambient environmental conditions. Furthermore, it requires little to no sample preparation and is minimally invasive, making it suitable for direct tissue analysis. DESI-MSI has potential to provide non-subjective information about biochemical distribution of molecules after just one measurement. Therefore, this technique enables robust tissue recognition and identification of tissue-specific lipid ion patterns, which could, in the future, be useful in cancer diagnosis and prognosis at a histology-level. DESI-MSI is compatible with both the Waters SYNAPT G2-Si and Xevo G2-XS Mass Spectrometers.

Figure 1. Workflow of a DESI-MSI experiment of breast tissue samples. 

Results and Discussion

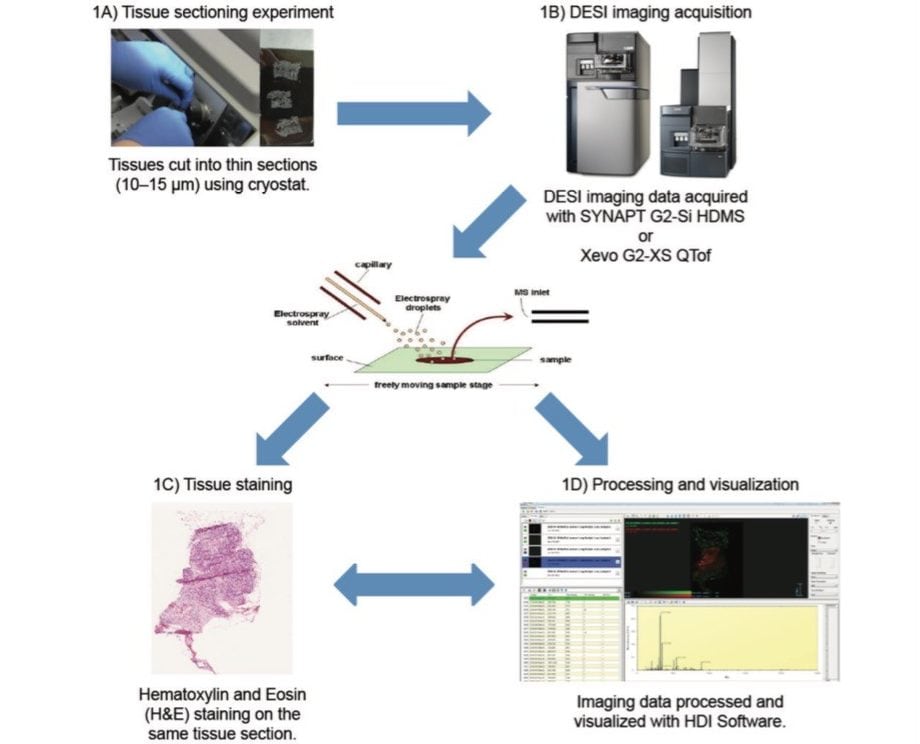
In order to perform a DESI-MSI experiment on breast tissue, a fresh frozen  10 µm tissue section was mounted onto a glass slide (Figure 1A). The slide was placed directly onto the linear moving stage of the Prosolia 2D DESI source without any other pre-treatment. An optical image was recorded and co-registered within the High Definition Imaging (HDI) Software, version 1.4 (Figure 1D). This optical image was then used to define the area to be imaged. A typical DESI-MSI experiment involves rastering the tissue sections with an ionization beam, line by line, to acquire mass spectra at defined x and y coordinates. Each sampling location corresponds to a unique mass spectrum. For DESI-MSI of the breast samples, pixel size in the x-direction is defined at 100 µm and the acquisition rate was set to five scans per second using the solvent mixture of 95:5 methanol:water.

Following DESI-MSI analysis, the tissue sections were Hematoxylin- and Eosin- (H&E) stained (Figure 1C) made possible because DESI is a non-destructive technique. Overlaying the H&E-stained optical image with the DESI-MS ion images provides a topographical comparison of the biochemical features of the same section.

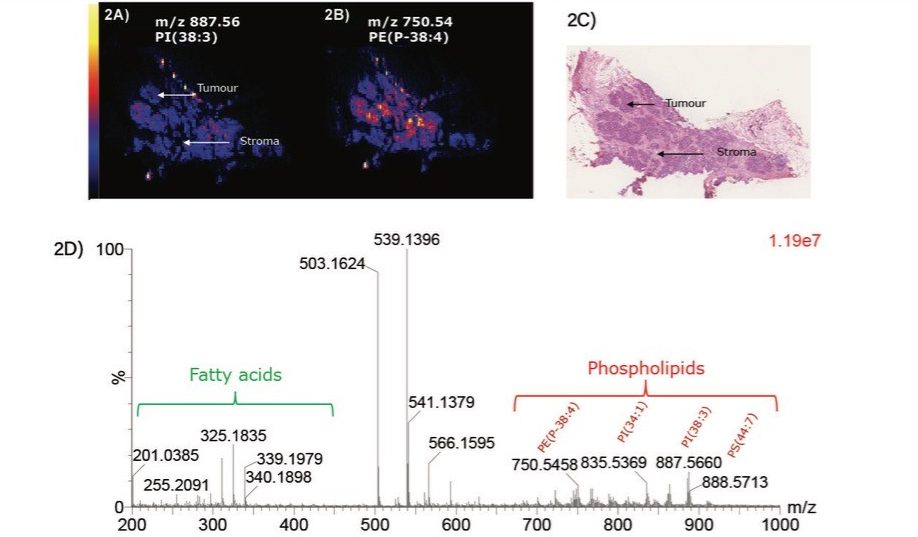
In terms of breast tissue analysis, DESI has shown a very good separation of the malignant component from the rest of the tissue section as shown in Figure 2 where PI (38:3) corresponding to m/z 887.56 is characteristic of the malignant part of the tissue. DESI generates intense fatty acid and phospholipid signals in negative ionization mode as shown in Figure 2.

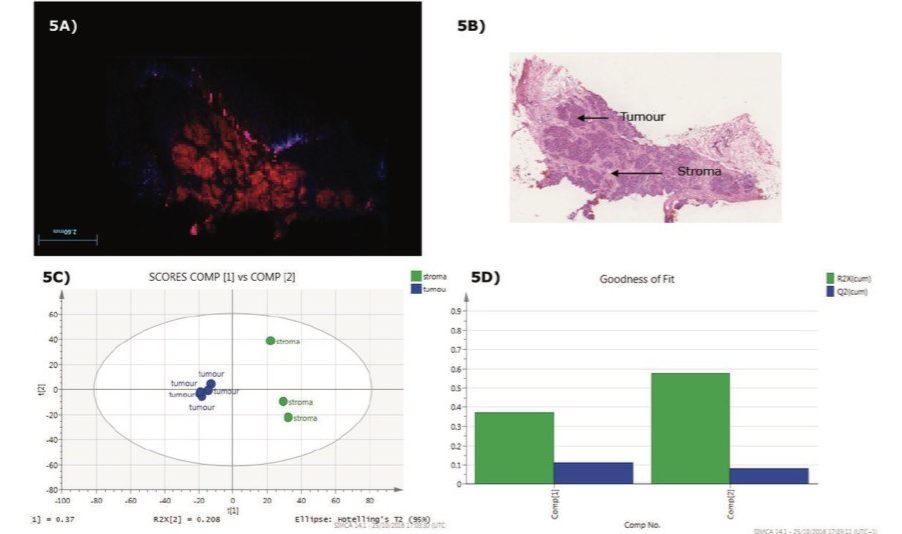
Statistical analysis was performed from HDI processed DESI-MSI data by first defining the Regions of Interest (ROIs) on the MSI ion images based on histopathological annotations. Differences between the two tissue types found (stroma and tumor) were evaluated. Figure 3 shows  principal component analysis (PCA) using SIMCA software (Umetrics), which demonstrates a  good fit for the model generated with a high R2 (Regression fitness) and Q2 (Predictive fitness). Using the SIMCA informatics workflow, it is possible to link the ion images of the dataset  with the loading plot in HDI. 

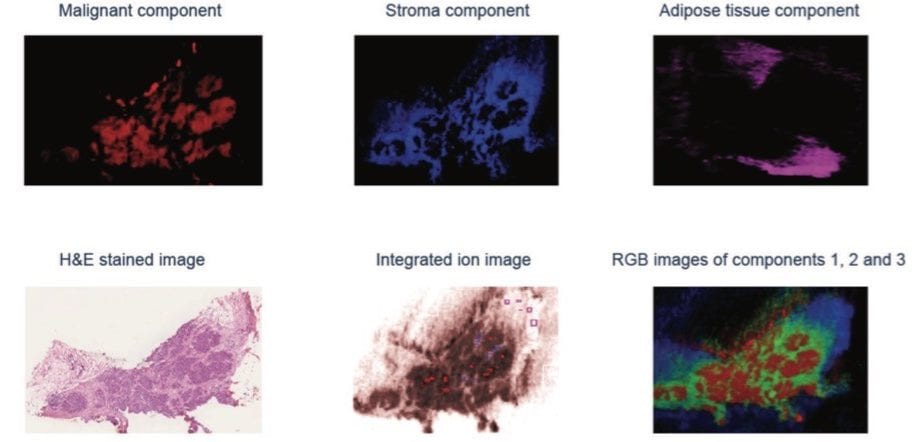
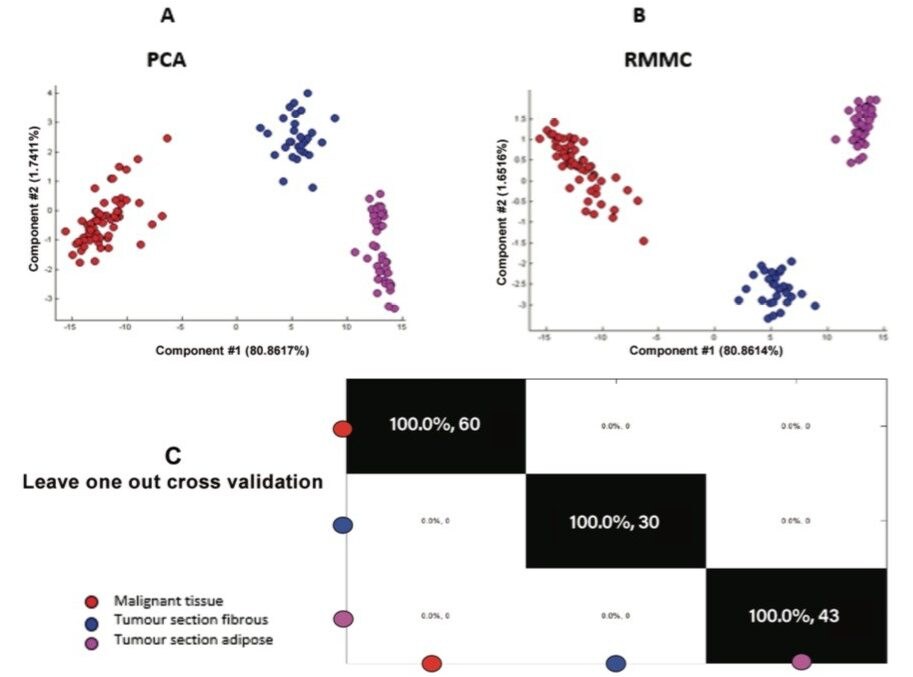
A range of other in-house or commercial statistical software packages are available. Another alternative investigated was to import raw imaging data into a MATLAB environment for further analysis. The individual grade 2 invasive ductal carcinoma (IDC) sample was subjected to unsupervised PCA to visualize differences between different regions within the section. Recursive maximum margin criterion (RMMC) analysis was used for supervised classification. Tissue types in each sample and their spatial distribution were determined by an independent histopathologist based on the H&E stained optical image (Figure 4). Based on this information, a small number of representative mass spectra per tissue  were selected from the MS ion image to build a sample-specific RMMC model which was used to classify all pixels in the different tissue types. This data was submitted to cross validation, which achieved 100% accuracy in negative ion mode (Figure 5).

Figure 2. Ion images for grade 2 IDC breast sample analyzed by DESI-MSI in negative ion mode a) m.z.887.56 , b) m/z 750.54. c) shows corresponding H&E section of breast tissue,  and d) shows combined spectra in negative ion mode, highlighting m/z values for fatty acids and phospholipids.
Figure 3. Tissue type differentiations using SIMCA statistical software tool where the ROIs on the stroma and tumor are separated by principal component analysis (PCA). The goodness of fit plots indicated a good regression and predictive model.

Conclusion

Desorption electrospray ionization mass spectrometry imaging can be effectively  employed for spatial localization and distribution of molecules within breast tissue samples under ambient conditions for clinical research.

The advantages of DESI-MSI for the analysis of breast tissue samples include:

  • Minimal sample preparation required prior to imaging acquisition
  • Minimal destruction of the sample, allowing subsequent analyses on the same tissue section (such as H&E staining)
  • Ability to distinguish between major breast tissue types with high accuracy, using different statistical tools, like HDI/Umetrics or in-house MATLAB software packages.
Figure 4. The three main MMC components corresponding to the three main tissue types (malignant, adipose and stroma) found within the sample for the Grade 2 IDC breast sample along with the H&E stained image, the MS ion image and RGB images of the three components in negative ion mode.
Figure 5. a) PCA (Principal component analysis)  b) RMMC (Recursive maximum margin criteria) supervised analysis  and c) leave-one-out cross validation accuracy of different tissue types within a single breast section for the negative ion mode data.

720005805, February 2017

Zurück zum Seitenanfang Zurück zum Seitenanfang