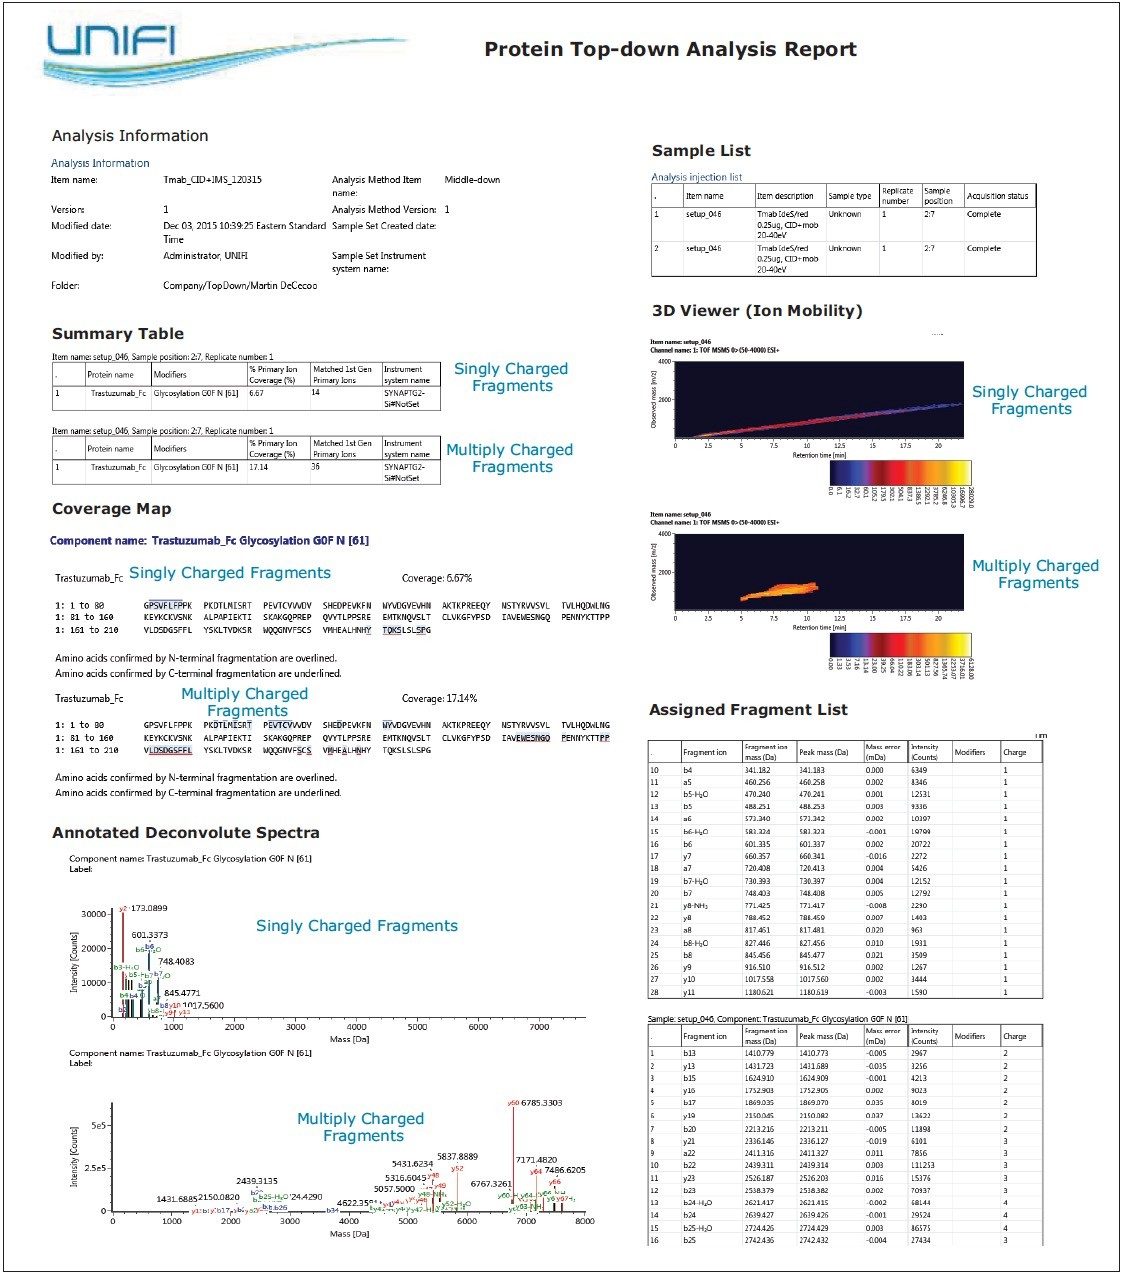
Direct fragmentation of proteins (top-down) provides an orthogonal approach to verify terminal sequence confirmation and localize protein modifications. Protein fragmentation approaches are primarily qualitative and have limited dynamic range to assess variation. Additionally, these approaches have no simple mechanism to determine modification abundance, making them a complementary technology to peptide mapping for mAbs and other biotherapeutics. Top-down protein fragmentation generates diverse fragment ion types and a multitude of charge states with overlapping spectral patterns. This data complexity complicates the process of producing primary structural assignments – usually through manual annotation – leading to the necessary development of software tools that automatically deconvolute raw spectral MS-MS data, annotate fragmentation patterns to protein sequences, and generate reports. These challenges have impeded broader usage of top-down protein analysis for routine biotherapeutic mAb development.
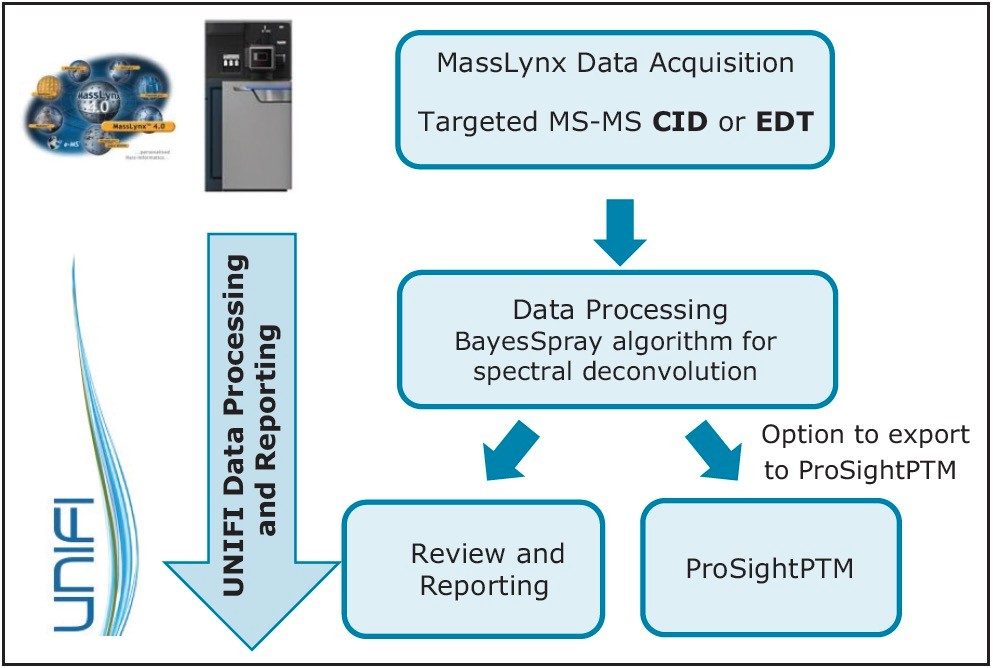
This application note demonstrates the acquisition of protein top-down analysis data by collision induced dissociation (CID) or electron transfer dissociation (ETD) MS-MS fragmentation from the SYNAPT G2-Si HDMS Mass Spectrometer (Figure 1). The data from these analyses was imported into UNIFI for processing, review, and report generation. This automated data processing workflow enabled efficient sequence verification, along with identification of modifications for a mAb and its subunits.