• Applikationsbericht

The Direct Quantification of a Mutagenic Impurity, Methyl Amino Crotonate, Using ACQUITY UPC2 and QDa Detector

The Direct Quantification of a Mutagenic Impurity, Methyl Amino Crotonate, Using ACQUITY UPC2 and QDa Detector

  • Janet Hammond
  • Mark D. Wrona
  • Waters Corporation
Scientist analyzing pills in medical laboratory

Abstract

This application note discusses the work carried out to investigate the use of Waters UltraPerformance Convergence Chromatography (UPC2) and MS detection using the ACQUITY QDa as an alternative technology for the analysis of MAC (Methyl-3-aminocrotonate) without the prior need of derivatization, for the detection and quantification in an active pharmaceutical ingredient (API).

Benefits

  • Highly selective, sensitive, and robust mass detection analysis using the ACQUITY. QDa. Detector
  • ACQUITY UPC2 provides high resolution and throughput with a short analysis time of 2.5 minutes
  • Alternative technology for the analysis of aqueous-sensitive compounds

Introduction

Mutagenic impurities, formerly known as genotoxic (GI) or potential genotoxic impurities (PGI), are compounds that have the potential to modify DNA, and as a consequence can cause cancer. It is important that impurities potentially present in the marketed drug are evaluated early in the drug development process. To that end, analytical methods must be developed that are sensitive and specific enough to determine the levels in both drug substance and product.

The International Conference on Harmonization published ICH M7 guidelines, which highlight the requirements for assessment and control of DNA-reactive impurities to ensure the safety of pharmaceutical products.1 The European Medicine Evaluation Agency (EMEA), U.S. FDA, and the Asia regulatory agencies all follow these guidelines. They require that any mutagenic impurities in a drug substance or drug product must be below the Threshold of Toxicological Concern (TTC) of 1.5 µg per day based upon the maximum daily dosage of the pharmaceutical compound over a lifetime. For example, for a dosage of 1 g of Active Pharmaceutical Ingredient (API) per day, any impurity must be less than 1.5 ppm (1.5 µg). This is orders of magnitude lower than for general pharmaceutical impurities analysis, which is at the 500 ppm level and governed by Q3B(R).2

Pharmaceutical analysis is typically performed using LC with UV detection for non-volatile compounds, or GC with FID detection for volatile compounds. However, the low levels of detection required for mutagenic impurities present a significant challenge. In these situations, MS detection is required in order  to achieve the desired sensitivity. Some of these methods are required to provide support during the whole life cycle of a drug from early development through to manufacturing quality control. Typical reverse-phase (RP) (where the majority of separations are done on C18 stationary phases) and normal-phase (NP) chemistries can be used; this opens up a wide range of selectivity choices to help develop successful separations.

Convergence chromatography (CC) is a chromatographic technique similar to HPLC, but instead of the weak mobile phase being aqueous it is replaced with supercritical carbon dioxide (CO2). Supercritical CO2 can be paired with a large number of different co-solvents to increase the solvating power. CO2 is miscible with the whole range of the eluotropic series opening up a large choice of solvent selectivity – with methanol, IPA, ethanol, and acetonitrile being the most commonly used co-solvents.

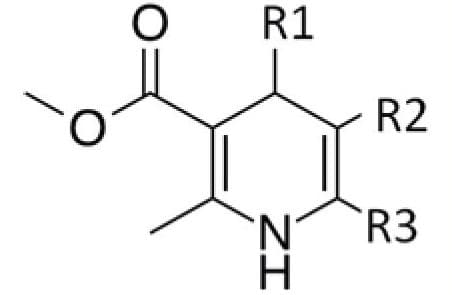
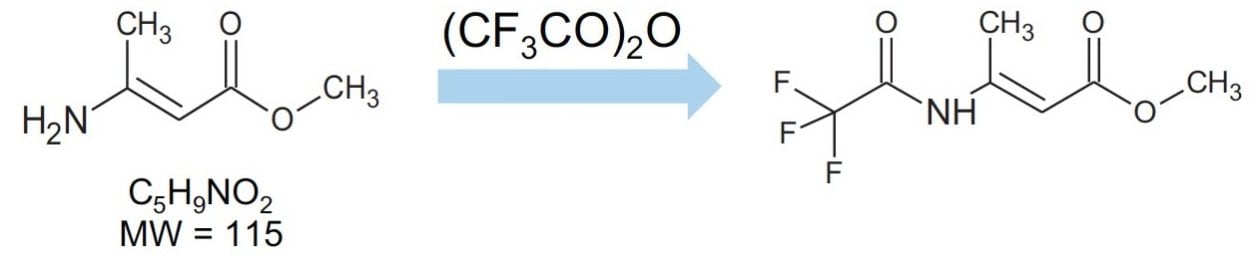
Methyl-3-aminocrotonate (MAC) is a Michael-reactive receptor and a starting material in a number of different cardiovascular drug products. The API used is an active substance from a proprietary drug product; therefore, only the partial structure is shown in Figure 1. MAC flags up a positive from the mutagenic structural alerts. This compound would typically be analyzed by static head space (SHS) GC-MS after derivatization with trifluoroacetic anhydride to increase the volatility (Figure 2).3 When MAC (underivatized) was analyzed by UPLC-MS nothing was seen; this was thought to be due to its poor stability in aqueous solvents.

In this type of trace analysis where there is a large amount of matrix it would be advantageous if chemical derivatization of the mutagenic impurity can be avoided for the following reasons:

  • The formation of acylation derivatives can be difficult to prepare
  • Reaction bi-products can occur, which could add more complexity to the matrix
  • The extra derivatization step would require extra validation to be completed

To avoid the above issues, this application note discusses the work carried out to investigate the use of Waters UltraPerformance Convergence Chromatography (UPC2) and MS detection using the ACQUITY QDa as an alternative technology for the analysis of MAC without the prior need of derivatization, for the detection and quantification in an active pharmaceutical ingredient (API).

Partial structure of drug product.
Figure 1. Partial structure of drug product.
Reaction scheme for the derivatization of MAC, typically used for GC analysis.
Figure 2. Reaction scheme for the derivatization of MAC, typically used for GC analysis.

Experimental

Sample preparation

10, 5, 2.5, 1, and 0.5 ppm standards of MAC (with respect to 1 mg/mL API) were prepared in methanol.

UPC2 conditions

System:

ACQUITY UPC2

Column:

Viridis BEH, 1.7 μm, 2.1 mm x 100 mm

ABPR:

1700 psi

Column temp.:

40 °C

Sample temp.:

15 °C

Injection volume:

1 μL

Flow rate:

1.5 mL/min

Mobile phase A:

CO2

Mobile phase B:

MeOH

Gradient:

5% to 95% B at 1.5 mins, held until 2.1 mins then 5% B

Run time:

2.5 mins

Make up solvent:

MeOH, 2% H2O and 0.1% formic acid

Make up flow:

0.6 mL/min

MS conditions

MS system:

ACQUITY QDa Detector

Ionization mode:

ESI positive

Single ion recording (SIR):

m/z 116.1 Da [M+H]+

Capillary voltage:

0.8 kV

Sampling frequency:

5 Hz

Probe temp.:

600 °C

Cone voltage:

8 V

Data management:

MassLynx Software v4.1

Results and Discussion

The structure of MAC is shown in Figure 2. It has a nominal molecular weight of 115 Da. Full scan analysis on the ACQUITY QDa Detector detected the expected [M+H]+ ion at m/z 116.1 Da.

Method Development

A number of different mobile B eluents were tried – including methanol, methanol with 0.1% formic acid, and methanol with 20 mM ammonium formate. The final method resulted in an elution time of 0.7 minutes for the MAC and 1.5 minutes for the API (Figure 3

MS TIC of m/z 116 from MAC and DAD of API from UPC2 analysis.
Figure 3. MS TIC of m/z 116 from MAC and DAD of API from UPC2 analysis.

ACQUITY QDa Detector probe temperature and cone voltage conditions were optimized for maximum sensitivity for the MAC analysis.

Matrix Effects

Selectivity issues can arise during trace analysis because the target analyte is at low levels in the presence of a large concentration of API, a counter ion, or – in the case of drug products – excipients. It is important when carrying out this type of analysis that a series of samples of API or drug product are spiked with the corresponding mutagenic impurity. This will indicate if there are any issues relating to stability, ion suppression, or enhancement effects. In this analysis, samples were prepared by spiking into the API a 1 ppm MAC standard, then analyzed. The result of this experiment showed that the areas for the unspiked and spiked standard were comparable. This implies the matrix does not have an effect on the MS response of this analysis. The areas of both spiked and unspiked samples are overlayed as shown in Figure 4.

Linearity and Sensitivity

The linearity of the method was evaluated with five standards of 0.5, 1.0, 2.5, 5, and 10 ppm of MAC in methanol. The method showed good linear correlation between the peak areas and  the ppm concentration with a correlation coefficient of R2 = 0.9985 (Figure 5). The signal-to-noise for the LOQ standard is more than 10 to 1 (Figure 6), and signal-to-noise ratio is 3 to 1 at the LOD standard (Figure 7). The percentage standard deviation of the six individual injections of all the five standards  was less than 4%.

An overlay of TIC chromatogram of m/z 116 from six injections of 1 ppm standard MAC and a 1 ppm MAC standard spiked into an API.
Figure 4. An overlay of TIC chromatogram of m/z 116 from six injections of 1 ppm standard MAC and a 1 ppm MAC standard spiked into an API.
Calibration graph of 0.5, 1, 2.5, 5, and 10 ppm standards of MAC.
Figure 5. Calibration graph of 0.5, 1, 2.5, 5, and 10 ppm standards of MAC.
SIR trace for the LOQ (1 ppm) of the MAC standard.
Figure 6. SIR trace for the LOQ (1 ppm) of the MAC standard.
SIR trace for the LOD (0.5 ppm) of the MAC standard.
Figure 7. SIR trace for the LOD (0.5 ppm) of the MAC standard.

Analysis of the API

Three different batches of a 1 mg/mL solution of API in methanol were analyzed, and the results showed that they all contained less than 1.0 ppm  of MAC. The overlay of a typical batch with a MAC 1 ppm standard is shown in Figure 8.

TIC of m/z 116 from a typical batch of API and a 1 ppm MAC standard.
Figure 8. TIC of m/z 116 from a typical batch of API and a 1 ppm MAC standard.

Conclusion

The ACQUITY UPC2 and ACQUITY QDa Detector with SIR provide a highly specific and sensitive method for the analysis of MAC down to a LOQ of 1.0 ppm related to 1 mg/mL API in solution

ACQUITY UPC2 and ACQUITY QDa Detector combination is an excellent opportunity for high-sensitivity trace analysis, and should be included as part of the toolkit for the analysis of mutagenic impurities

ACQUITY UPC2 and ACQUITY QDa Detector can be used through all stages of drug development and into a QC environment, if required

Fast analysis time because no derivatization and less validation was required

Alternative analysis for aqueous-sensitive components

References

  1. ICH M7, Assessment and Control of DNA Reactive (Mutagenic) Impurities in Pharmaceuticals to Limit Potential Carcinogenic Risk, International Conference on Harmonization, 23 June 2014.
  2. Impurities in New Drug Products Q3B(R) August 2005.
  3. Knapp D.R., Handbook of Analytical Derivatization. pg. 10.

720005846, November 2016

Zurück zum Seitenanfang Zurück zum Seitenanfang