In this study, we describe the use of the SYNAPT HDMS System to quickly obtain a partial amino acid sequence of a monoclonal antibody (mAb) via a top-down approach.
The Waters SYNAPT High Definition Mass Spectrometry (HDMS) System combines high-efficiency ion mobility with high-performance tandem mass spectrometry. This enables the analysis of samples differentiated by size, shape, and charge, as well as mass, to deliver increased specificity and sample definition.
In this study, we describe the use of the SYNAPT HDMS System to quickly obtain a partial amino acid sequence of a monoclonal antibody (mAb) via a top-down approach.
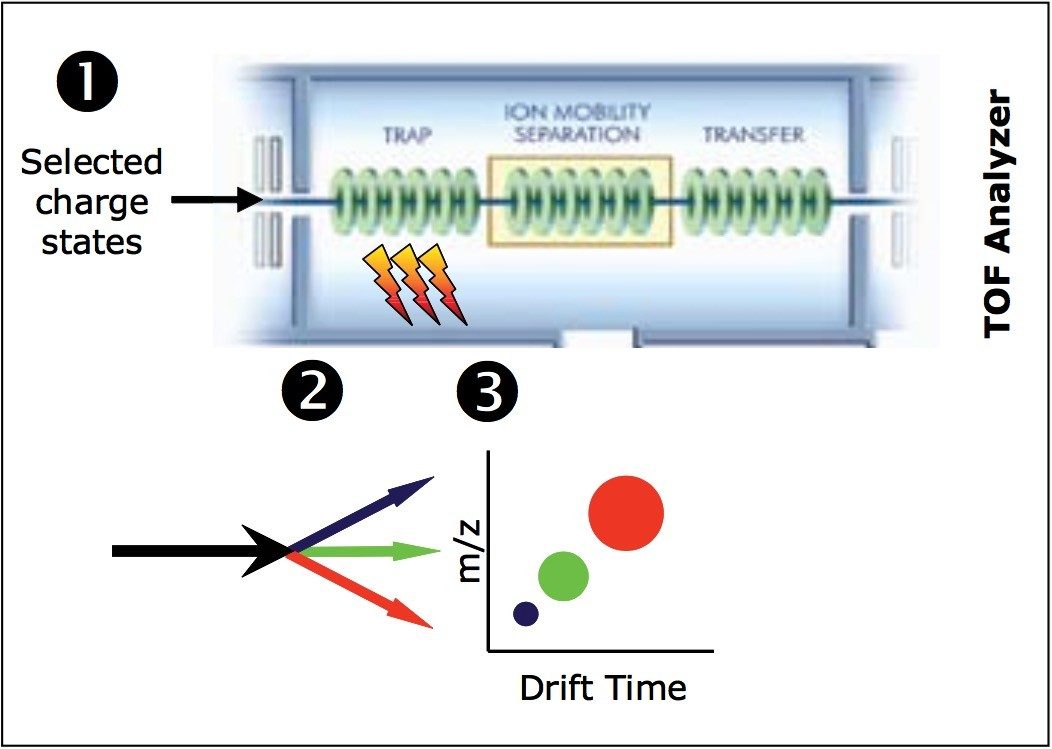
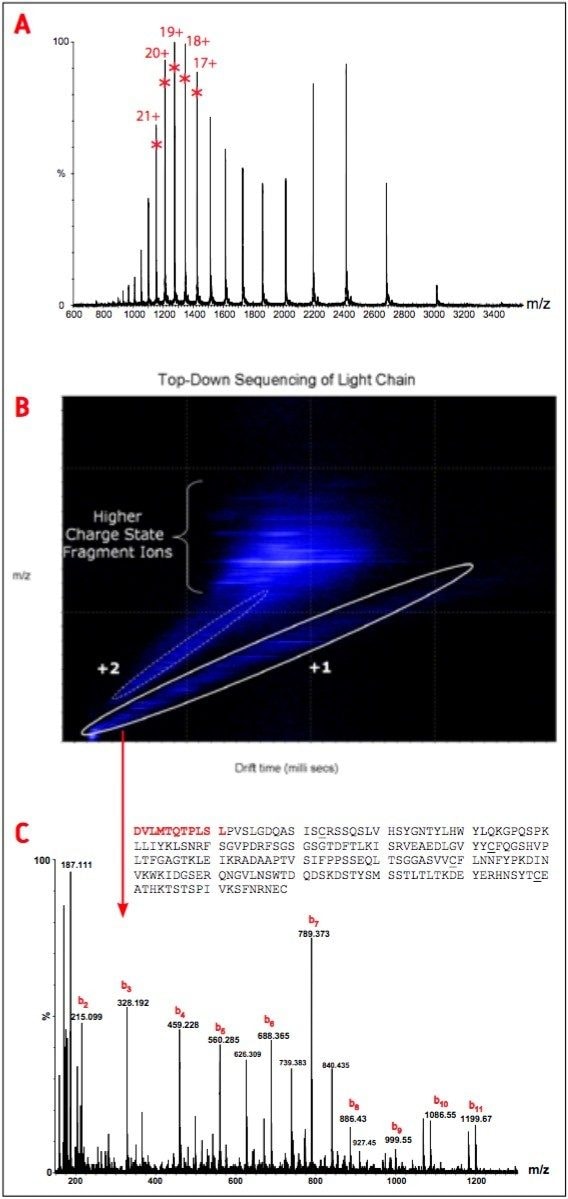
In this method, reduced mAb is introduced to the SYNAPT HDMS System via on-line desalting. Selected charge states of the intact light chain subunit are subjected to collision-induced dissociation (CID) prior to separation of the resulting fragment ions based on their gas phase mobilities.
Post-acquisition data processing produces simplified top-down fragmentation spectra containing fragment ions predominantly from one charge state, from which N-terminal amino acid sequence (up to 11 residues) of IgG can be readily deduced.
This structural information, coupled with molecule weight measurement of the intact mAb, can be used to support comparability studies and as a rapid ID test, reducing testing times and allowing for more efficient manufacturing processes.
Partial reduction of the IgG1 followed a published procedure.1 The IgG1 was reduced using DTT at 37 °C in the presence of Tris-HCl buffer (pH 8.0) containing EDTA. The sample was then diluted with formic acid and stored at 10 °C prior to analysis.
Reversed-phase desalting of the reduced antibody was performed on a nanoACQUITY UPLC System configured with a desalting column (MassPREP micro, Part No. 186004032). After injection (2.5 μg), the column was washed to remove the salts and other contaminants. Then the analyte was eluted (10 to 90% B in 15 min, flow rate of 20 μL/min, column temperature of 65 °C) and the column was re-equilibrated with initial conditions.
Mobile phase A: 0.1% formic acid in water
Mobile phase B: 0.1% formic acid in ACN
MS system: |
SYNAPT HDMS System |
Ionization mode: |
ESI positive (V mode) |
Capillary voltage: |
3200 V |
Cone voltage: |
35 V |
Desolvation temp.: |
150 °C |
Desolvation gas: |
100 L/Hr |
Source temp.: |
100 °C |
Acquisition range: |
100 to 2500 m/z |
Trap collision energies: |
Ramp 25 to 45 V |
Transfer collision energies: |
4 V |
Scan time: |
1s (0.2s interscan) |
IMS gas: |
N2 gas |
IMS gas pressure: |
6.29e-1 mbar |
Pulse height: |
Fixed, 8.4 V |
Protein ions produced during electrospray ionization are sampled by a ZSpray source and passed through a quadrupole, which was set to isolate light chain ions of a specific m/z. The selected ions are subjected to CID in the TRAP portion of the Triwave ion guiding device (Figure 1).2 The TRAP T-Wave traps, accumulates, and fragments ions, in this case for up to 100 msec. The ions are then gated into the IMS T-Wave, where the high-efficiency ion mobility separation (IMS) +1, +2, and +3, and multiply-charged peptide fragments occurs.
The partially reduced IgG1 was initially analyzed using the instrument in time-of-flight (TOF) mode. The TOF spectrum of the light chain obtained by on-line LC-MS analysis is shown in Figure 2A.
In the following acquisition experiment, five different charge states [+17 (m/z 1424.1), +18 (m/z 1345.0), +19 (m/z 1274.3), +20 (m/z 1210.6), +21 (m/z 1153.0)] were selected for fragmentation in the TRAP T-Wave (Figure 2A). Data were acquired with the instrument in mobility TOF mode (IMS-TOF).
Figure 2B displays a two-dimensional DriftScope plot diagram obtained from the ion mobility separation of fragments from the light chain of partially reduced IgG1. This figure shows that there is systematic difference in the drift time for +1, +2 and multiply charged fragments at a given m/z. Species with different charges are clearly separated according to their ion mobility.
As a result, all the +1 ions can be located in one ion cloud. Likewise, the +2 are represented by the data in a separate region. Figure 2C shows the raw mass spectrum of the light chain fragments from the selected region of +1 ions. The spectrum contains consecutive mass peaks from the N-terminal region of light chain sequence (up to 11 residues).
This work presents the top-down characterization of the variable region of a monoclonal antibody using the SYNAPT HDMS System. The method allows sequencing of the N-terminal region of the intact light chain in a simple, fast experiment that can be used for high-throughput screening of mutation variability during antibody production.
The method can also be used for a fast ID test, reducing QC testing time so product can be realized faster. The results demonstrate that the SYNAPT HDMS System is a superior tool to characterize mAb and other proteins.
720002392, October 2007