• Applikationsbericht

Application of UltraPerformance Liquid Chromatography for LC-MS Based Metabonomics

Application of UltraPerformance Liquid Chromatography for LC-MS Based Metabonomics

  • Ian D. Wilson
  • Jennifer H. Granger
  • Robert S. Plumb
  • AstraZeneca
  • Waters Corporation
White laboratory rat on vials

For research use only. Not for use in diagnostic procedures.

Abstract

This application note demonstrates the application of UltraPerformance Liquid Chromatography for LC-MS based metabonomics.

Introduction

Metabonomics

Metabonomics has been defined as “The quantitative measurement of time-related multiparametric metabolic responses of multicellular systems to patho-physiological stimuli or genetic modification” [J.K.Nicholson, J.C.Lindon, and J. Everett, Xenobiotica 1999]. Metabonomics studies, as applied to such application areas as target validation, drug efficacy, disease diagnosis, and personalized medicine, are typically performed using biological fluids such as plasma, urine, and CSF. These fluids are studied using information-rich spectroscopic techniques such as proton NMR or mass spectrometry. 

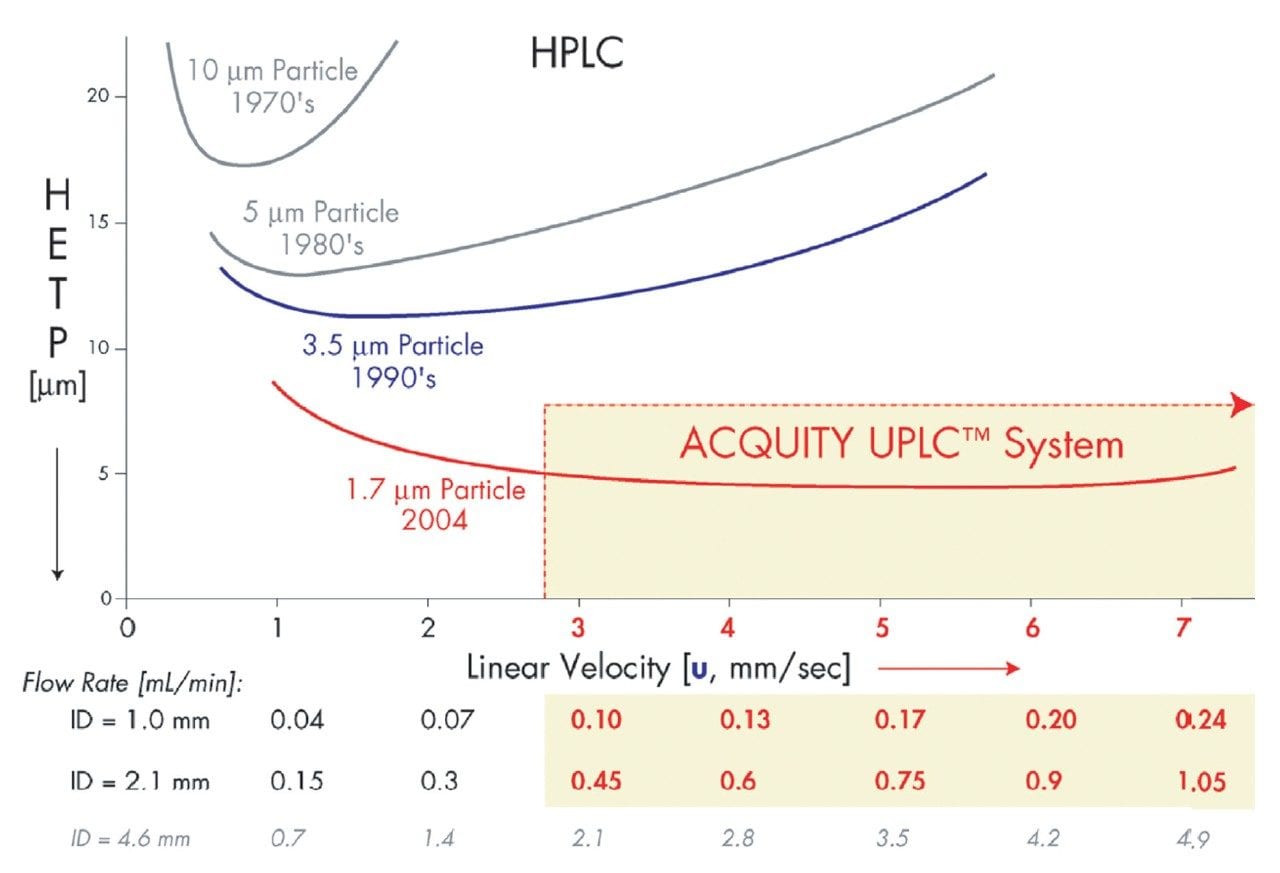
The analysis of these complex biological matrices requires a high-resolving separation prior to mass spectroscopic detection in order to minimize ion suppression and maximize sensitivity. The historical method of choice, High Performance Liquid Chromatography (HPLC), typically employs bonded silica stationary phases of particle diameters from 10 μm to 3 μm and instrumental operating back-pressures of up to 6000 psi. Ideally, one must consider a balance of several variables (particle size, column length, flow rate, backpressure, etc.) for the best chromatographic performance. The resolution in such a system is inversely proportional to the square root of the column particle size.

UltraPerformance LC (UPLC)

Smaller particles yield lower HETP (height equivalent to a theoretical plate), or higher column efficiency per unit length, as displayed in the flattened van Deemter curves in Figure 1. Thus, when the particle diameter is reduced from 5 μm to 1.7 μm, the resolution increases by a factor of 1.7. Furthermore, as sensitivity is inversely proportional to peak width, peak width is inversely proportional to the square root of efficiency. Reducing the particle size from 5 μm to 1.7 μm results in an increase in sensitivity by a factor of 1.7. Also displayed in Figure 1 is that optimal flow rate is inversely proportional to particle size. Thus, if we again reduce the particle size from 5 μm to 1.7 μm, the optimal flow rate increases by a factor of 3, resulting in a three-fold increase in speed.

van Deemter plot for 10, 5,3.5 and 1.7 μm column particle diameters.
Figure 1. van Deemter plot for 10, 5,3.5 and 1.7 μm column particle diameters.

The downside to reducing particle size is the significant increase in column backpressure (inversely proportional to the square of the particle size). Combined with an increase in optimal flow rate, this equates to a 27-fold backpressure increase with a 5 μm to 1.7 μm particle size reduction. In order to harness the potential of sub-2 μm particles without sacrificing performance at optimal flow rates, Waters has developed the ACQUITY UltraPerformance LC System and corresponding ACQUITY UPLC Column chemistries. This system and stationary phase have been holistically designed to withstand these very high pressures (up to 15,000 psi). The ACQUITY UPLC System is an ideal inlet for the Micromass LCT Premier Mass Spectrometer, the high sensitivity orthogonal time-of-flight (oa-Tof) instrument for routine exact mass measurement with a wide dynamic range for high throughput metabonomic screening.

Experimental

Increased Resolution and Sensitivity

A typical TIC chromatogram produced from an HPLC-MS analysis of a biofluid (2.1 mm x 100 mm, 3.5 μm C18 column and a 10 minute gradient: 0-95% acetonitrile at 600 μL/min) is shown in Figure 2. This chromatogram can be contrasted with that produced by a UPLC-MS biofluid separation in Figure 3 (2.1 mm x 100 mm, 1.7 μm C18 column and a 10 minute gradient: 0–95% acetonitrile at 750 μL/min). It is clear that the UPLC separation yields significantly more peaks (~250) compared that of conventional HPLC (~80–90).

Typical HPLC separation of mouse urine.
Figure 2. Typical HPLC separation of mouse urine.
Typical UPLC separation of mouse urine.
Figure 3. Typical UPLC separation of mouse urine.

The narrow peak widths generated by UPLC not only contribute to very high peak capacities, but also to an increase in signal response (Figure 4). Chromatographic theory predicts that when moving from 3.5 to a 1.7 μm particle diameter, the signal response should increase by a factor of 1.4. However, when coupled with mass spectrometry detection, we see a three- to five-fold increase in signal response. This increase in sensitivity is a result of the increased resolution and reduction in ion suppression caused by analyte co-elution. The resulting narrow peaks demand a high data acquisition rate from the mass spectrometer in order to obtain sufficient data points across the peaks. The LCT Premier has a data acquisition rate of 20 Hertz, yielding 10–20 points across the LC peak.

 Increased sensitivity produced by UPLC compared to that generated by HPLC.
Figure 4. Increased sensitivity produced by UPLC compared to that generated by HPLC.

UPLC-MS Metabonomics Study

The extra resolution and sensitivity produced by UPLC has been exploited for the metabonomic analysis of urine from black, white, and immunosuppressed “nude” mice. The urine samples were collected from both male and female mice (n = 10) in the morning (AM) and in the evening (PM), giving a total of 120 samples. The samples were stored frozen prior to analysis. After defrosting, the samples were centrifuged, the supernatant removed, and diluted 1:4 with distilled water.

The samples were analyzed by UPLC/oa-Tof MS operating in ESI positive ion mode. A comparison of the 5-minute UPLC-MS chromatogram produced for female AM black, white, and nude mouse urine is shown in Figure 5. We can see that the resulting data is very information-rich, showing subtle differences in the generated chromatograms.

Comparative chromatograms of female AM black, white, and nude mouse urine.
Figure 5. Comparative chromatograms of female AM black, white, and nude mouse urine.

LC Conditions

LC system:

ACQUITY UPLC System

Column :

ACQUITY UPLC Column, C18, 1.7 μm, 2.1 mm x 100 mm

Flow rate:

750 μL/min

Injection volume:

5 μL

Gradient:

Linear gradient of 0–95%, from 0.5–5 min., where A = 0.1% formic acid and B = acetonitrile containing 0.1% formic acid

MS Conditions

MS system:

LCT Premier with LockSpray Ionization Source

Ion mode:

ESI

Cone voltage:

60V

Capillary voltage:

3000V

Desolvation temp.:

250 °C

Source temp.:

120 °C

Resolution:

W-OPTICS 12,000 FWHM

Detection mode:

Positive ion mode

Dwell time:

0.05 sec

Collision gas:

Argon

Lock mass:

Leucine Enkephalin, 25 fmol/μL

Results and Discussion

Statistical Analysis of UPLC-MS Data

The LC-MS data generated was processed by the MarkerLynx Application Manager for MassLynx v4.0 Software. This generated a total of 9,000 markers in total, some of which were fragment ions. The resulting principal components analysis (PCA) scores plot for the female AM samples is displayed in Figure 6. Here we can see that the three strains of mice are clearly separated into distinct groups, using principal components 2 and 3.

PCA scores plot of UPLC-MS data.
Figure 6. PCA scores plot of UPLC-MS data from female AM black, white, and nude mouse urine.

The analytes determining the variance in the data is shown in the loadings plot, Figure 7. Here we can see the retention time and m/z value of the ions of contributing to each of the trajectories of movement for the three groups. From this we can see that the m/z = 259 at 1.8 mins “codes” for the data trajectory for the white mouse urine samples.

PCA loadings plot of UPLC-MS data.
Figure 7. PCA loadings plot of UPLC-MS data from female AM black, white, and nude mouse urine.

A comparison between the extracted ion m/z=259 for the black and white mouse urine is given in Figure 8. As can be seen from this data, the peak at 1.8 minutes is visible in the white mouse urine but not detected in the black mouse urine. It can also be noted that the peak widths produced are in the order of just 1–2 seconds at the base.

Extracted ion chromatogram.
Figure 8. Extracted ion chromatogram m/z = 259 for black and white female mouse urine.

High Throughput Analysis

The same mouse urine samples were subjected to re-analysis using a 2.1 mm x 30 mm, 1.7 μm ACQUITY Column and a 0–95% acetonitrile-aqueous formic acid gradient over 1 minute at 800 μL/min. The PCA scores plot generated for AM mouse data is given in Figure 9. This faster analysis generated fewer markers than the 5 minute separation but generated enough data to allow the nude samples to be separated from the black and white samples, with the male and female samples also separated for the black and white mouse samples.

Scores plot.
Figure 9. Scores plot from a 1 minute UPLC-MS analysis of black, white, and nude mouse urine.

Conclusion

  • The new Waters ACQUITY UPLC System has been specifically designed to operate with smaller column particles at the high backpressures required (>10,000 psi), for true high throughput performance. The very narrow peaks produced by UPLC give rise to a significant increase in sensitivity and resolution. In combination, these features yield more metabonomic information.
  • Alternatively, metabonomic analyses can be performed up to 10 times faster than HPLC, with comparable resolution.
  • The ACQUITY UPLC System combined with the LCT Premier Mass Spectrometer is ideal for complex biofluid analysis, providing automated exact mass measurements for the ultimate in sensitivity, resolution, speed, and mass accuracy.

720000866, August 2004

Zurück zum Seitenanfang Zurück zum Seitenanfang