• Applikationsbericht

Analysis of Coal Based Jet Fuel Feed Stocks By Exact Mass GC-FI-MS

Analysis of Coal Based Jet Fuel Feed Stocks By Exact Mass GC-FI-MS

  • Peter Hancock
  • Anthony Newton
  • Martin Green
  • Mark Badger
  • Waters Corporation
  • The Pennsylvania State University

Abstract

The analytical objectives of this paper are to identify and semi-quantify the nitrogen and sulfur containing compounds in the hydrotreated fractions and to identify and semi-quantify the hydrocarbon series present in the saturation fractions. These objectives were met using the GCT orthogonal acceleration Time-Of-Flight (oa-TOF) MS detect operating in Field Ionization (FI) mode.

Benefits

  • The oa-TOF mass spectrometer allows full mass range data to be produced with good mass measurement accuracy using a singlepoint internal lock mass correction
  • The ability of the instrument to produce exact mass chromatograms can enhance detection limits where chemical interference is the limiting factor using traditional bench-top mass spectrometers

Introduction

The next generation of aircraft will be based around high mach aircraft operating at higher temperatures. High mach aircraft use fuel as the primary coolant for on-board heat sources such as engine lubrication oil, hydraulic fluid, avionics and electrical systems.

Conventional fuel has some inappropriate properties when dealing with the temperatures that is predicted that these aircraft will generate (it forms solid deposits that could block fuel lines at high temperatures), therefore a new fuel is needed. Coal-based jet fuels have an inherent saturated cyclic structure that leads to thermal stability.

Feedstock of coal-based jet fuels can be derived from refined chemical oil (RCO) found in coal tar pitch. However, the drop in coal tar production has led to blending these distillates with suitable petroleum-derived fractions, e.g. light cycle oil (LCO). In this study a 50:50 blend of LCO and RCO will be analysed along with the individual LCO and RCO fractions.

The feedstock goes through two refinery processes, hydrotreatment and saturation, to increase the degree of saturation and hence, increase the thermal stability of the fraction. Hydrotreatment involves catalytic hydrogenation to remove heteroatom (nitrogen and sulfur) containing compounds by passing the feedstock over a nickel-molybdenum catalyst at 360 °C in the presence of 710-psi hydrogen. Heteroatoms can poison the noble metal catalysts used in the second stage saturation step. Saturation involves passing the hydrotreated feedstock over a platinumrhodium catalyst at 325 °C in the presence of 2100-psi hydrogen. Two passes are generally performed to fully saturate.

The analytical objectives of this paper are to identify and semi-quantify the nitrogen and sulfur containing compounds in the hydrotreated fractions and to identify and semi-quantify the hydrocarbon series present in the saturation fractions. These objectives were met using the GCT orthogonal acceleration Time-Of-Flight (oa-TOF) MS detector operating in Field Ionization (FI) mode.

Experimental

Instrumentation

The GCT is an oa-TOF MS detector designed for the characterisation of volatile compounds  by exact mass measurement and elemental composition determination. Electron Impact (EI), Chemical Ionisation (CI), FI, and FD (Field Desorption) ion sources are available. Sample introduction can be achieved through a GC or alternatively, directly from a heated insertion probe or DCI (Desorption Chemical Ionization) probe.

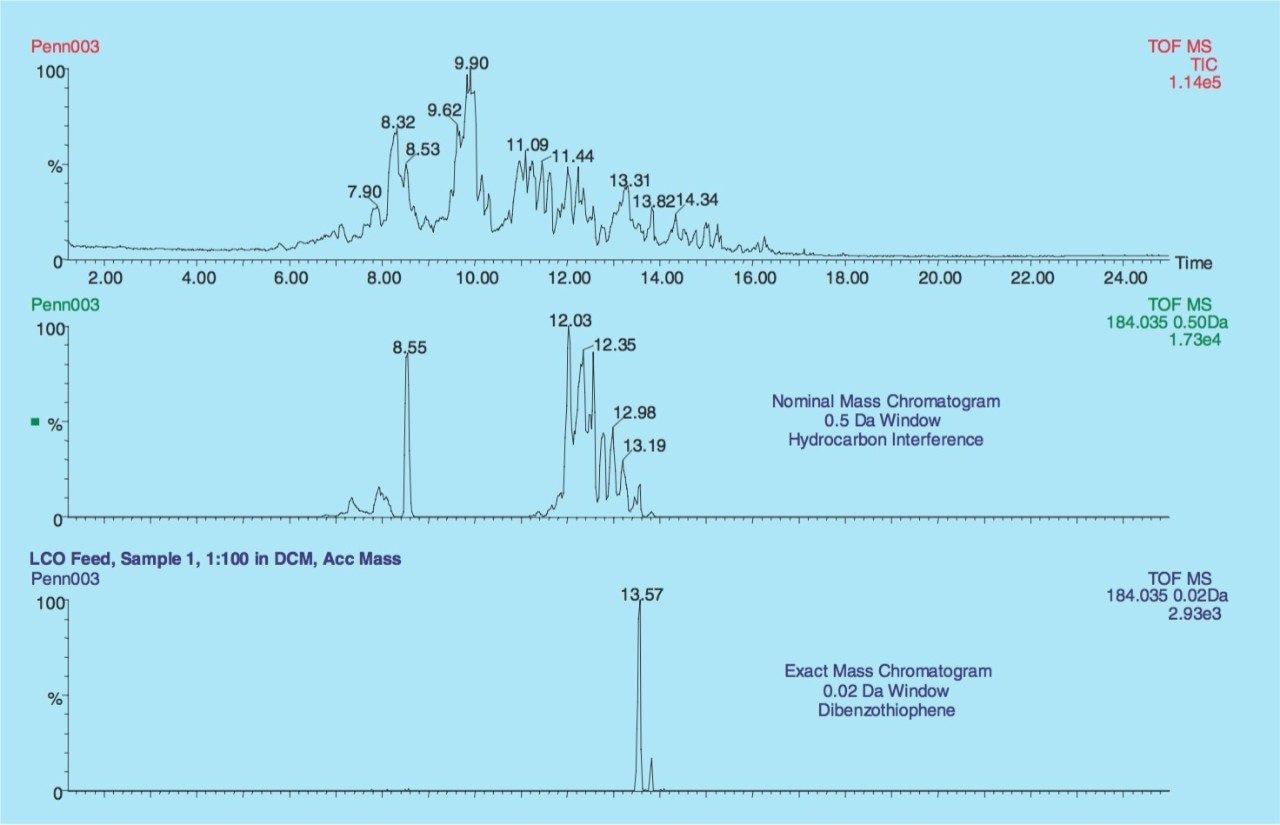
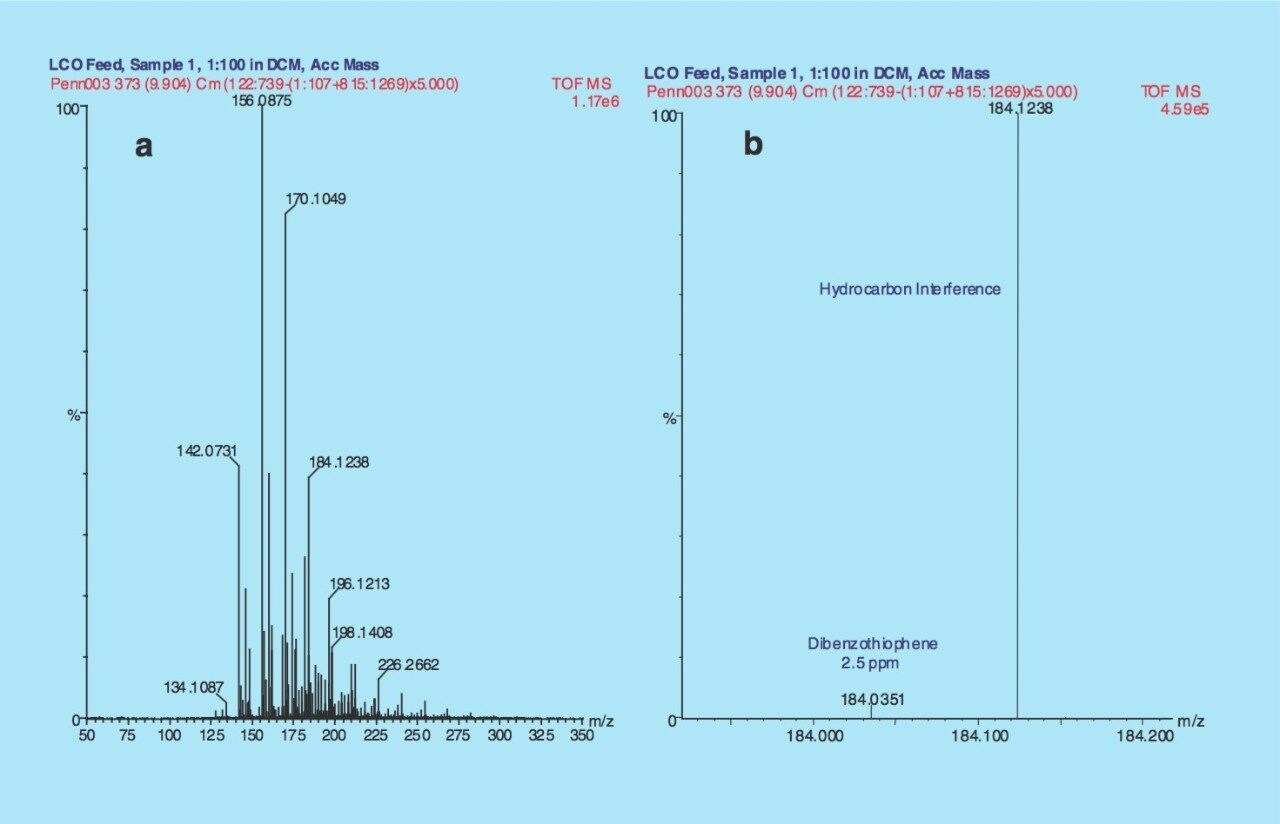
The GCT provides elevated mass resolution of 7000 Full Width Half Maximum (FWHM), good mass measurement accuracy to within 5 ppm and excellent sensitivity compared to scanning quadrupole instruments - maximizing the chemical information obtained from a single experiment.

Ions produced in the grounded ion source are accelerated to 40 eV and focused into a parallel ion beam. As the ions traverse the pushout region, a sudden voltage pulse is applied, ejecting a portion of the beam orthogonally. The ion beam is sampled at up to 30,000 times a second. A single-stage reflectron reflects the ions back to a dual microchannel plate (MCP) detector. Ion arrivals are recorded using a 3.6 GHz time-to-digital converter (TDC). Individual TOF spectra are summed before being transferred to a host PC.

The precise and stable, relationship between ion arrival time and the square root of its mass, allows good mass accuracy with only a single internal reference mass. A multi point calibration is first performed using a mixture of volatile reference compounds introduced via the septum interface. Once calibration was completed, the M+ ion of Chloropentafluorobenzene, m/z 201.9609, was used for single point lock mass correction. 

GCT and FI complement each other very well, providing a robust, easy-to-use, soft ionization GC-MS technique for the analysis of thermally labile compounds. FI requires no reagent gas and so is economical - requiring minimal optimisation and maintenance. FI yields simple spectra with intense [M+] molecular ions, unlike CI where the molecular ions are adducted, e.g., [M+H]+ or [M+NH4]+. In addition, FI spectra are very clean - helium is not ionised and any background from GC column bleed is negligible or non-existent. Consequently FI spectra are easy to interpret. 

The ion source consists of a dedicated outer source and a removable probe holding the FI emitter. The emitter consists of a tungsten wire onto which carbon dendrites have been grown. A counter electrode is held at high potential; this produces very high electric fields arounds the tips of the carbon dendrites. Sample molecules pass in close proximity to the tips and under the influence of these fields, quantum tunnelling of a valence electron takes place to give an ion radical. This process is very "soft" often producing spectra with very little or no fragmentation.

The samples were all diluted in Dichloromethane (1:100). Experiments were carried out by on-column injection (1 μL) of the samples into a carrier gas of helium at a constant flow rate of 1.0 mL/min delivered from a HP 6890 GC system with autosampler attached.

The injector temperature was ramped using the following conditions, 40 °C (2 min) → 290 °C (32.5 min) @ 100 °C/min. The capillary column employed was a J & W Scientific DB5-HT 15 m x 0.25 mm i.d., 0.1 mm df. The oven temperature ramp-rate used was 40 °C (2 min) → 290 °C (10 min) @ 10 °C/min.

The temperature of the transfer line was held at 250 °C. In FI+ mode, the extraction rods were operated at 12 kV with an emission current during the integration of 0 mA and a flash-off current of 5 mA during the delay. Mass spectra over the mass range between 50 and 800 Da were integrated over a period of 1.2s, with a delay between integrations of 0.2s.

Results and Discussion

The total ion chromatogram (TIC) of the LCO fraction is illustrated in Figure 1 along with the extracted masses of Dibenzothiophene (C12H8S, m/z 184.0347, 0.02 Da window, Rt = 13.57 min) and a  hydrocarbon interference (C14H16, m/z 184.1255, 0.5 Da window). In the nominal mass window (0.5 Da) the hydrocarbon interference completely disguises Dibenzothiophene but using the exact mass capability of the GCT (0.02 Da) the compound of interest can be detected without interference.

Figure 1. LCO Feed - TIC, nominal, and exact mass chromatograms for m/z 184.035. 

The summed spectrum of the whole chromatogram is illustrated in Figure 2a with an expanded view in the proximity of m/z 184.1 (Figure 2b). Dibenzothiophene (2.1 % relative abundance) has been resolved from the base peak hydrocarbon interference with an error of 2.5 ppm between the experimentally derived mass and the calculated theoretical mass.

Figure 2. Summed and expanded mass spectra of LCO Feed. 

The high resolution of the GCT (7,000 FWHM) can also be used to differentiate hydrocarbons with the general formulae CnH2n+2 and Cn+1H2n-12. For example, C14H30 (198.2348) and C15H18 (198.1409) have the same nominal mass but their exact masses differ by >90 mDa. Figure 3 illustrates that these two hydrocarbons can be resolved and that a relative percentage can be obtained for both paraffins and naphthalenes from the same sample, without the need for complex sample work-up.

Figure 3. Exact mass differences between C14H30 and C15H18

The Dibenzothiophene series (C12H8S, C13H10S, C14H12S, and C15H14S) from the LCO raw feedstock and the hydrotreated fraction are illustrated in Figure 4. The sum of the four extracted mass chromatograms illustrate that there was 0.7% of the dibenzothiophene series in the TIC from the raw feedstock compared to 0.0% from the hydrotreated fraction. The results clearly indicate that the hydrotreatment process has successfully removed the sulfur containing compounds.

Figure 4. Dibenzothiophene series from the LCO raw and hydrotreated feedstocks. 

Similarly from the RCO raw feedstock andhydrotreated fraction, the nitrogen containing compounds can be compared (Figure 5). The summed extracted mass chromatograms for Indole and Carbazole illustrate that there was 0.45 % of each in the TIC from the raw feedstock compared to 0.0% of Indole and 0.05% of Carbazole from the hydrotreated fraction. The results indicate that the hydrotreatment process has successfully removed Indole while Carbazole has only been partially removed and could go on to the saturation process and poison the noble metal catalyst.

Figure 5. Indole and Carbazole from the RCO raw and hydrotreated feedstocks. 

The LCO/RCO blend (50:50) is used to illustratethe ability of the treatment processes to  reach a high cycloalkane content and hence, a high thermal stability. The TIC for each fraction was summed together, resulting in a single spectrum where the relative abundance of each series (paraffins, monocycloparaffins, etc.) can be compared. The spectra were processed using Sierra Analytics Poly32 software (www.massspec.com). The processed spectrum from the raw feedstock of the LCO/RCO blend (50:50) is illustrated in Figure 6 where, S is the hydrocarbon series and R is the number or carbons. For example, S8 R10 represents C10 naphthalene.

Figure 6. Poly32 processed spectrum from the raw feedstock of LCO/RCO blend (50:50). 

Table 1 compares the relative abundance for each series in the raw feedstock, the hydrotreated fraction and the saturated fraction (pass 1 and 2) from the LCO/RCO blend  (50:50). Z is derived from the general formula CnH2n+Z. The base series for each sampleis listed in bold type. The results show that the hydrotreatment process partially hydrogenates the sample to form hydroaromati  compounds. The results also show that the saturation process only partially saturates the sample with pass 1 and it is not until pass 2 that the samples have a very high cycloalkane content leading to thermal stability.

Table 1. Percentage of each series in the raw feedstock, the hydrotreated fraction and the saturated fractions (pass 1 and 2) from the LCO/RCO blend (50:50).

Conclusion

The oa-TOF mass spectrometer allows full mass range data to be produced with good mass measurement accuracy using a singlepoint internal lock mass correction. Field ionization is a very powerful technique for soft ionization. The elevated resolution of the instrument (7000 FWHM) allows nominally isobaric ions to be mass resolved and elemental composition determined. The ability of the instrument to produce exact mass chromatograms can enhance detection limits  where chemical interference is the limiting factor using traditional bench-top mass spectrometers.

AN267, March 2002

Zurück zum Seitenanfang Zurück zum Seitenanfang