• Applikationsbericht

Advantages of a 3.6 GHz Time-To-Digital Converter Employed on oa-TOF Instrumentation

Advantages of a 3.6 GHz Time-To-Digital Converter Employed on oa-TOF Instrumentation

  • Jonathan P. Williams
  • Jonathan Pugh
  • Waters Corporation

This is an Application Brief and does not contain a detailed Experimental section.

Abstract

An investigation into the benefits of a 3.6 GHz time-to-digital converter (TDC), compared to a 1 GHz TDC was made on an orthogonal acceleration-Time-of-Flight (oa-TOF) mass spectrometer equipped with a ‘LockSpray’ interface for exact mass measurement of small nominally isobaric organic compounds using electrospray ionisation (ESI).

Benefits

  • Enables exact mass measurement at lower m/z values than was previously achievable
  • Providing elemental composition information which is essential for unambiguous identification

Introduction

An investigation into the benefits of a 3.6 GHz time-to-digital converter (TDC), compared to a 1 GHz TDC was made on an orthogonal acceleration-Time-of-Flight (oa- TOF) mass spectrometer equipped with a ‘LockSpray’ interface for exact mass measurement of small nominally isobaric organic compounds using electrospray ionisation (ESI).

In the investigation a nominally isobaric amino acid mixture and a nominally isobaric pesticide mixture were analysed by direct infusion mass spectrometry.

Experimental

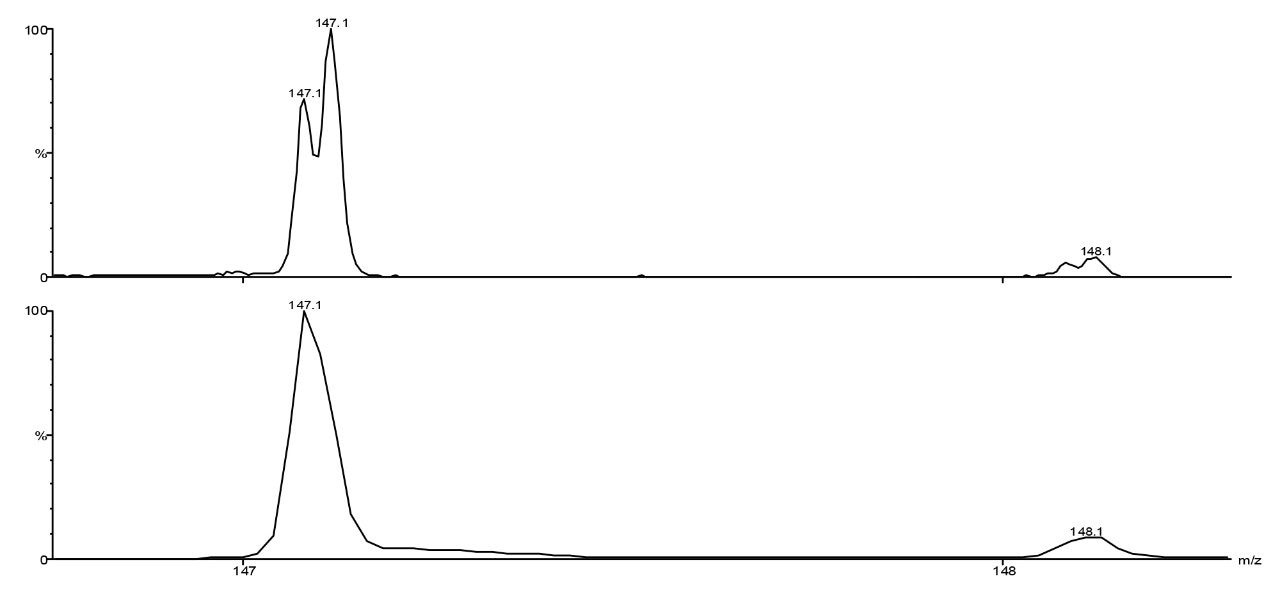
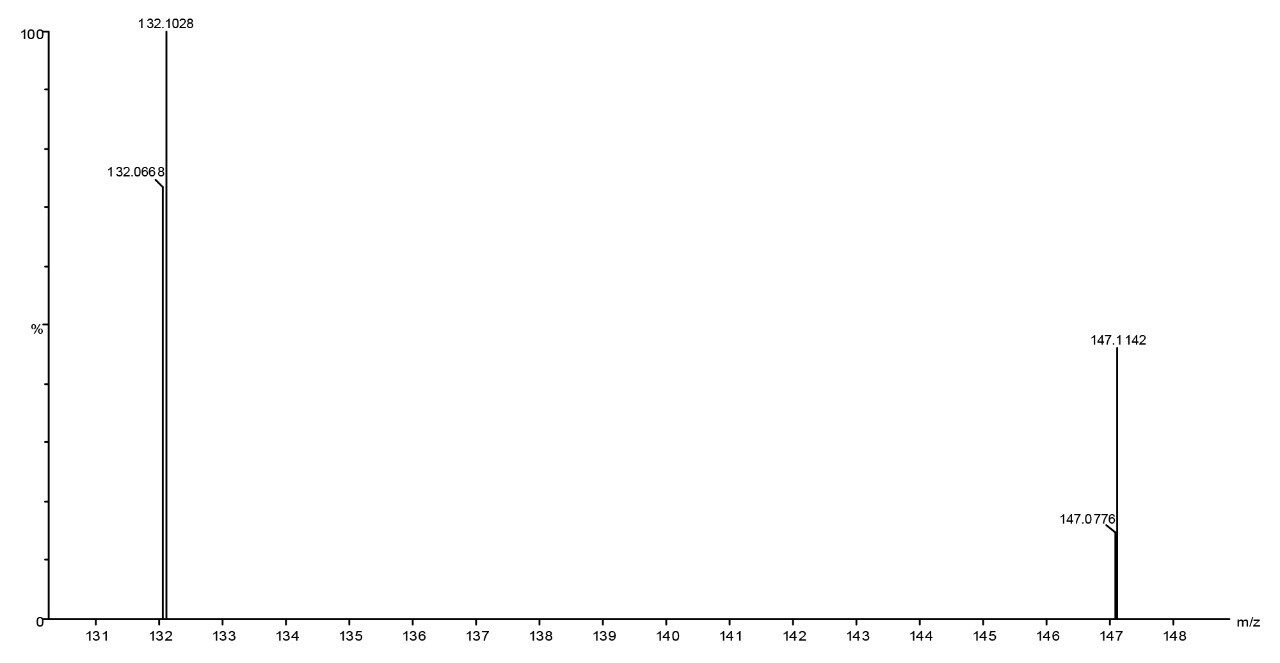
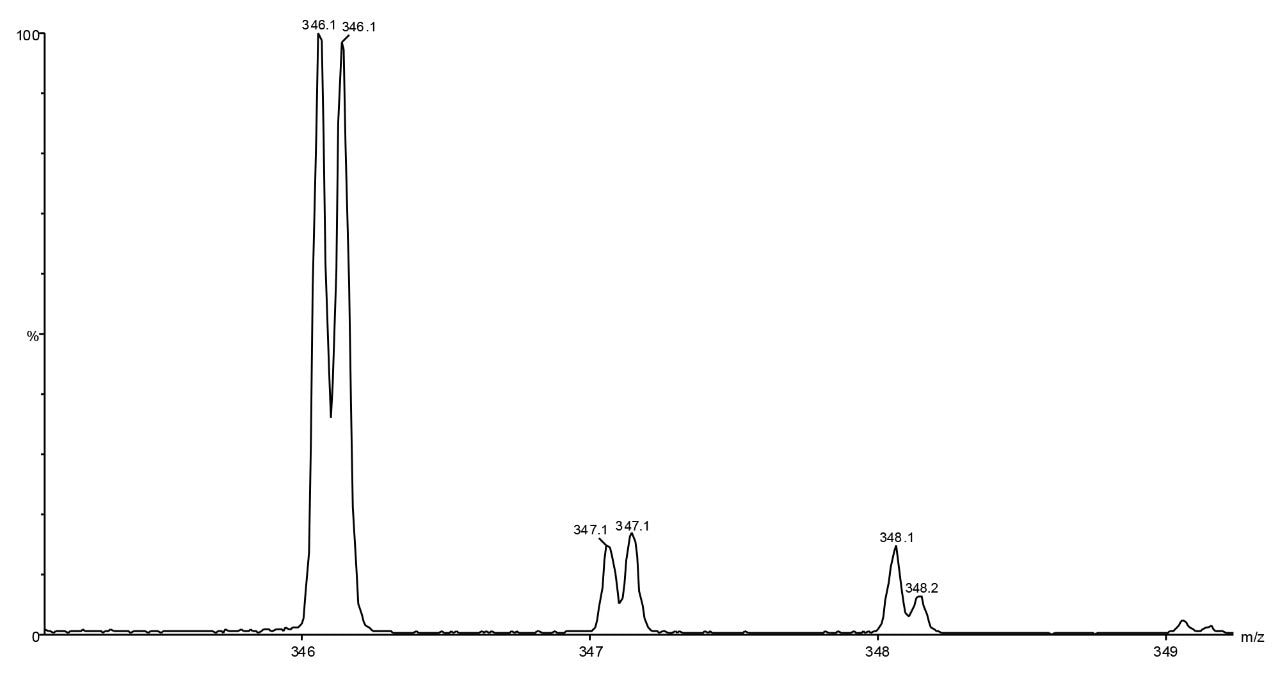
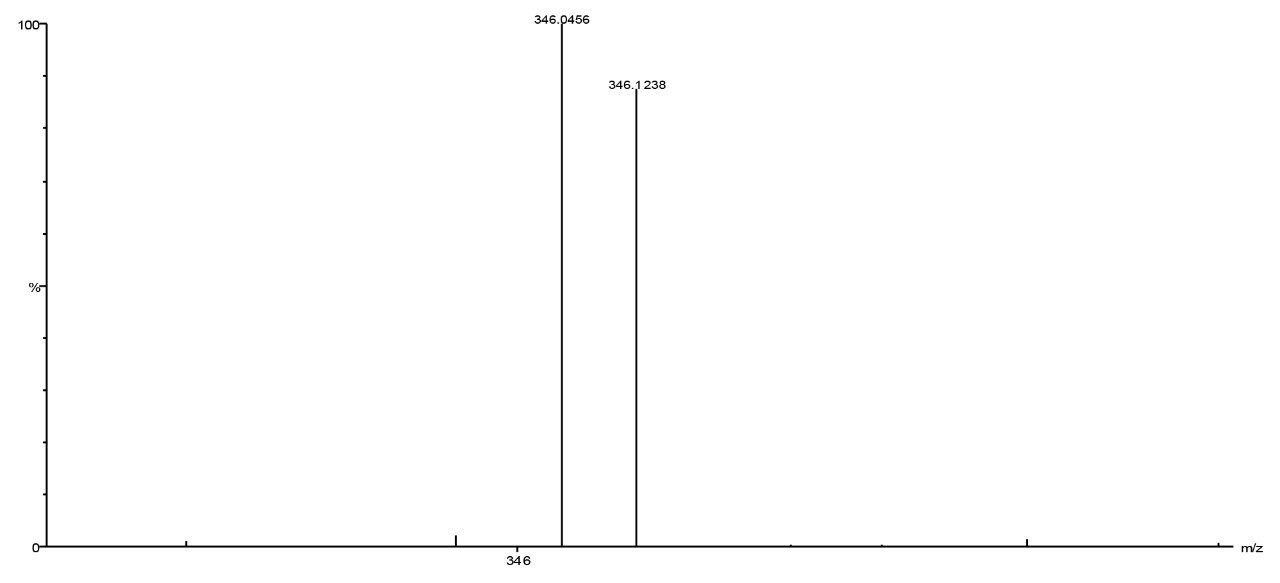
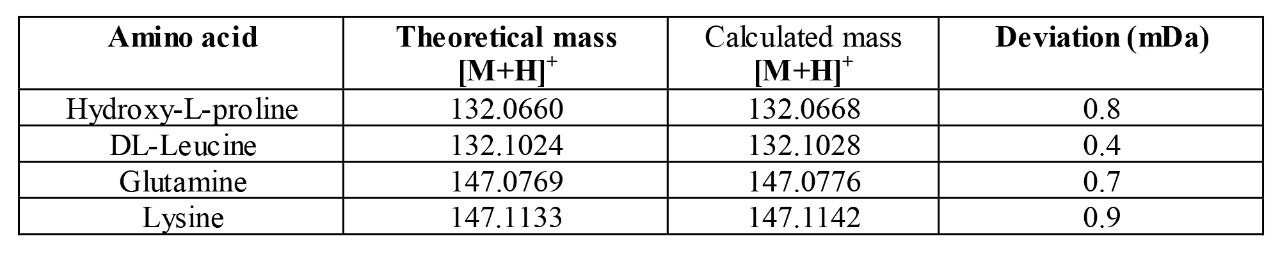
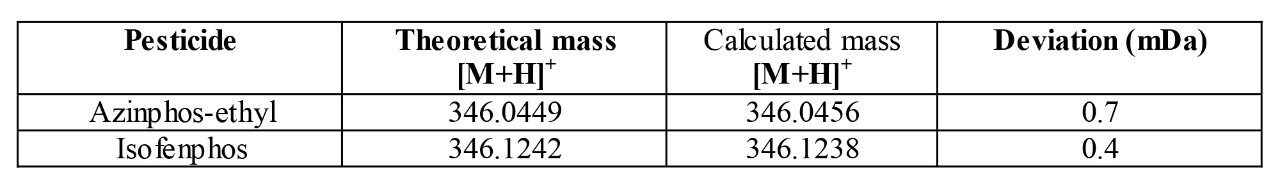
A solution containing the amino acid mixture of glutamine, lysine, hydroxy-L-proline and DL-leucine was prepared to a concentration of 5 ng/μL (1:1 H2O:Acetonitrile + 0.1% Formic acid) each component . The pesticide mixture consisting of isofenphos aazinphos-ethyl was prepared to a concentration of 2ng/μL in the same solvent system. The mixtures were then studied individually by direct infusion utilising a  Harvard Apparatus (South Natick, MA,USA) Model 22 Syringe Pump at a flow rate of 10 μL/min.

Mass spectra were acquired on a LCT oa-TOF mass spectrometer (Micromass UK Ltd, Manchester) fitted with a ‘LockSpray’ interface which is a dual electrospray ionisation source that samples analyte and reference ions independently (see Application Brief AB 24). Exact mass measurement was provided by infusing terfenadine ([M+H]+ = 472.3215) into the reference inlet of the dual electrospray source as a single point ‘lock mass’ against which any subsequently acquired mass spectra were mass measured. This ‘lock mass’ was infused at a flow rate of 10μL/min using a Harvard Apparatus Model 22 Syringe Pump at a concentration of 0.4ng/μL (1:1, acetonitrile:H2O). The optimum cone voltage for the amino acid mixture was 30V and 13V for the pesticide mixture. Mass spectra were collected in positive electrospray mode and acquired from 100-500Da at an acquisition rate of 1 spectrum/s with an inter-acquisition delay of 0.1s. The instrument equipped with a 1 GHz TDC was tuned for a resolution of 5250 (FWHM) and the instrument equipped with a 3.6 GHz TDC was tuned for a resolution of 6500 (FWHM) at m/z 556.

Results and Discussion

To demonstrate the advantage of operating an oa-TOF instrument employing a 3.6 GHz TDC compared with a 1 GHz TDC the amino acid mixture containing glutamine and lysine, which have the same protonated nominal mass of 147.1Da, was directly infused into the source region of the mass spectrometer.

Figure 1 shows an expanded region of the mass spectra obtained on two different instruments. The bottom trace was obtained on an LCT employed with 1 GHz TDC and the top trace obtained with a 3.6 GHz TDC. 

Figure 1. Mass spectra obtained on the LCT employing different digitisers. 

It can be clearly seen from the mass spectra obtained that the glutamine and lysine are resolved when the LCT is employed with a faster digitiser, although the ions are separated by only 36.4 mDa.

Figure 2 shows the ‘lock mass’ corrected exact mass measurement spectrum obtained for the amino acid mixture.

Figure 2. ‘Lock mass’ corrected exact mass spectrum obtained for amino acid mixture. 

The benefit of employing a 3.6 GHz TDC is also demonstrated for the mixture of two pesticides. The pesticides have the same protonated nominal mass of 346Da. Figure 3 shows the nominal mass spectrum obtained and Figure 4 an expanded region of the ‘lock mass’ corrected exact mass spectrum.

Figure 3. Nominal mass spectrum for mixture of pesticides 
Figure 4. ‘Lock mass’ corrected exact mass spectrum. 

For exact mass measurement of the amino acid and pesticide mixtures, five spectra from the reference data file were combined to produce an averaged spectrum at the same point in time as the analyte data to be mass measured. The exact mass data obtained for the amino acids and pesticides are shown in Table 1 and Table 2 respectively. The results show mass errors <1 mDa from the theoretical mass which is sufficient accuracy for assignment of an elemental formula.

Table 1. Exact mass measurement results for the amino acids. 
Table 2. Exact mass measurement results for the pesticides. 

Conclusion

It has been clearly demonstrated that a 3.6 GHz TDC offers a significant advantage over a 1 GHz TDC when employed with oa-TOF technology. At decreasing mass there are less data points across a mass spectral peak inherent in the TOF technique (flight time is proportional to the square root of mass). Nominally isobaric mixtures of peptides and pesticides which are unresolved with a 1 GHz TDC can be resolved with a 3.6 GHz TDC. This enables exact mass measurement at lower m/z values than was previously achievable, providing elemental composition information which is essential for unambiguous identification.

AB36, August 2001

Zurück zum Seitenanfang Zurück zum Seitenanfang