Tools to Reduce Photo-induced Degradation of Ketoprofen with the Alliance™ iS HPLC System with PDA Detector
Elom Pedanou, Kimberly Martin, Paula Hong
Waters Corporation, United States
Published on June 17, 2026
Abstract
Analytical methods involving photosensitive analytes routinely include precautions to minimize light exposure during sample preparation and handling. However, during liquid chromatography (LC) analysis with photodiode array (PDA) detection, analytes may still be exposed to intense or excess light, potentially resulting in photodegradation. This effect can be particularly evident when LC systems are configured with both a PDA Detector and a mass spectrometer (MS). In such cases, PDA chromatograms may not indicate detectable degradation, whereas MS analysis can reveal the presence and extent of photodegradation products. This discrepancy may complicate data interpretation and raise concerns regarding sample purity or system-related artifacts. Recent advancements in PDA detector design, including the incorporation of changeable optical filters in systems such as the Alliance iS HPLC System with PDA Detector, aim to mitigate this risk by reducing exposure to excess and nonessential wavelengths that contribute to photodegradation.
Benefits
- Optical filters, including a 214 nm long-pass filter and a 260 nm band-pass filter, are available on the Alliance iS HPLC System with PDA Detector to reduce photo-induced degradation of analytes
- UV analysis is not negatively impacted by the presence of the optical filters during analysis
- Implementing these optical filters may enhance signal response in downstream instruments, such as MS, by blocking degradative wavelengths
Introduction
Photodegradation, a specific form of chemical degradation, occurs when a photosensitive analyte absorbs photons, particularly those originating from solar radiation within the infrared, visible, and ultraviolet wavelength ranges.¹ During sample preparation, exposure to light is a common risk, especially if low-actinic glassware or appropriate light shielding is not employed.
Additionally, some degree of degradation may occur when using a PDA Detector due to its optical design. In this configuration, light from the lamp interacts with the sample prior to dispersion by the grating, exposing the analyte to a broad spectral range of approximately 190 nm to 800 nm. This exposure can induce degradation as the sample passes through the PDA flow cell. Unfortunately, such degradation is not readily apparent in the UV spectra generated by the PDA Detector. However, coupling the PDA with a mass detector enables detection of degradation products. Recent advancements in PDA technology have introduced mitigation strategies, such as the incorporation of optical filters.
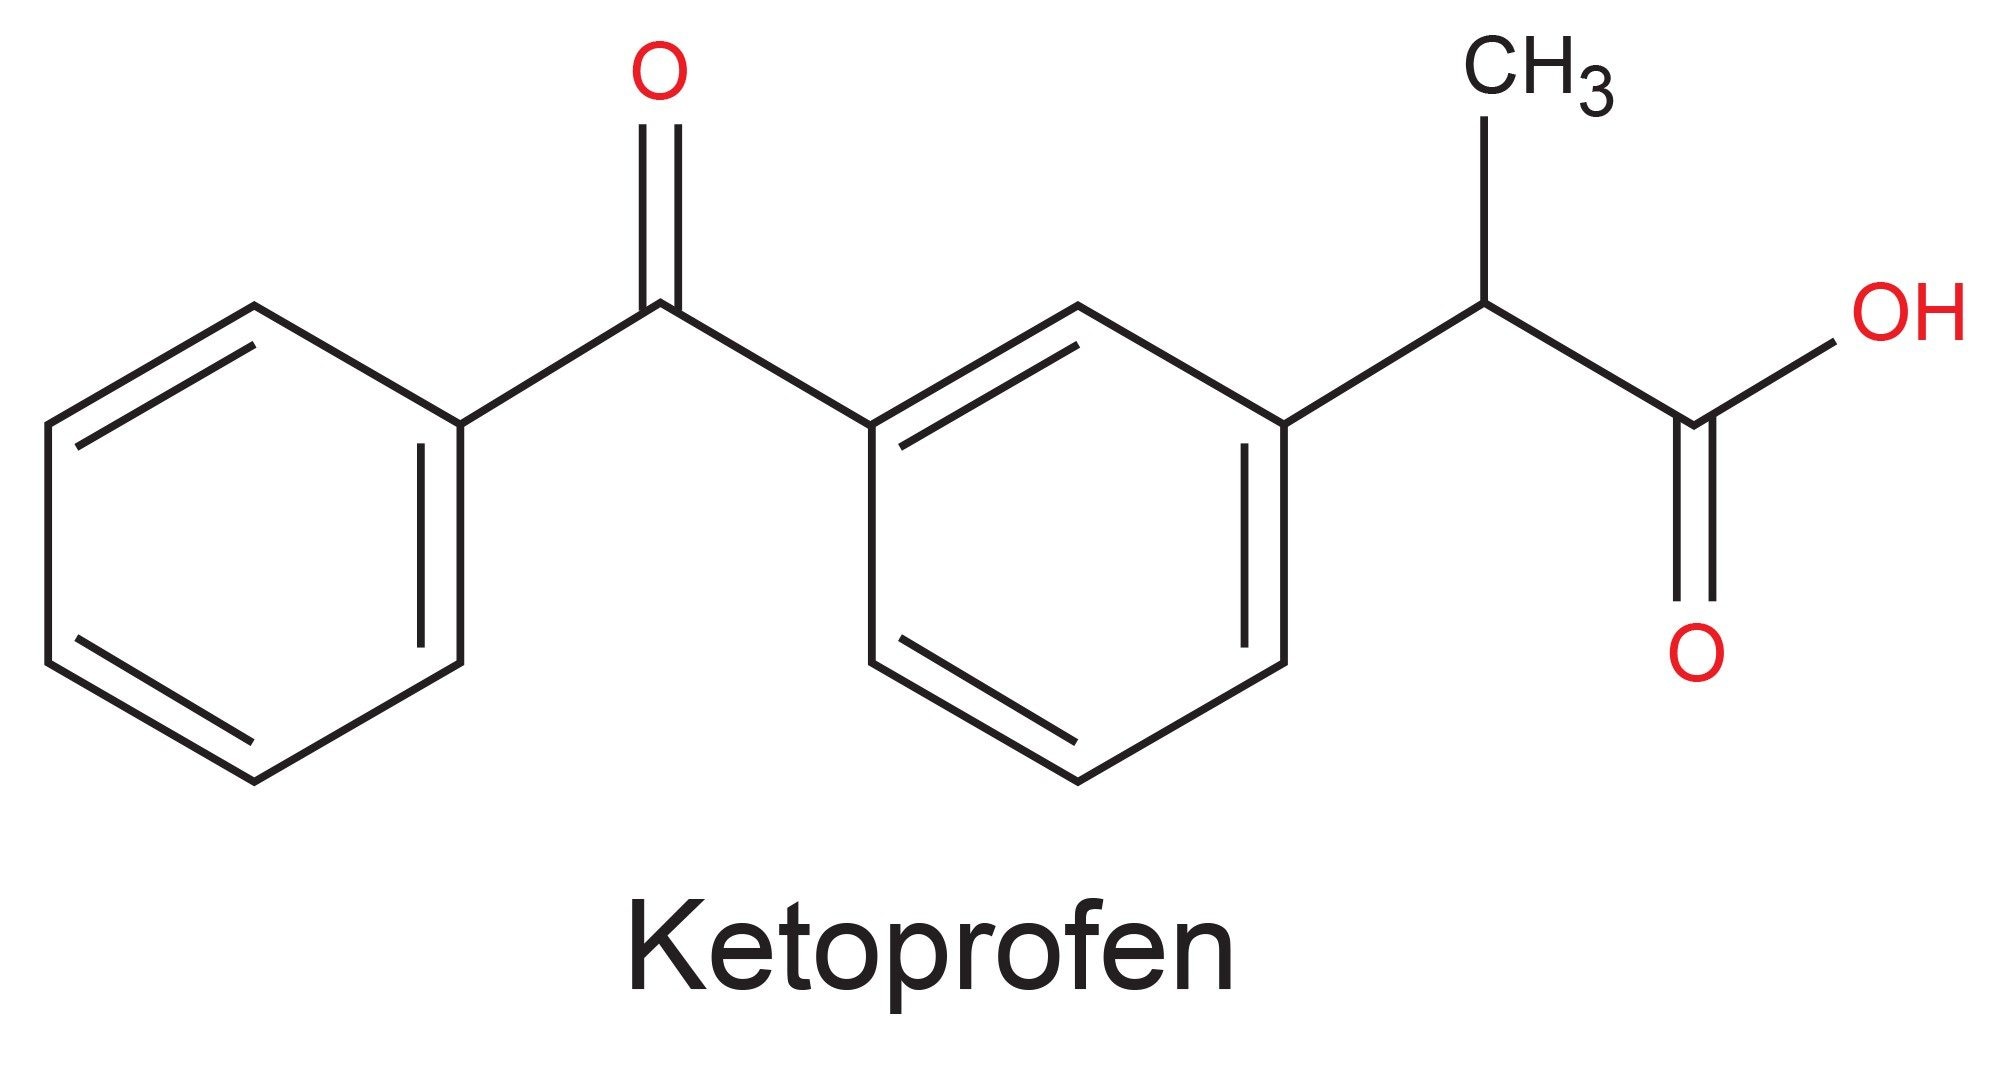
The Alliance iS HPLC System with PDA Detector offers two optical filter types to minimize analyte photodegradation: a band-pass filter, which transmits defined wavelength ranges for targeted detection, and a long-pass filter, which permits wavelengths above 214 nm. To evaluate the impact of these optical filters, a photosensitive analyte was analyzed using the Alliance iS HPLC System with PDA Detector coupled with an ACQUITY™ QDa™ II Mass Detector. Ketoprofen, a nonsteroidal anti-inflammatory drug (NSAID) used for pain and inflammation management, is known to be susceptible to photodegradation and was therefore selected as a suitable model analyte to illustrate the effect of optical filters during UV and mass spectrometric analysis.
Experimental
Sample Description
Reference standard was obtained from Sigma-Aldrich: Ketoprofen (CAS No.: 22071-15-4). Sample solution consists of 5.0 µg/mL ketoprofen in diluent.
Method Conditions
LC Conditions
|
LC system: |
Alliance iS HPLC System |
|
Detection: |
Photodiode Array Detector, 10 mm Analytical flow cell, 256 nm @ 10 points/second |
|
Vials: |
TruView pH Control LCMS Certified Max Recovery Vials, (p/n: 186005662CV) |
|
Column(s): |
XBridge™ BEH™ C18 Column, 130 Å, 3.5-µm, 4.6 mm × 50 mm (p/n: 186003031) |
|
Column temperature: |
40 °C |
|
Sample temperature: |
10 °C |
|
Injection volume: |
48 μL |
|
Flow rate: |
0.5 mL/min |
|
Mobile phase A: |
0.1% Formic Acid in Water |
|
Mobile phase B: |
0.1% Formic Acid in Acetonitrile |
|
Diluent: |
0.1% Formic Acid in Water: 0.1% Formic Acid in Acetonitrile (65:35) |
|
PDA filters: |
Band Pass 260 nm (p/n: 700014971) Long Pass 214 nm (p/n: 700014970) |
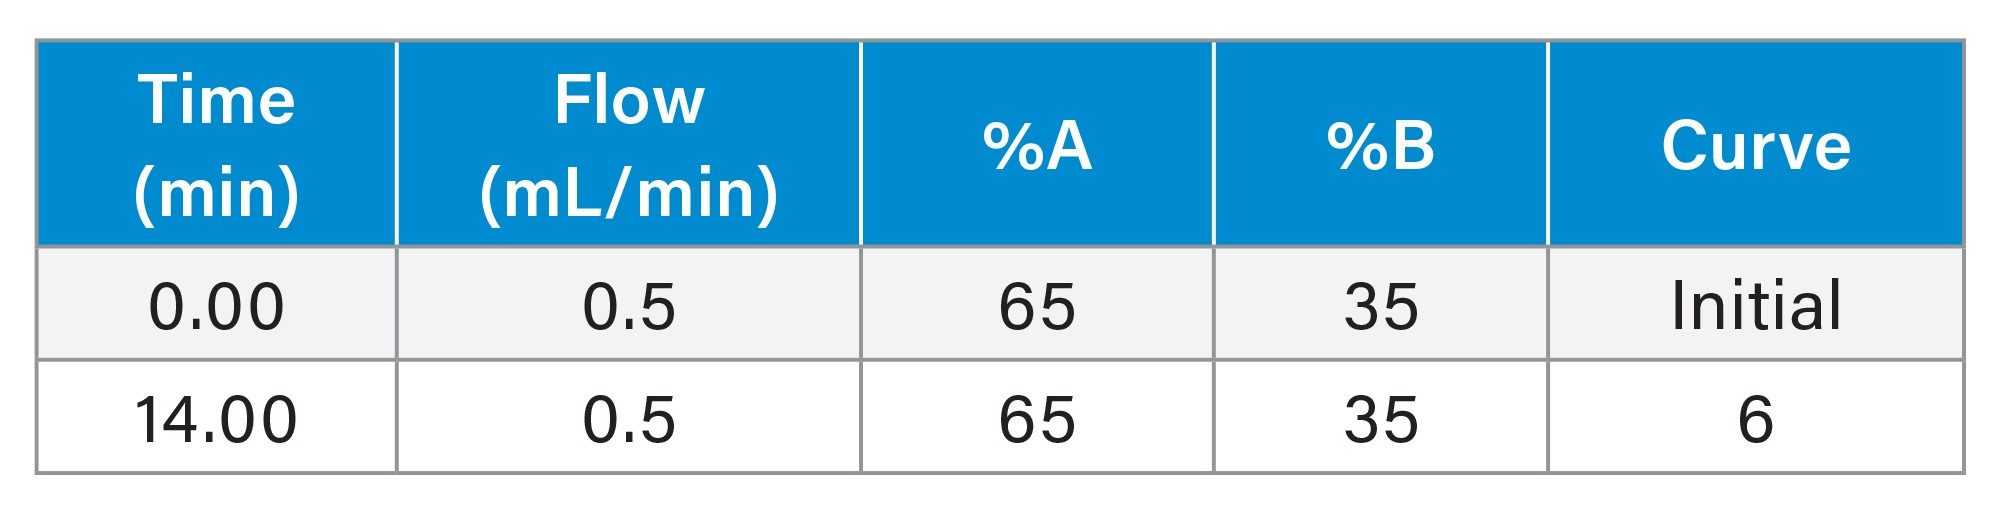
Gradient Table
MS Conditions
|
MS system: |
ACQUITY QDa II Mass Detector with Diverter Valve (p/n: 186008515) |
|
Ionization Mode: |
ESI+ |
|
Mass range: |
120 Da – 650 Da |
|
Capillary voltage: |
ES + 0.8 kV |
|
Sampling rate: |
5 points/second |
|
Cone voltage: |
15 V |
|
Source temperature: |
120 °C |
|
Probe temperature: |
600 °C |
Data Management
|
Chromatography software |
Empower™ 3.9 |
Results and Discussion
Solutions for Reducing Photodegradation
PDA detectors are commonly used in laboratories, and photosensitive analytes are sometimes analyzed using these systems. However, due to the design and functionality of some PDA detectors, exposing photosensitive samples to the full light spectrum from the lamp can lead to degradation.
The Alliance iS HPLC System with PDA Detector addresses this issue by offering optional filters to minimize degradation. The 214 nm long pass filter, the only available long pass option, allows wavelengths above 214 nm to pass through. Band pass filters are available in three wavelength options: 220 nm, 260 nm, and 280 nm. These band pass filters transmit light within ±5 nm of the specified wavelength through the flow cell, enabling targeted detection.
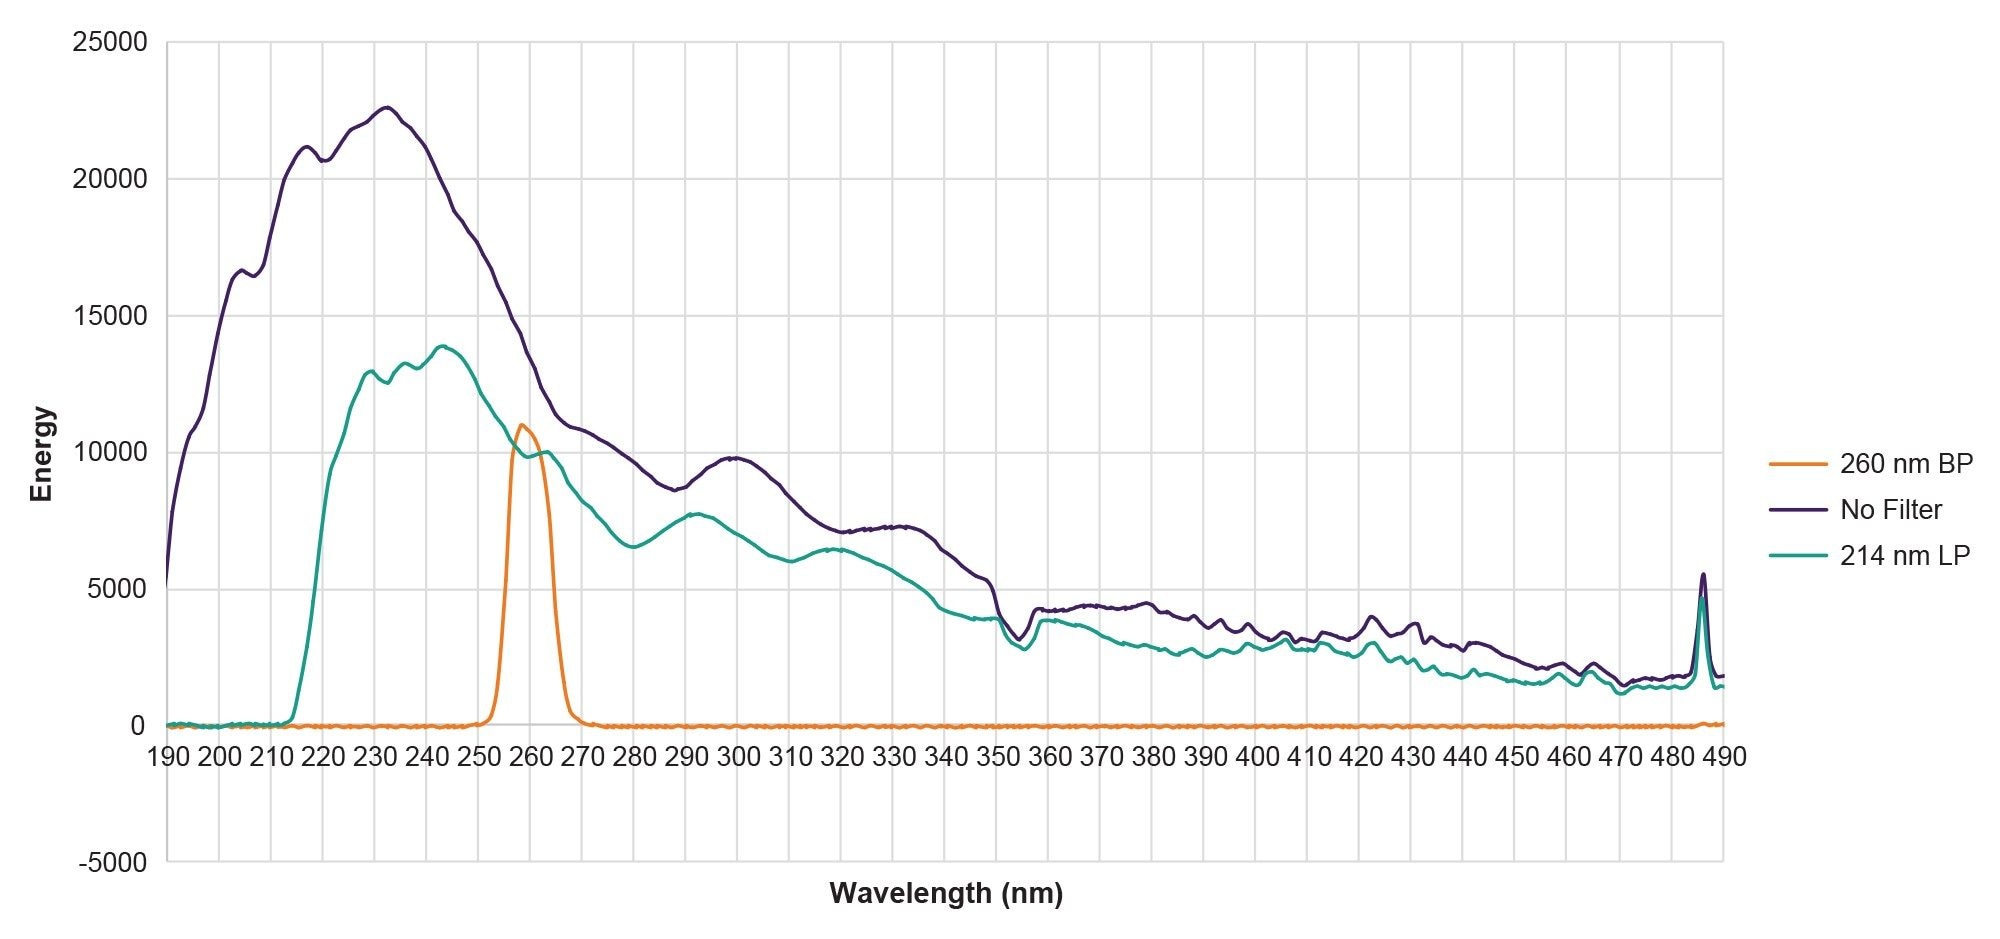
The functionality of the filters is shown in Figure 2. The purple energy spectrum depicts the normal operation of the PDA Detector without an optical filter. When optical filters are introduced, the no‑filter spectrum becomes modified. With the 214 nm long‑pass filter, no energy is detected until approximately 214 nm, after which the signal begins to rise, demonstrating the expected behavior of a long‑pass filter at that wavelength. In contrast, the 260 nm band‑pass filter shows no measurable energy until around 255 nm, where the signal increases, reaches a maximum near 260 nm, and then returns to zero by approximately 265 nm.
Analysis of the Impact of Optical Filters on Photodegradation of Ketoprofen
Ketoprofen, a light-sensitive NSAID was selected to evaluate the performance of optical filters. With a maximum absorbance near 256 nm, the 260 nm band-pass filter was chosen because its range includes the ketoprofen wavelength. Additionally, a 214 nm long-pass filter was tested for effectiveness.
The initial control analysis was performed without any optical filter installed in the PDA Detector. Subsequently, the ketoprofen sample was analyzed in three replicates using the 214 nm long-pass filter, followed by three replicates with the 260 nm band-pass filter.
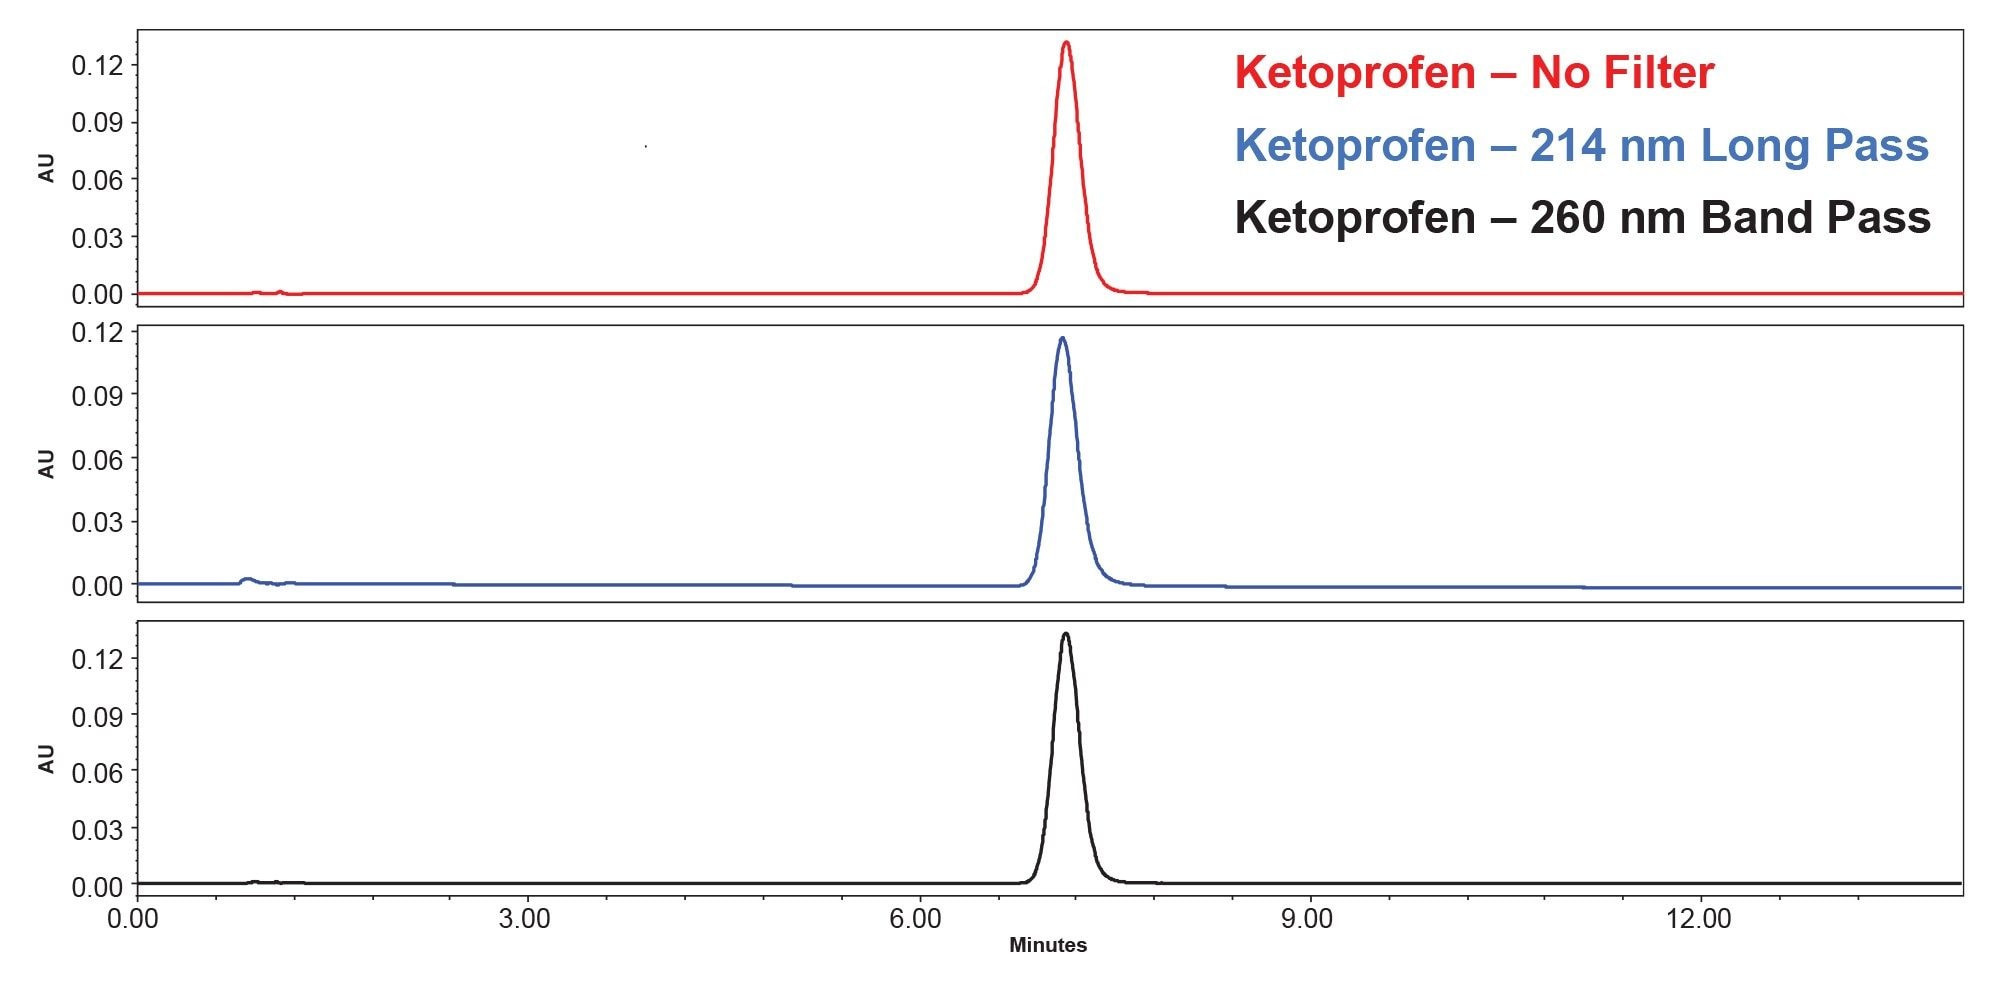
When optical filters were used to minimize photodegradation by the PDA Detector, the resulting UV chromatographic data remained unchanged, as evidenced by consistent retention times (Figure 3). Additionally, as summarized in Tables 1 and 2, the UV ketoprofen peak area remained the same with and without the use of either optical filter, indicating that the filters did not interfere with the quantitation. However, it is important to note that sensitivity decreases when bandpass filters are employed because they transmit only a narrow portion of the incident light. The reduced light throughput increases noise, which in turn diminishes overall sensitivity. In contrast, the long‑pass filter allows a broader range of wavelengths to reach the detector, resulting in higher light transmission and therefore a smaller reduction in sensitivity.
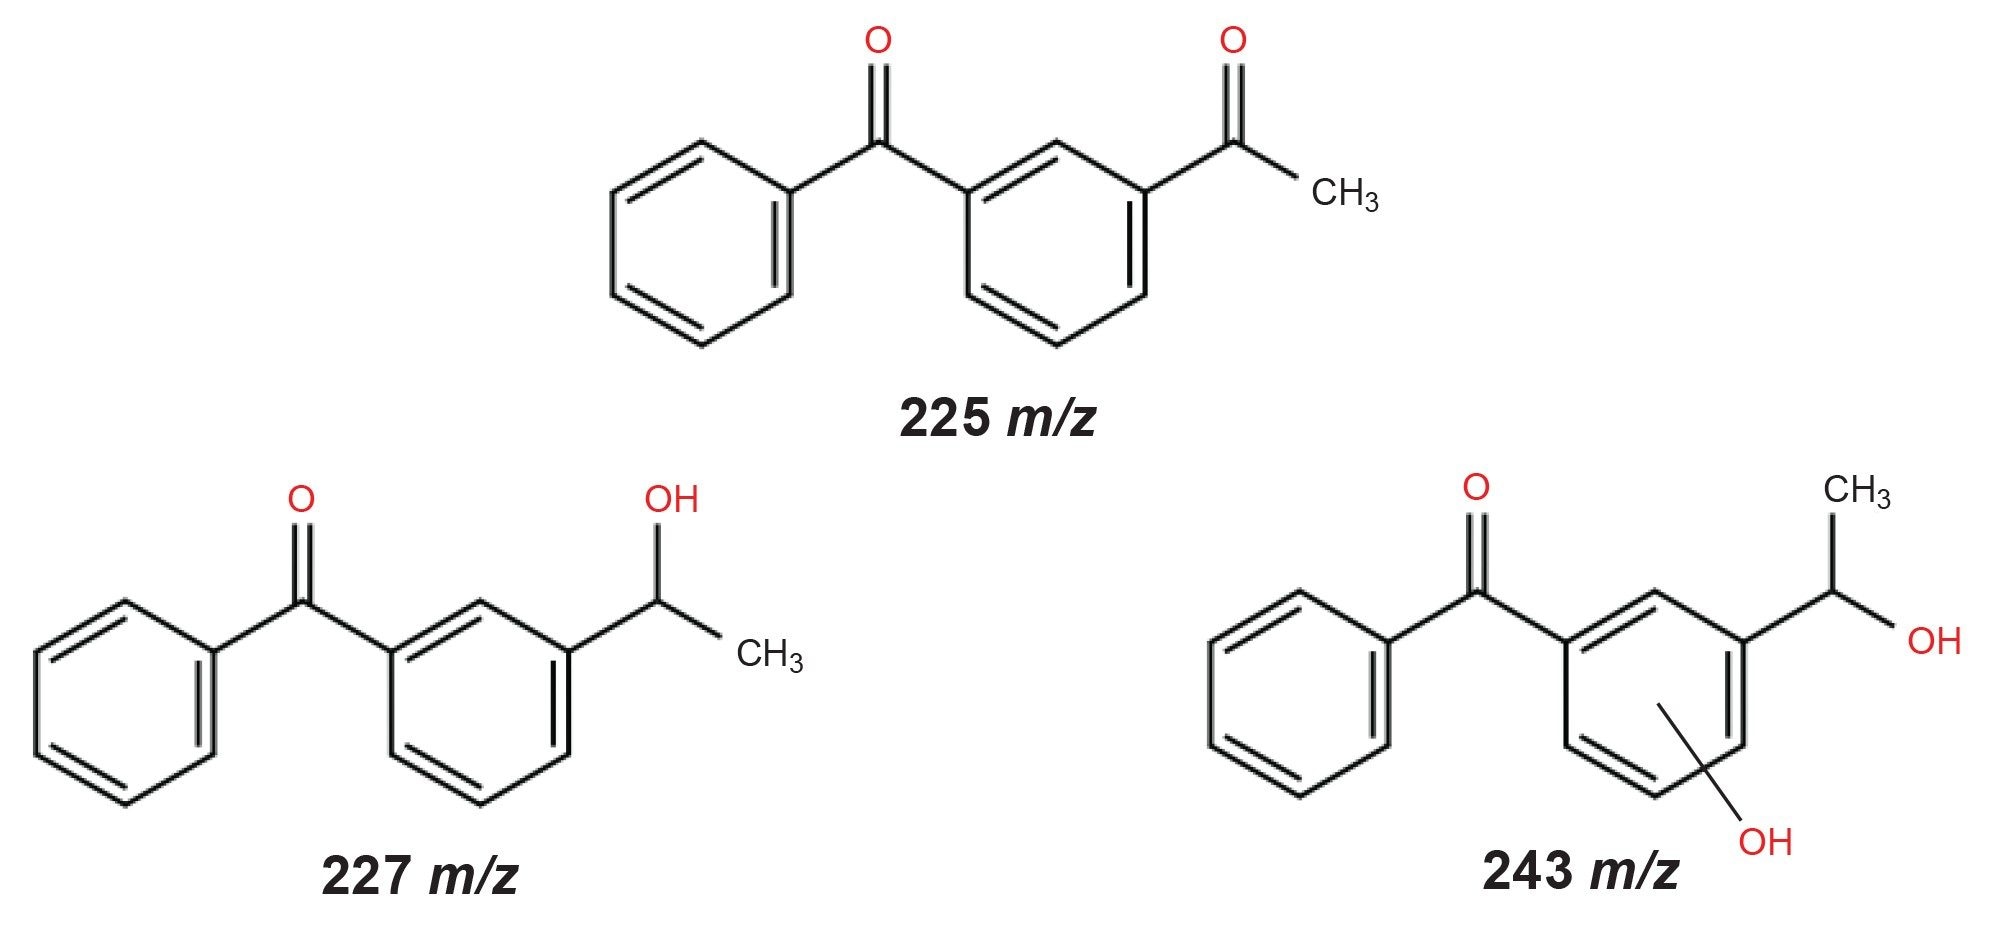
To evaluate the impact of optical filters on ketoprofen photodegradation, the Alliance iS HPLC System with PDA Detector was coupled to a ACQUITY QDa II Mass Detector using a diverter valve. The ACQUITY QDa II Mass Detector enabled detection of ketoprofen and its degradation products based on mass-to-charge ratio, while the diverter valve ensured system compatibility by directing flow to waste as needed to prevent flooding of the mass detector. All analyses were performed in triplicate, with reported values representing averages across the corresponding detection channels. Ketoprofen was monitored using single ion recording (SIR) at m/z 255 to assess changes in MS peak area, while three known degradation products were identified and monitored at m/z 225, 227, and 243.2 The effectiveness of the optical filters in reducing photodegradation was evaluated by comparing the total peak area of these degradant ions.
The use of optical filters highlighted the extent of ketoprofen degradation produced by the PDA Detector. Both filters resulted in an increase in the ketoprofen MS peak area and a corresponding decrease in the degradant MS peak area.
As shown in Table 1, the 214 nm long-pass filter increased the ketoprofen MS peak area by approximately 35% while reducing the degradant MS peak area by about 30%. Similarly, the 260 nm long-pass filter produced an even greater effect, increasing the ketoprofen peak area by roughly 117% and decreasing the degradant peak area by about 77%, as shown in Table 2. It should be noted that the effectiveness of these filters on photosensitive compounds may vary.
Table 1

Table 2
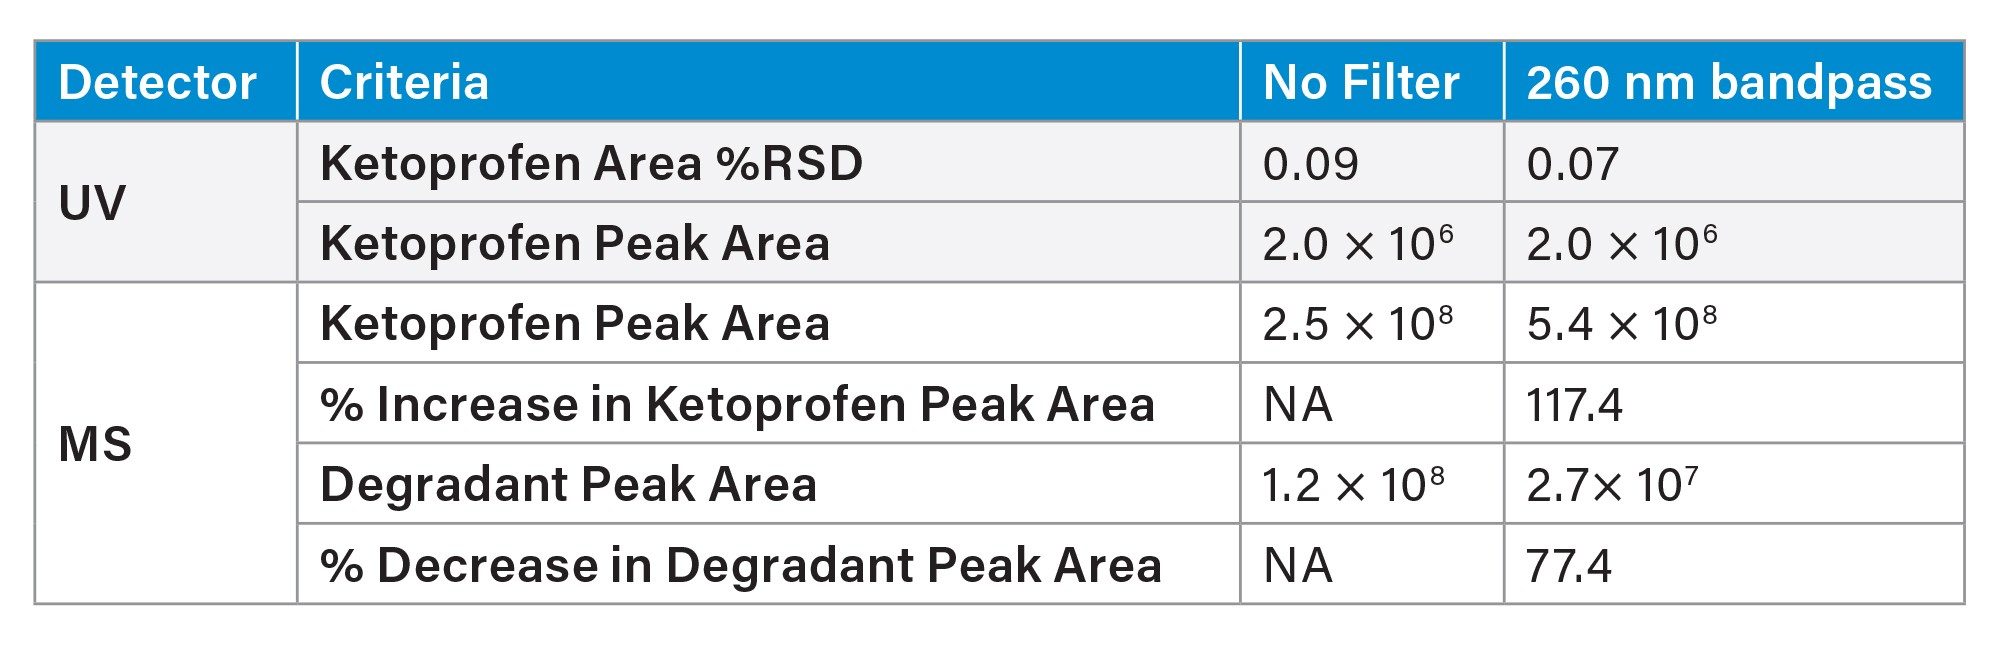
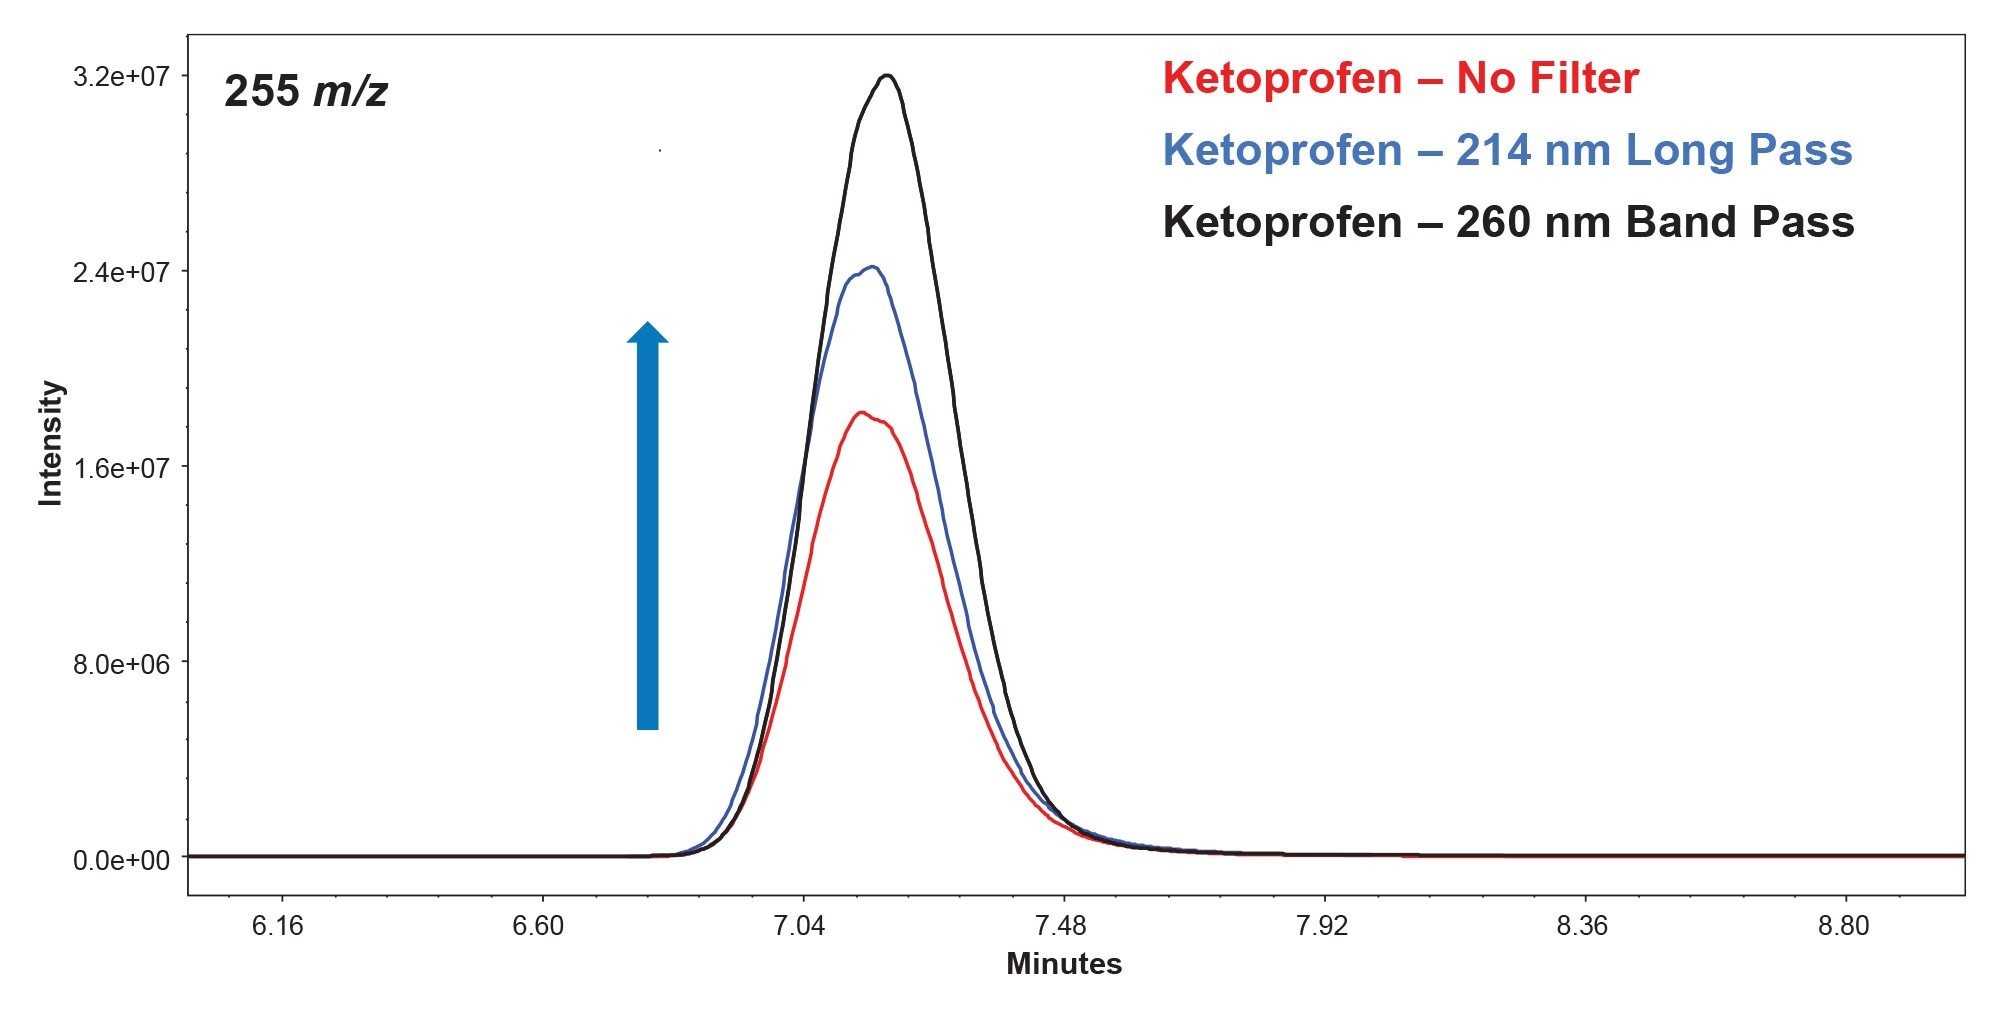
The mass spectra demonstrate the effect of optical filter application on signal intensity. As shown in Figure 5, the 255 m/z spectrum indicates a clear increase in the ketoprofen peak area when filters were employed. The use of a 214 nm long-pass filter resulted in a higher signal compared to the analysis without a filter. Additionally, the application of a 260 nm band-pass filter produced an even greater enhancement in ketoprofen signal relative to the 214 nm long-pass filter.
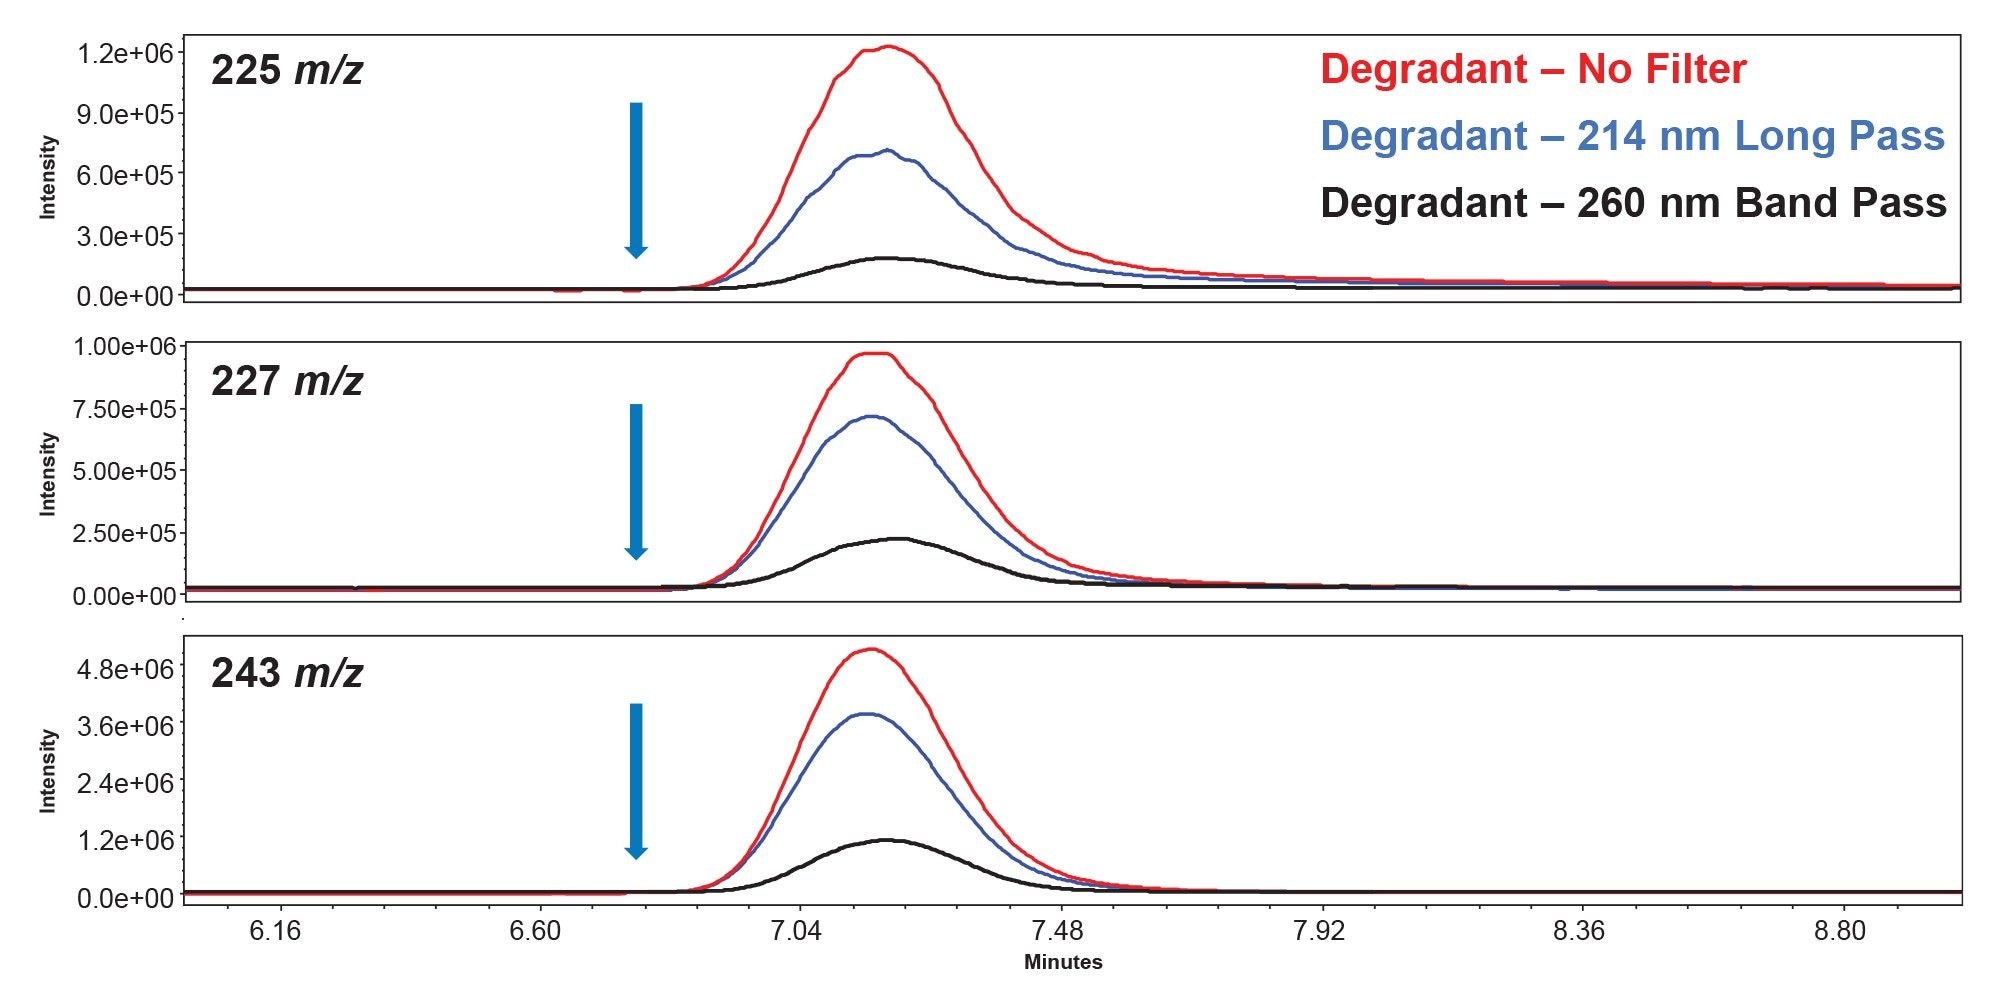
For the ketoprofen degradants, a reduction in signal intensity was observed upon application of optical filters. Figure 6, which presents the spectra at m/z 225, 227, and 243, illustrates this effect. The 214 nm long-pass filter resulted in a decrease in the signal for all three degradants. A more pronounced reduction was observed with the 260 nm band-pass filter, indicating a greater impact on degradant formation.
The difference in effectiveness between the two filters stems from the way each one is designed to function. The 260 nm bandpass filter provides greater protection against degradation because ketoprofen, measured at 256 nm, falls within its ±5 nm transmission window. By restricting light to this narrow range, wavelengths outside the target region are excluded, resulting in reduced photodegradation. In contrast, the 214 nm long-pass filter allows all wavelengths above 214 nm to reach the sample, including those that can contribute to degradation, making it less effective overall.
Conclusion
PDA Detectors offer numerous benefits in laboratory applications; however, their design can negatively affect the analysis of photosensitive compounds. As awareness of this limitation has grown, filters such as those available for the Alliance iS HPLC System with PDA Detector have been developed to reduce sample degradation within the detector’s flow cell. This study demonstrated that using two of the four available filter options during ketoprofen analysis effectively minimized the formation of degradant peaks while increasing the amount of ketoprofen detected. Among the tested filters, the 260 nm band-pass filter provided the greatest reduction in photodegradation compared to the 214 nm long-pass filter. Also, the use of the optical filters did not negatively impact the UV analysis of ketoprofen.
References
- Yousif, E.; Haddad, R. Photodegradation and photostabilization of polymers, especially polystyrene: review. Springerplus. 2013 Aug 23;2:398. doi: 10.1186/2193-1801-2-398. PMID: 25674392; PMCID: PMC4320144
- Schweikart, F.; Hulthe, G. “HPLC−UV−MS Analysis: A Source for Severe Oxidation Artifacts,” Anal. Chem, 2019, 91, 1748-1751
720009460, June 2026