Correlation Between the Adsorption of Acidic Analytes on Stainless Steel Columns and Their Ionic Charge
Kenneth D. Berthelette, Maureen DeLoffi, Christopher Collins, Jamie Kalwood, Thomas H. Walter
Waters Corporation, United States
Published on April 29, 2025
Abstract
Stainless steel is commonly used in both high-performance liquid chromatography (HPLC) columns and systems. The ease of manufacturing coupled with its high-pressure tolerance and generally good chemical resistance makes it well suited for use in this application. However, it has long been known that certain analytes can interact with stainless steel, primarily through ionic interactions of negatively charged analytes with the metal-oxide surface layer. This phenomenon has been shown to occur for a variety of analytes, including nucleic acids, acidic peptides, proteins, and glycans, as well as acidic small molecules. MaxPeak™ High Performance Surfaces (HPS) Technology was developed to mitigate these interactions and has been deployed in both HPLC columns and systems.
To better understand the dependence of adsorption on analyte properties, a variety of acidic compounds were selected and tested using both ACQUITY™ Premier Columns and conventional stainless-steel columns with 0.1% formic acid as the mobile phase modifier. We observed a correlation between the ratios of the peak areas obtained using the two columns and the calculated analyte ionic charges. This indicates the potential for predicting the severity of adsorption on stainless steel columns based on the acid/base chemistry of the analyte.
Benefits
- While the adsorption of acidic analytes on stainless steel surfaces in HPLC columns becomes increasingly severe as their negative charge increases, MaxPeak Premier Columns mitigate this adsorption, resulting in higher peak areas
Introduction
Stainless steel hardware has been shown to cause several issues in HPLC analyses, including adsorption of acidic analytes and iron adduct formation for chelating compounds.1–8 These effects may be mitigated by using ACQUITY Premier Columns and ACQUITY Premier LC Systems, which employ MaxPeak High Performance Surfaces (HPS) Technology.6,7 This hardware modification bonds a hybrid organic-inorganic layer to the metal oxide surface of the stainless steel, blocking interactions with analytes.8
Several studies have been carried out to investigate the mechanism of interaction of analytes with stainless steel surfaces. Nakanishi and coworkers reported that adsorption of acids is greatest below approximately pH 7, where the metal oxide surface on 316 stainless steel is positively charged.9 Work reported by DeLano et al. showed that the extent of adsorption is dependent not only on pH, but also on analyte mass load.8,10 While this work and the others previously cited show the benefits of inert hardware for a range of analytes, there is a need for more information to help predict which compounds will experience adsorption when using stainless steel columns.
The work described here examined nine compounds with different acidic functionalities. The analytes were tested using a MaxPeak Premier Column, as well as a conventional stainless-steel column, both packed with ACQUITY UPLC CSH Phenyl-Hexyl, 1.7 µm particles. The ratios of peak areas for each analyte on the two columns were calculated and correlated with the calculated ionic charge of the analytes. The mobile phases used for this study contained 0.1% formic acid, a commonly used modifier when employing electrospray ionization mass spectrometry detection.
Experimental
Sample Description
Stock solutions of each analyte were created at 1 mg/mL. Working solutions of each analyte were created at 50 µg/mL in water.
LC Conditions
|
LC system: |
ACQUITY Premier BSM System with PDA |
|
Detection: |
UV @ 210 nm |
|
Columns: |
ACQUITY Premier CSH Phenyl-Hexyl, 2.1 x 50 mm, 1.8 µm (p/n: 186009474) ACQUITY UPLC CSH Phenyl-Hexyl, 2.1 x 50 mm, 1.8 µm (p/n: 186005406) |
|
Column temperature: |
30 °C |
|
Sample temperature: |
10 °C |
|
Injection volume: |
Varies by compound |
|
Flow rate: |
0.5 mL/min |
|
Mobile phase A: |
0.1% Formic Acid in Milli-Q Water |
|
Mobile phase B: |
0.1% Formic Acid in Methanol |
|
Gradient conditions: |
Start at 100%A and hold for 2.00 minutes. Linear gradient to 95%B in 6.00 minutes. Hold at 95%B for 1.15 minutes. Return to starting conditions and hold for 1.18 minutes. Total run time: 10.33 minutes. |
MS Conditions
|
MS system: |
Xevo TQ-S micro |
|
Ionization mode: |
ESI Negative Mode |
|
Capillary voltage: |
1.5 kV |
|
Cone voltage: |
20 V |
|
Desolvation temperature: |
350 °C |
|
Desolvation gas flow: |
650 L/hr |
|
Cone gas flow: |
0 L/hr |
|
Detection: |
SIRs |
Data Management
|
Chromatography software: |
Masslynx V4.1 |
Results and Discussion
To mitigate adsorption in the system, an ACQUITY Premier BSM system with a single column heater was used. This system employs the same MaxPeak HPS Technology as ACQUITY Premier Columns. Additionally, periodic injections of a strong ammonium hydroxide solution (0.3% by volume) were performed. These injections have been shown to remove any adsorbed analytes from the system and column.11 Triplicate injections of the ammonium hydroxide solution were performed after each set of injections for an analyte, i.e., every six injections. Subsequently, three injections of Milli-Q water were performed to purge the system of the strong ammonium hydroxide solution.
The stationary phase selected for this study was the CSH Phenyl-Hexyl sorbent. This sorbent has been shown to retain polar acidic analytes by weak anion exchange.12 Two 2.1 x 50 mm columns were packed with the sorbent, one using conventional stainless steel (SS) hardware and the other employing MaxPeak Premier (MP) Column hardware.
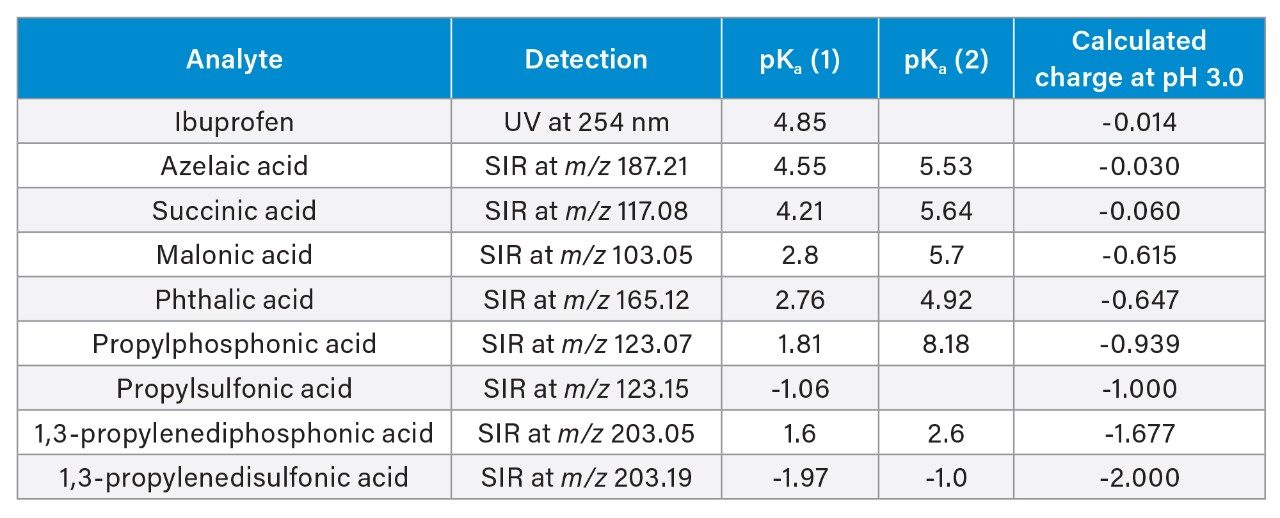
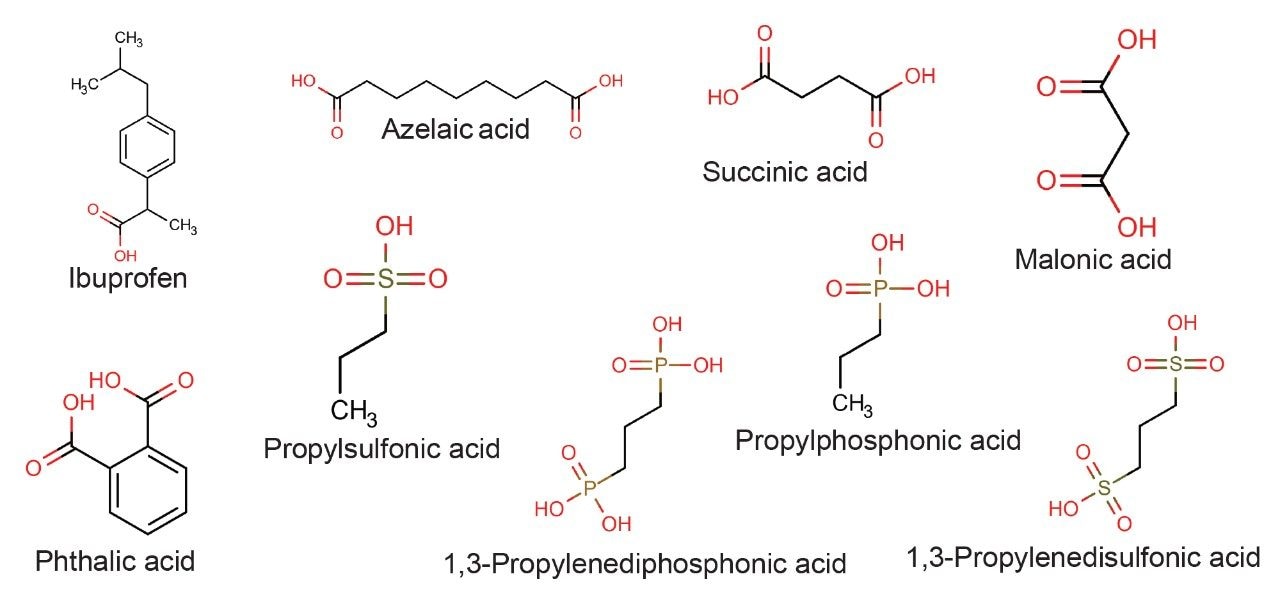
The acidic probes were selected based on chemical structure, particularly the number and type of acidic moieties. Table 1 lists the compounds selected, the detection method used, their pKa values and the calculated ionic charge at pH 3.0. The structures of the compounds are shown in Figure 1. Each compound was injected at three different mass loads: 50, 125, and 250 ng on column.
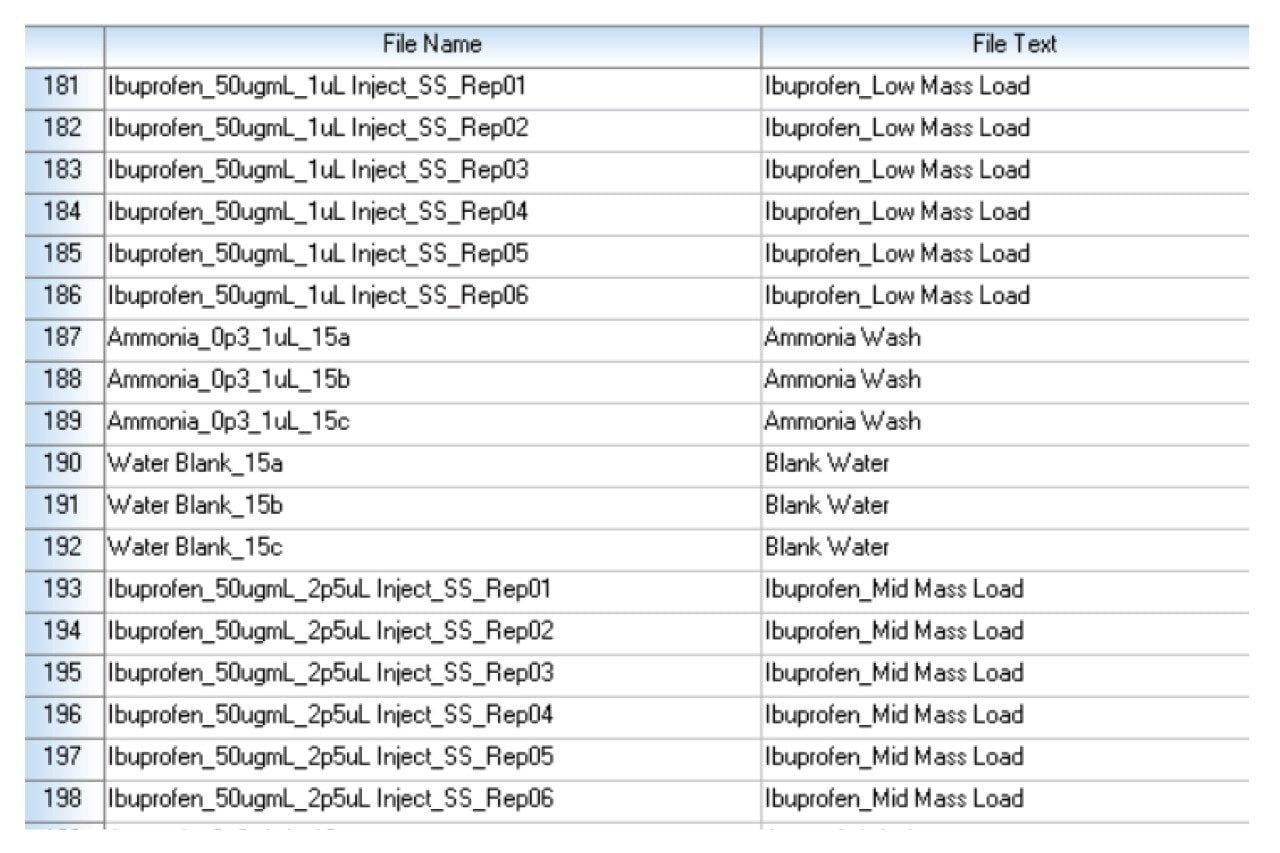
Each analyte was injected in six replicates at each mass load, starting with the low mass load. The testing sequence is shown in Figure 2 to illustrate the sequence of injections performed on both the SS and MP columns. The MP column injections were performed first, then the SS column was installed and the testing repeated. The average peak areas for the six replicates were calculated, along with the standard deviations. The ratios of peak areas obtained on the two columns were calculated for each analyte and mass load using these average values. Table 2 shows the resulting peak area ratios and standard deviations calculated from the square root of the squares of the relative standard deviations for the individual peak areas.
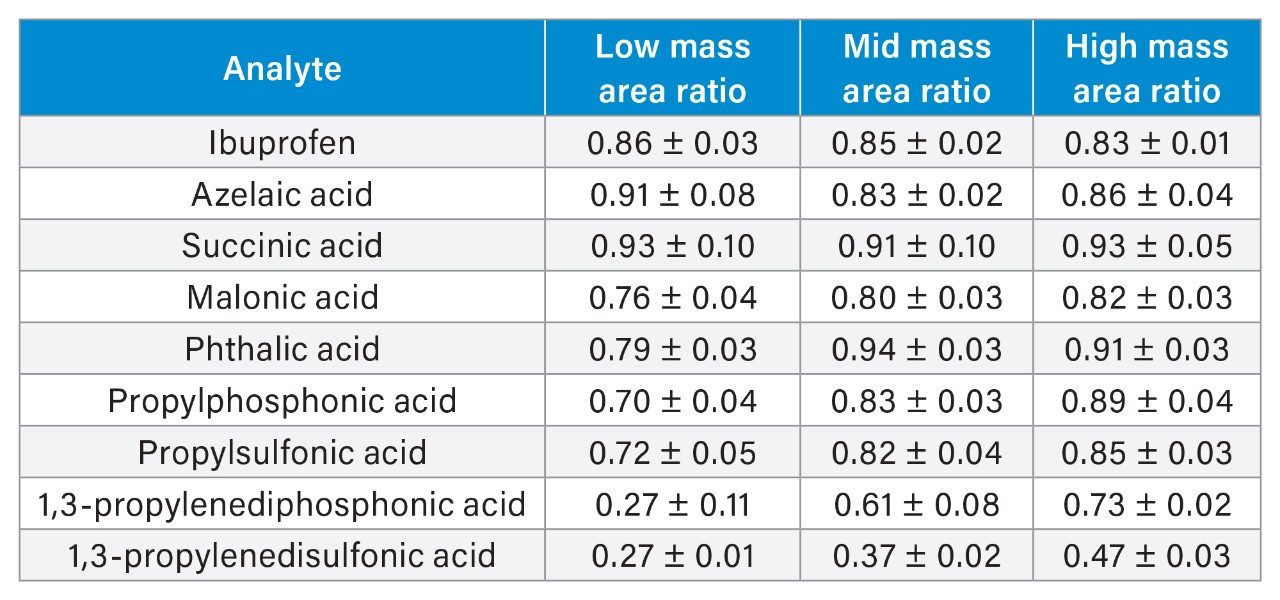
Several immediate trends can be detected when examining the data. First, all of the peak area ratios are less than 1, indicating that lower peak areas were observed for all of the compounds when using the stainless-steel column. Also, by comparing the results across the different mass loads, it is confirmed that the peak area ratios are generally lower at lower mass loads. This phenomenon has been previously reported.6–10 Additionally, in examining the low mass load peak area ratios of propylphosphonic acid to that of 1,3-propylenediphosphonic acid, the latter has lower values. This was also expected as the more acidic functional groups present in a molecule, the more strongly it adsorbs on the metal hardware of the column.
Another observation, which can be seen in comparing the results for the sulfonic acids to those for the phosphonic acids, is that for the compounds with one acidic moiety, the peak area ratios are comparable, within 5% at each mass load. However, for the compounds with two acidic moieties, the sulfonic acid shows considerably lower peak area ratios at the higher mass loads. Even at the high mass load, 1,3-propylenedisulfonic acid has a peak area ratio of 0.47, while the diphosphonic acid has a peak area ratio of 0.73.
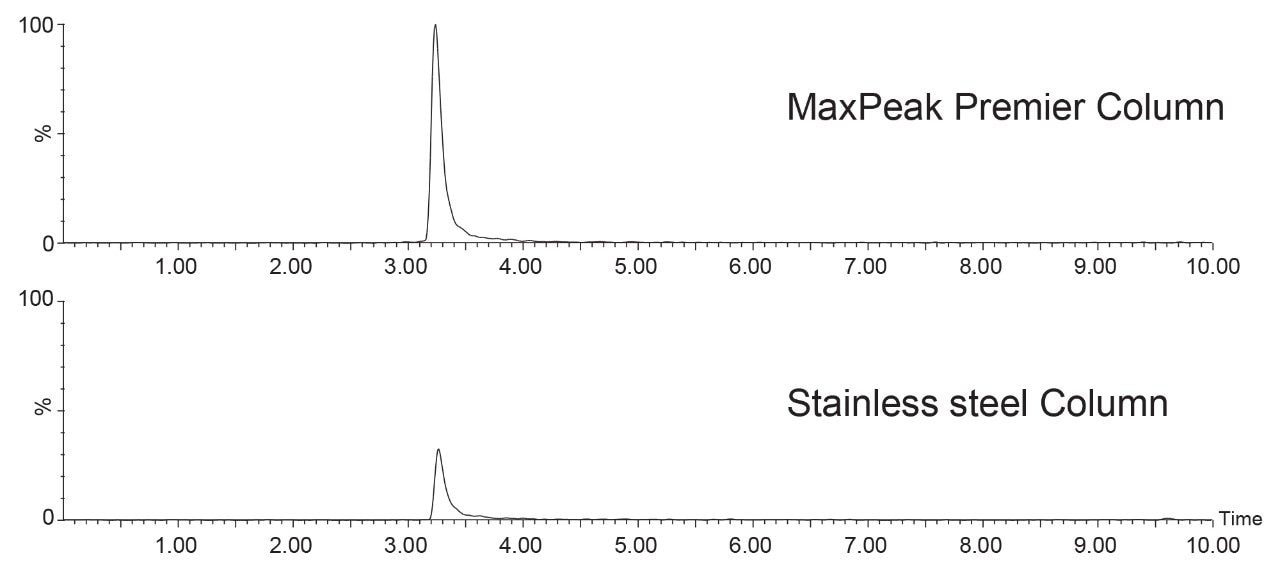
The compounds containing carboxylic acid groups, either one or two, have varying peak area ratios. Succinic acid, for instance, has area ratios of 0.93, 0.91, and 0.93 across the three mass loads. Meanwhile, malonic acid only achieves area ratios of 0.76, 0.80, and 0.82 across the mass loads tested. This indicates that, for compounds with carboxylic acid groups, accurately predicting whether the compound will adsorb is not as straightforward as looking at the chemical structure. Example chromatograms of an analyte obtained using both a MaxPeak Premier Column and a stainless-steel column are shown in Figure 3.
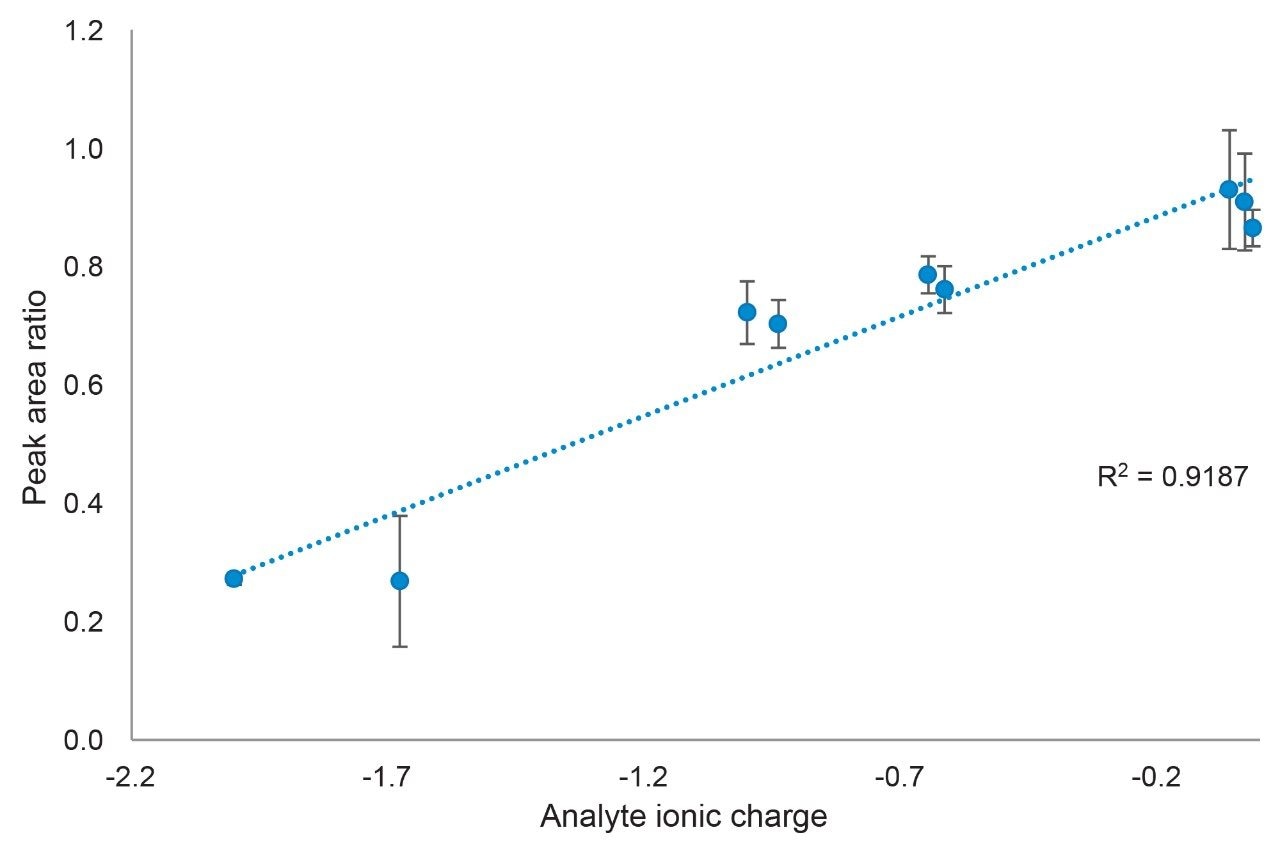
These observations can be explained by considering the calculated ionic charge of the analytes. Shown in Figure 4 is a plot of peak area ratio as a function of analyte ionic charge for the low mass load injections. A definite trend is observed, showing that analytes with a more negative charge have lower peak area ratios, with an R2 value of 0.9187. The relationship may not actually be linear, but additional data at greater negative ionic charges would be needed to check for non-linearity. This correlation becomes weaker as the mass load is increased with the mid and high mass load plots having R2 values of 0.8174 and 0.6746, respectively.
Conclusion
The interaction of acidic analytes with stainless steel components in an HPLC system and column can lead to several deleterious effects. First, and most dramatic, is the adsorption of these analytes to the metal surfaces, leading to low peak areas and poor peak shapes. To better understand the dependence of adsorption on analyte properties, nine compounds with varying chemical properties were analyzed using a conventional stainless-steel column and a MaxPeak Premier Column packed with the same sorbent. Plots of peak area ratios versus calculated analyte ionic charge show that the more negatively charged an analyte, the more adsorption occurs on the stainless-steel column, leading to lower peak areas. MaxPeak Premier Columns and Systems are effective at mitigating these interactions, providing higher peak areas and improved peak shapes.
References
- Reed C, Hong P, Wong N, Birdsall R, Improving Peptide Mapping Separations Containing Phosphopeptides Using MaxPeak Premier Column Technology on an ACQUITY Premier System. Waters Application Note. 720008136, December 2023.
- Berthelette K, Aiello M, Collins C, Kalwood J, Walter TH, Analysis of Radioligand Therapy Components Using Reversed-Phase and HILIC Columns. Waters Application Note. 720008710, February 2025.
- Smith K, Wilson I, Rainville P, Sensitive and Reproducible Mass Spectrometry-Compatible RP-UHPLC Analysis of Tricarboxylic Acid Cycle and Related Metabolites in Biological Fluids: Application to Human Urine. Anal. Chem. 93 (2021), 1009–1015.
- Isaac G, Wilson I, Plumb R, Application of Hybrid Surface Technology for Improving Sensitivity and Peak Shape of Phosphorylated Lipids Such as Phosphatidic Acid and Phosphatidylserine. J. Chrom. A. 1669 (2022) 462921.
- Boissel C, Walter TH, Shiner SJ, ACQUITY Premier Solution Improves the UPLC-MS Analysis of Deferoxamine-an Iron Chelating Drug. Waters Application Note. 720007239, April 2021.
- Lauber M, Walter TH, Gilar M, DeLano M, Boissel C, Smith K, Birdsall R, Rainville P, Belanger J, Wyndham K, Low Adsorption HPLC Columns Based on MaxPeak High Performance Surfaces (HPS). Waters White Paper 720006930, June 2021.
- Walter TH, Trudeau M, Simeone J, Rainville P, Patel AV, Lauber M, Kellett J, DeLano M, Brennan K, Boissel C, Birdsall R, Berthelette K, Low Adsorption UPLC Systems and Columns Based on MaxPeak High Performance Surfaces: The ACQUITY Premier Solution. Waters White Paper 720007128, May 2021.
- DeLano M, Walter TH, Lauber MA, Gilar M, Jung MC, Nguyen JM, Boissel C, Patel AV, Bates-Harrison A, Wyndham KD, Using Hybrid Organic-Inorganic Surface Technology to Mitigate Analyte Interactions With Metal Surfaces in UHPLC, Anal. Chem. 93 (2021) 5773–5781. doi: 10.1021/acs.analchem.0c05203.
- Nagayasu T, Yoshioka C, Imamura K, Nakanishi K, Effects of Carboxyl Groups on the Adsorption Behavior of Low-Molecular-Weight Substances on a Stainless Steel Surface. J. Colloid Interface Sci. 279 (2004) 296–306.
- Gilar M, DeLano M, Gritti F, Mitigation of Analyte Loss on Metal Surfaces in Liquid Chromatography. J. Chrom. A, 1650 (2021) 462247. https://doi.org/10.1016/j.chroma.2021.462247.
- Simeone J, Patel AV, DeLano M, Shiner SJ, Hoyes E, Tracey F, Lauber MA, Optimizing Test Approaches for the Detection of Exposed Metal Surfaces Within a Chromatographic Flow Path, J. Chrom. A, 1666 (2022) 462855. https://doi.org/10.1016/j.chroma.2022.462855.
- Smith K, Rainville P. Improved Analytical Sensitivity and Chromatographic Peak Shape for the Quantification of TCA Cycle Analytes in Human Plasma using the ACQUITY Premier System Solution. Waters Application Note. 720007107. December 2020
720008792, April 2025