Streamlining Impurity Analysis in Atorvastatin with the ACQUITY™ QDa™ II Mass Detector for Enhanced Detection and Quantification
Abstract
- Demonstrate the practical application of the QDa II Mass Detector to complement UV chromatographic workflows for routine analysis of atorvastatin API impurities
- Assess the suitability of an analytical workflow for determining selected impurities at qualification thresholds of ≤0.15% as per ICH-Q3 guidelines
- Underline the benefits of in-source fragmentation to gain deeper insights into the structural characteristics of unknown compounds
- Highlight the user-friendly features and advantages of the Empower™ Chromatography Data System (CDS) for compliant impurity testing in a regulated pharmaceutical environment
Introduction
Atorvastatin is one of the most widely prescribed medications globally for managing conditions such as hypercholesterolemia and reducing the risk of cardiovascular events. Efficacy in lowering LDL cholesterol levels has made it a prominent drug supplied to millions of patients worldwide. However, the presence of impurities in the pharmaceutical formulation of the drug can pose a significant concern for patient safety. These impurities can originate during the synthesis process of the active substance, or as degradation products under certain environmental conditions, and may possess toxicological or pharmacological properties that could compromise the safety and efficacy of the final drug product.
Atorvastatin is typically administered as the calcium salt of the active hydroxyl acid, in doses of between 10–80 mg per day.1 According to ICH-Q3 guidelines, drugs consumed with a maximum daily dosage of less than 2.0 g per day should have a qualification threshold for impurities of 0.15%.2
According to the European Pharmacopoeia monograph for atorvastatin as an active substance, the following limits are prescribed for its impurities: 0.3% for related impurity A and B; 0.15% for Impurity C and D; and 0.1% for other unspecified impurities.3
Traditional methods for impurity testing, namely chromatographic techniques coupled with UV detection, serve as the cornerstone for quality control (QC) in pharmaceutical analysis. Supplementing this workflow with mass detection enables confident and rapid identification, characterization, and quantification of impurities. Moreover, mass detection can provide a greater scope to analysis with additional molecular weight information that aids in impurity identification, even at very low limits of detection.
In this application, we aim to demonstrate the suitability of mass detection for fast, accurate, identification and quantification of atorvastatin API-related impurities. Additionally, we aim to characterize impurities through in-source fragmentation, employing a pseudo-MS/MS approach, thereby presenting a comprehensive solution for impurity analysis.
Experimental
Commercially available samples of atorvastatin calcium salt and three related impurities (impurity A, C, and I), were purchased from Sigma Aldrich and stored at 4 °C until analysis. Samples were dissolved in methanol (MeOH), and serially diluted with a solvent mixture of 40:60 H2O:MeCN for analysis.
LC-MS Experimental Conditions
|
LC system: |
ACQUITY UPLC™ H-Class System with FTN-R Sample Manager |
|
Detection: |
ACQUITY QDa II Mass Detector |
|
UV system: |
Photo diode array (PDA) Detector |
|
Column: |
ACQUITY UPLC CSH™ Phenyl-Hexyl column, 1.7 µm, 2.1 mm x 100 mm (p/n: 186005407) |
|
Column temperature: |
30 °C |
|
Sample temperature: |
10 °C |
|
Injection volume: |
2 µL |
|
Flow rate: |
0.4 mL/min |
|
Run time: |
27.5 min |
|
Mobile phase A: |
10 mM Ammonium acetate in H2O |
|
Mobile phase B: |
Acetonitrile with 0.1% Formic acid |
|
Vials: |
Clear glass 12 x 32 mm screw neck vial (186000273) |
|
Ionization: |
Positive Electrospray (ES+) |
|
Capillary voltage: |
1.1 kV |
|
Desolvation temperature: |
600 °C |
|
Source temperature: |
120 °C |
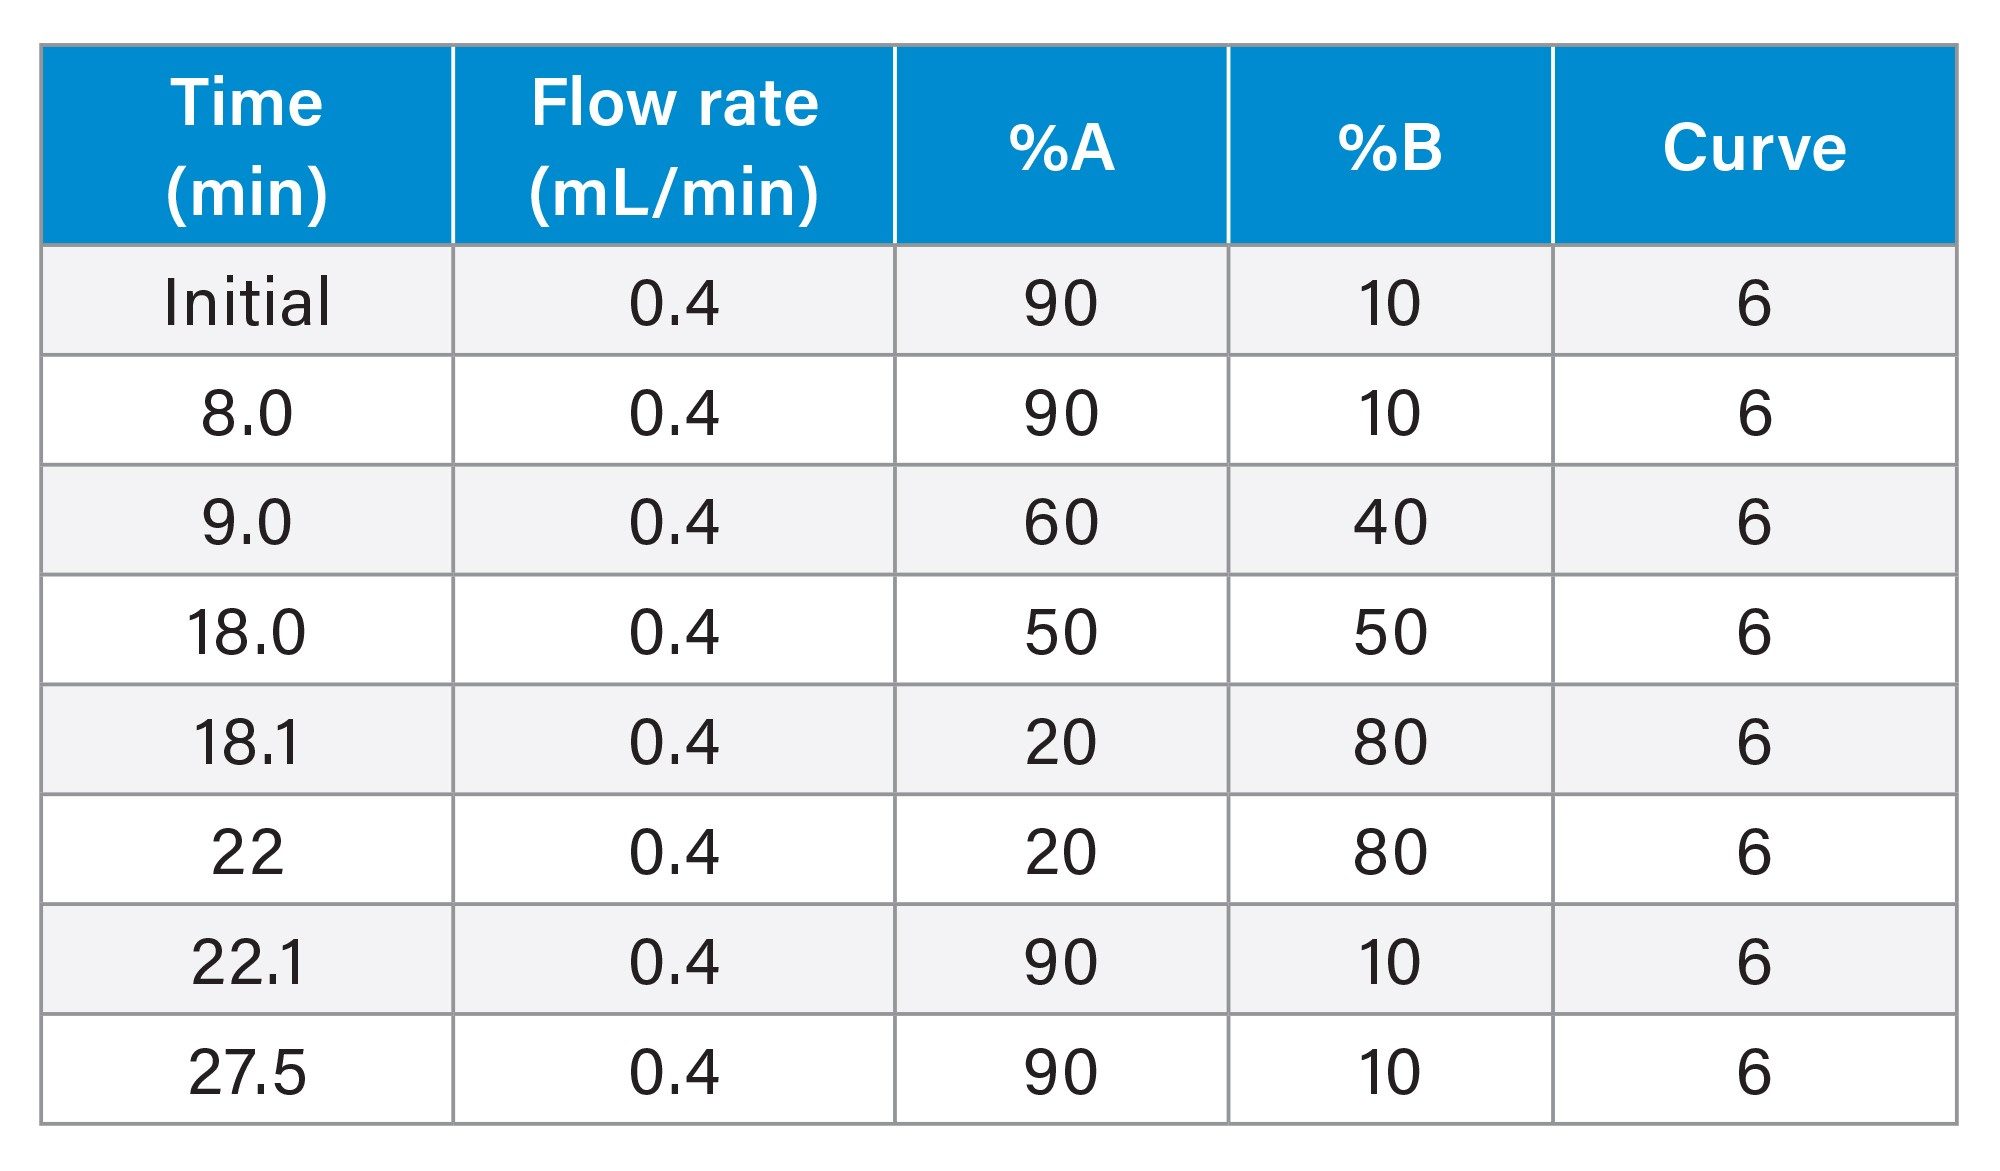
LC Gradient
Software
|
Data acquisition, processing, and reporting: |
Empower CDS 3.0 |
Results and Discussion
Method Development
Unlike the method prescribed by the European Pharmacopoeia monograph, the analytical method presented in this application was developed without the use of tetrahydrofuran (THF) as a part of the mobile phase, which was avoided due to its toxicity and instability.4 Instead, an ammonium acetate buffer was added to the aqueous mobile phase, and formic acid was added to the organic mobile phase, as a means to reduce pH across the sample run and improve peak shape. Several LC columns and mobile phase compositions were also tested, including optimization of the mobile phase to a pH of 4.0–4.2, which did not increase the resolution of chromatographic peaks when compared to the final method.5 Ultimately, the stated method is approximately 60 minutes shorter than the European Pharmacopoeia monograph method and uses less than 10% of the solvent volume per injection.
The method was optimised using a 1 µg/mL mix of atorvastatin and selected impurities (A, C, and I). Cone voltage, capillary voltage, and desolvation temperature were all optimized. Despite most literature methods opting for a C18 column, the CSH Phenyl-Hexyl column proved optimal for improving separation between the atorvastatin compound and related impurity C. A column temperature of 30 °C was optimal to reduce peak tailing of the API.
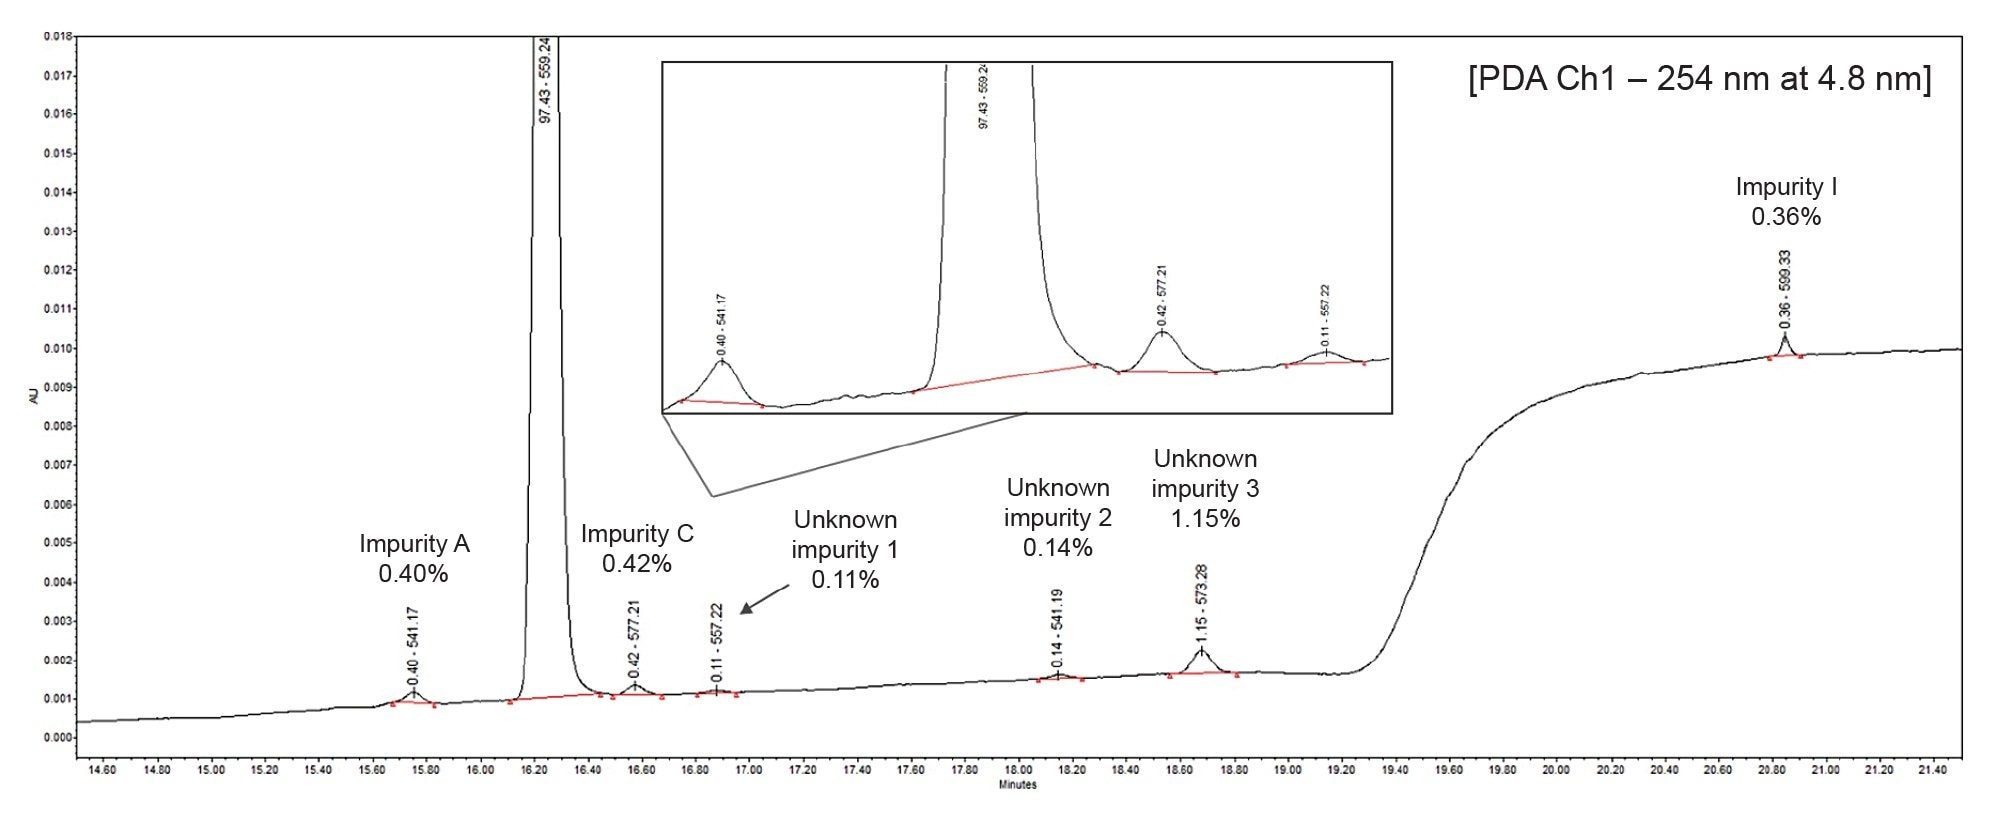
Initially, a 25 µg/mL sample of atorvastatin was spiked with the selected impurities to assess method performance, with concentrations ranging from 0.36–0.42% relative to the API. Three unknown impurities, labelled as Unknown Impurity 1, 2, and 3 in Figure 1, were also quantified in the PDA trace-at 0.11, 0.14, and 1.15% respectively-relative to the API.
Linearity
To assess linearity, a serial dilution was performed for both the API and an impurity mix standard (containing impurities A, C, and I). All calibration curves were acquired using the stated method, which had a total run time of 27.5 minutes.
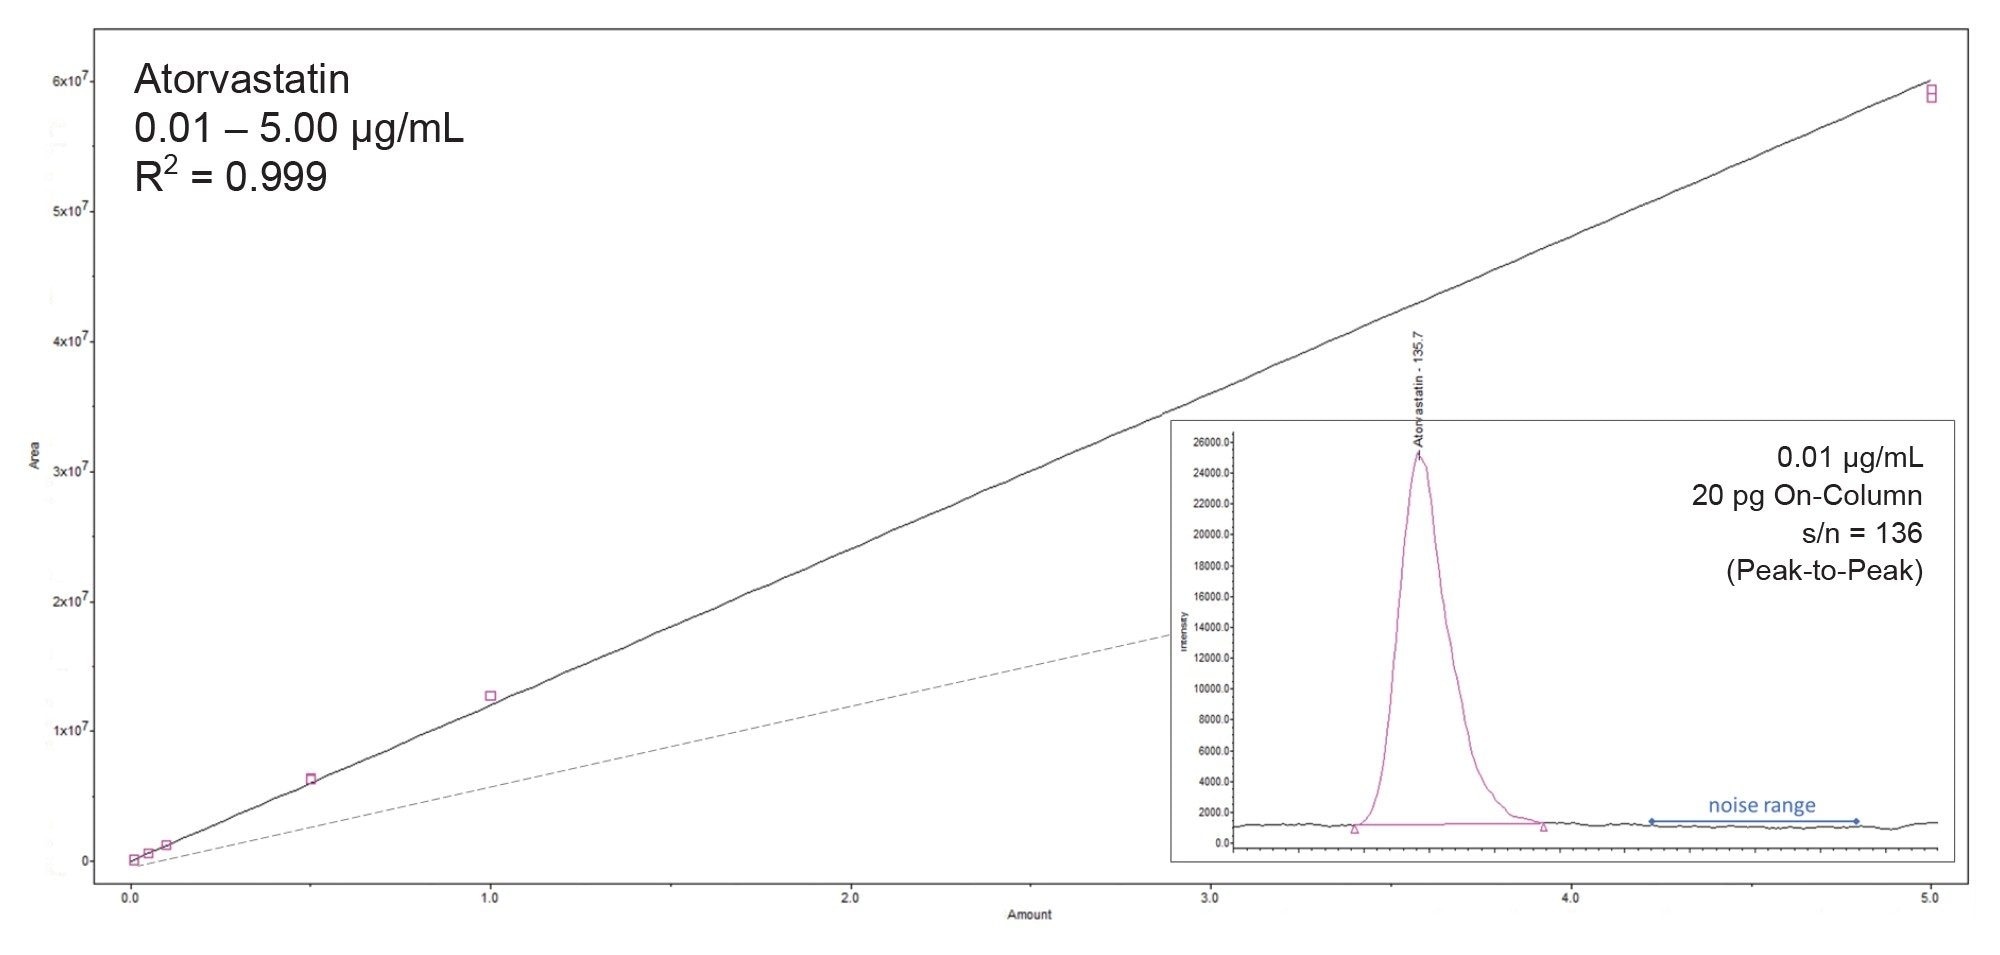
A bracketed calibration plot of atorvastatin is shown in Figure 2.
- The compound was found to be linear (1/X weighted) from 0.01–5.0 µg/mL with an R2 value of 0.999
- The percentage of the observed values (% residuals) for bracketed calibration curves were < 15.4% in all cases
- The peak of the lowest calibration point (0.01 µg/mL), equivalent to 20 pg on-column, had a signal-to-noise ratio of 136 (peak to peak)
Selected atorvastatin related impurities were also assessed for linearity and sensitivity (Table 1). R2 values in all cases exceeded 0.998, with % residuals values of <16.3% in all cases. All calibration responses were linear (1/X weighted).
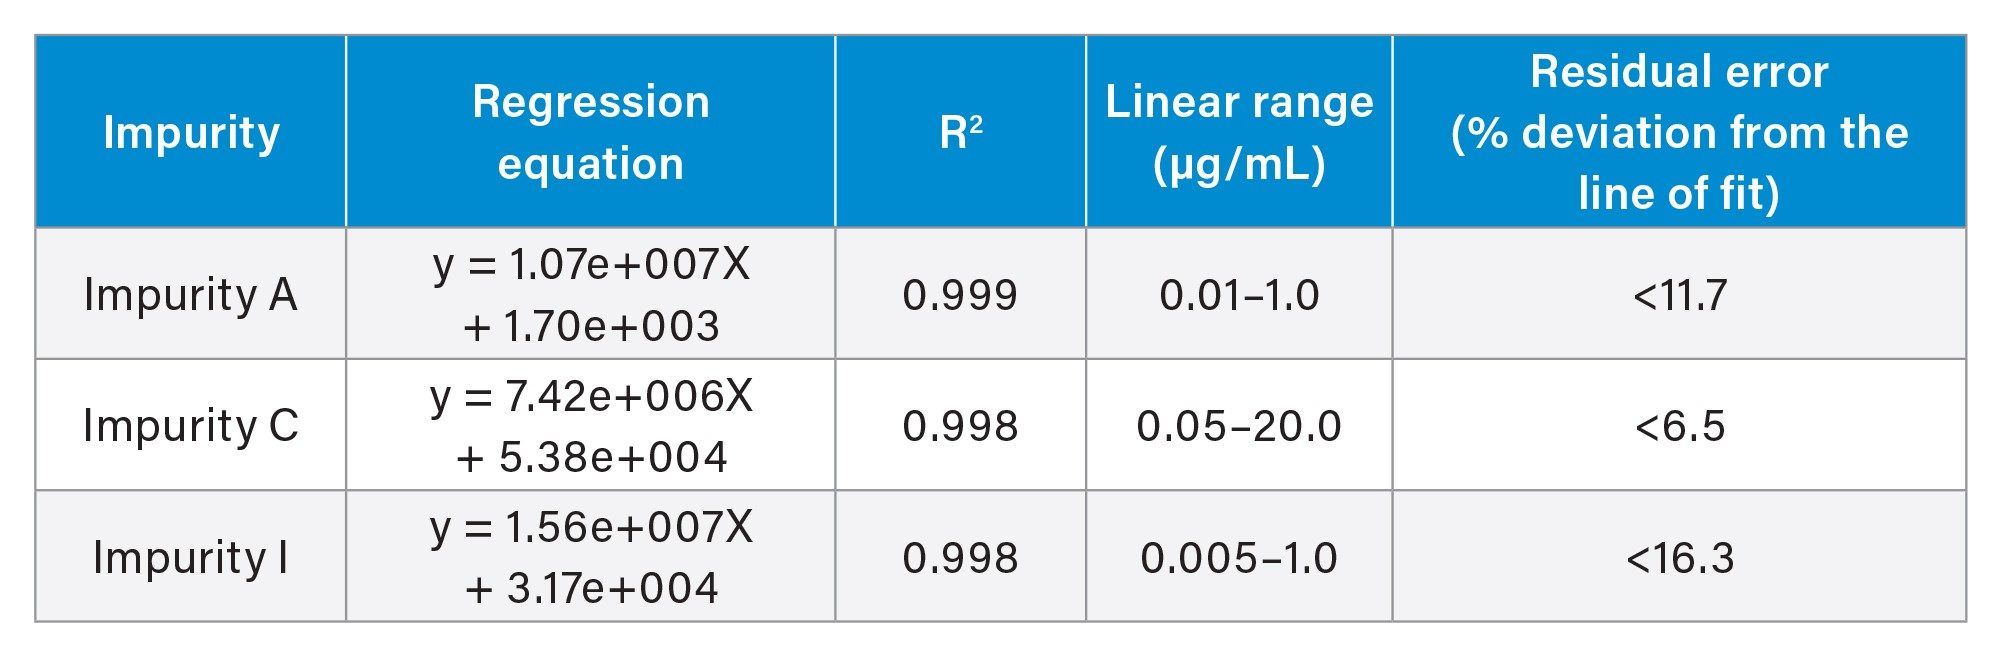
An example calibration plot for impurity A can be seen in Figure 3. The method showed no carryover in any of the subsequent blank injections across the analysis, despite the high concentrations of API injected. This was true for all injections of the atorvastatin API up to and including a concentration of 75 µg/mL.

Quantification of Atorvastatin Impurities at 0.15% Threshold
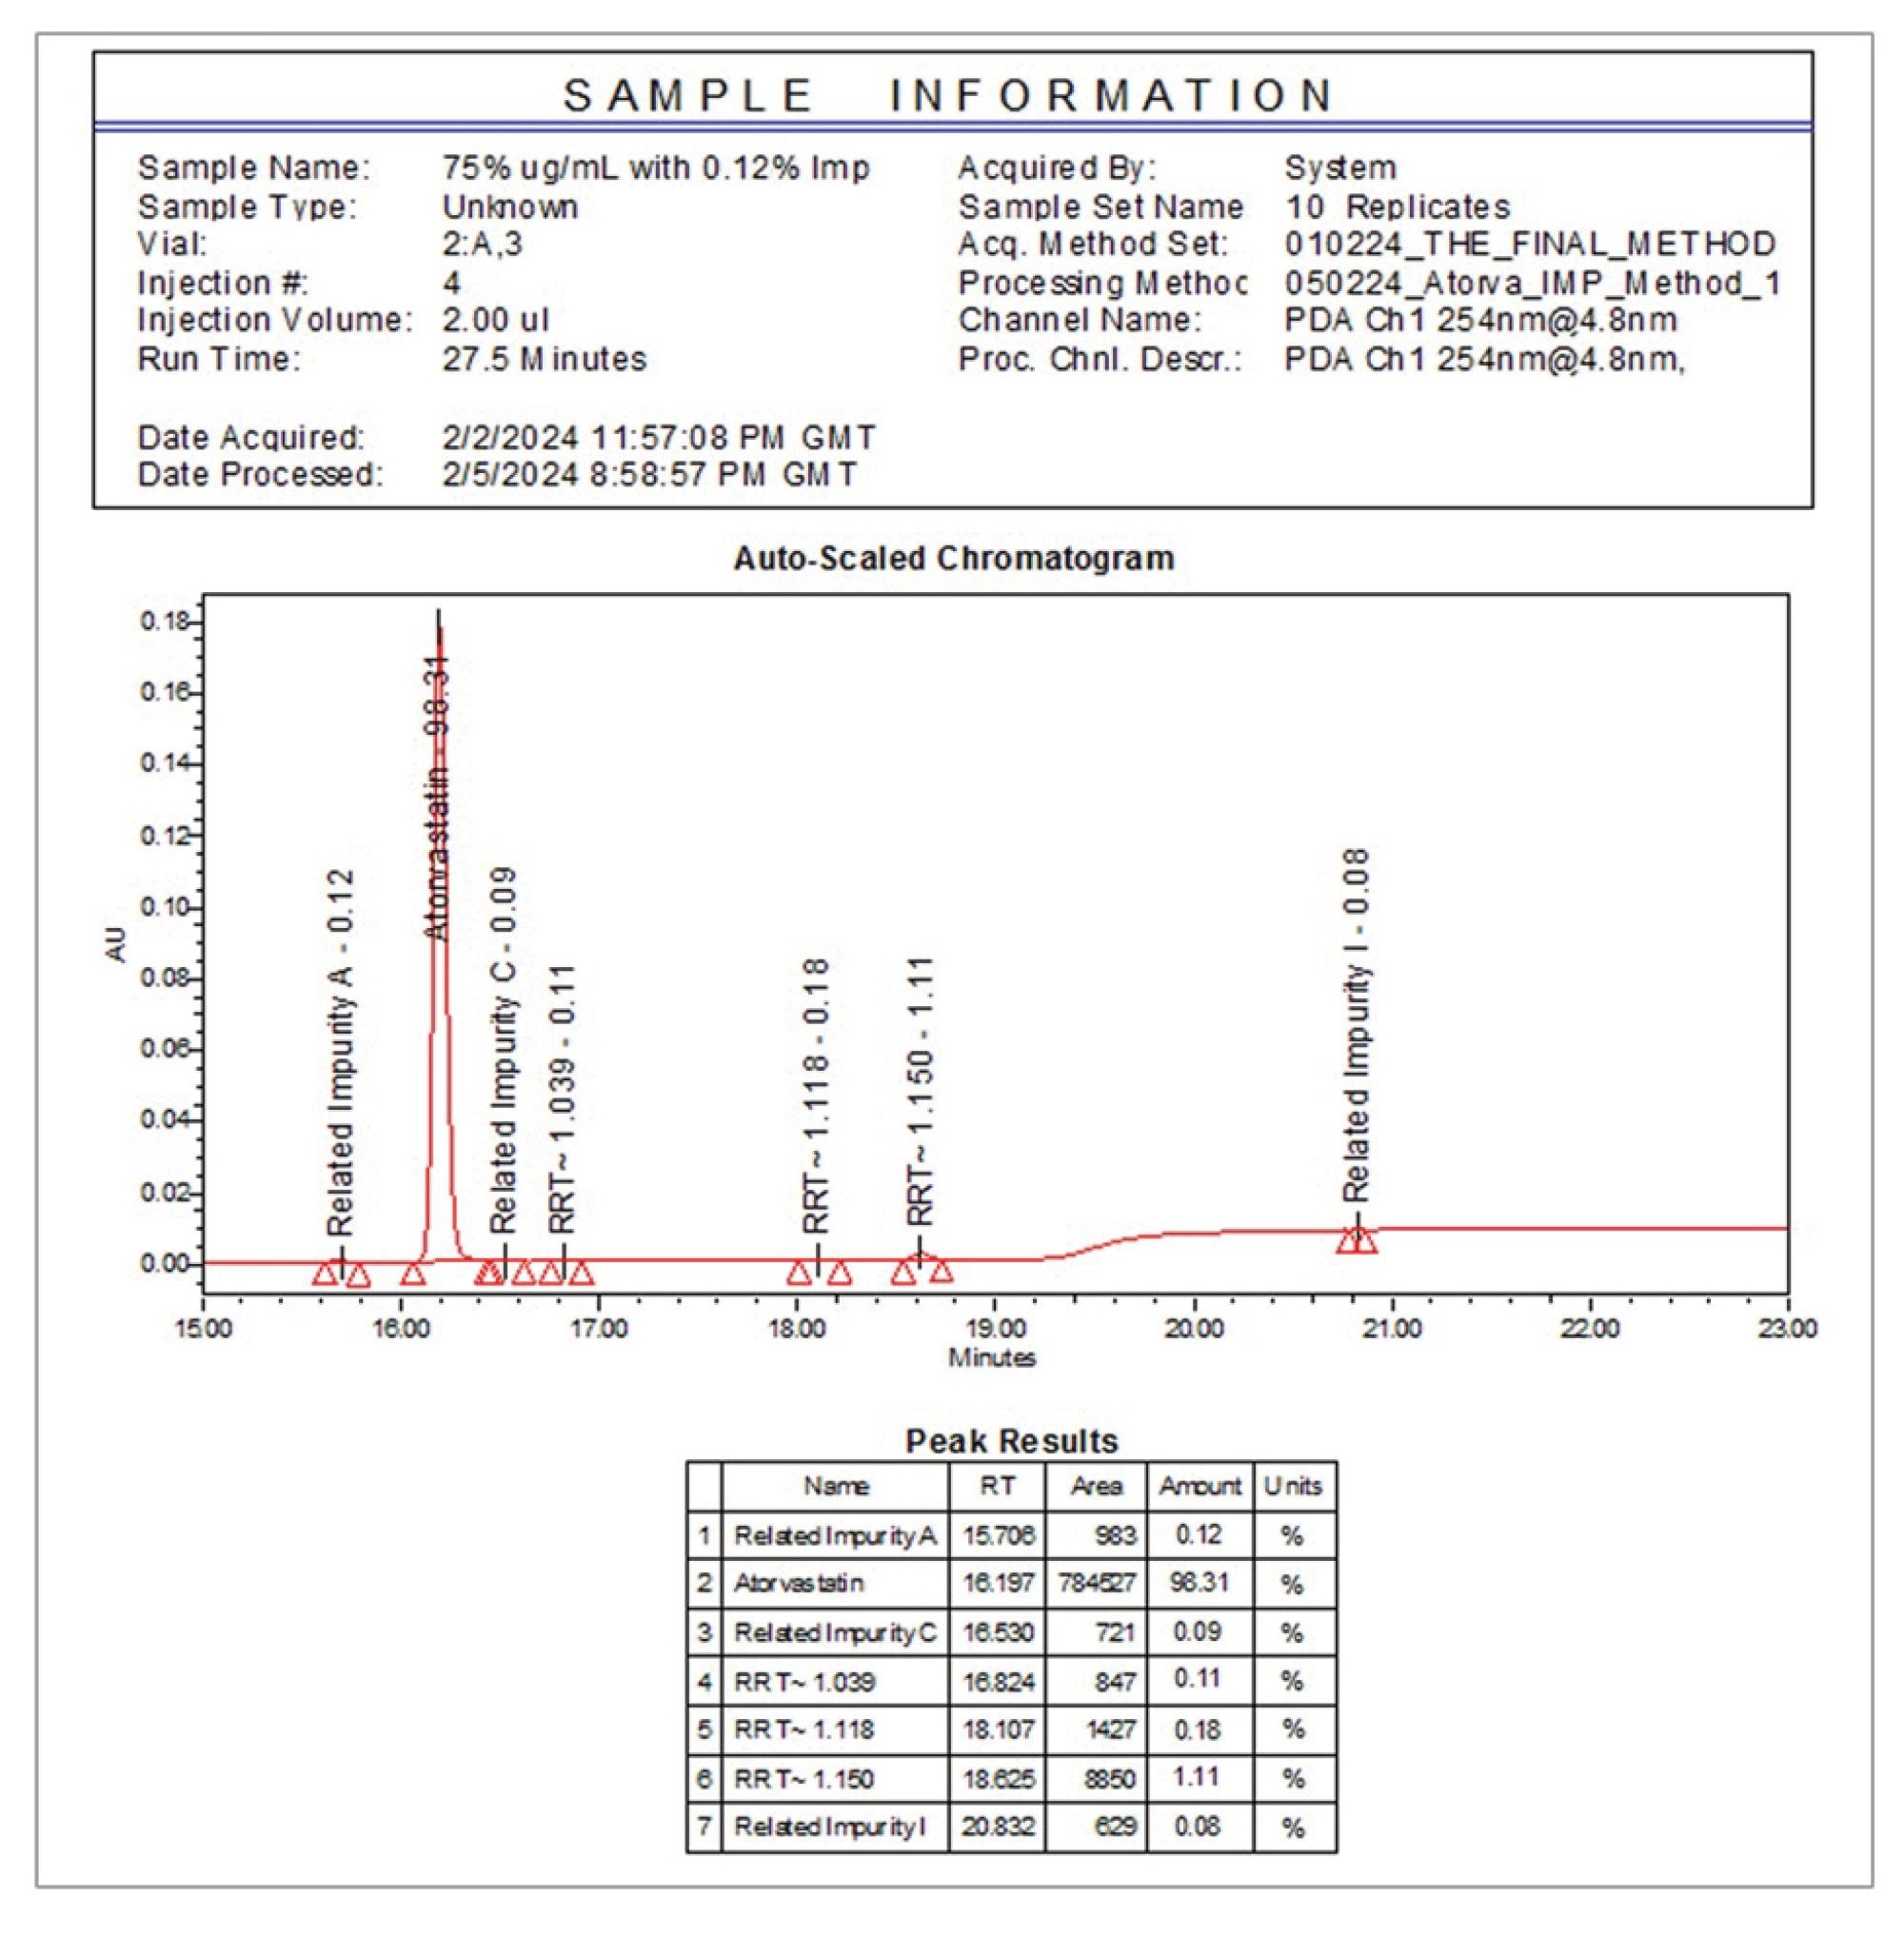
After assessing the sensitivity of the QDa II Mass Detector for the related impurities, an evaluation was made to spike a 75 µg/mL atorvastatin sample with 0.12% of an impurity mix (A, C, I) - with each impurity present at 0.09 µg/mL. For simplicity, this sample will be referred to as 0.12% Threshold Sample from hereon. Compounds were analysed using both UV and mass detection using scan mode. An example UV and associated MS TIC chromatogram for this sample are shown in Figure 4.
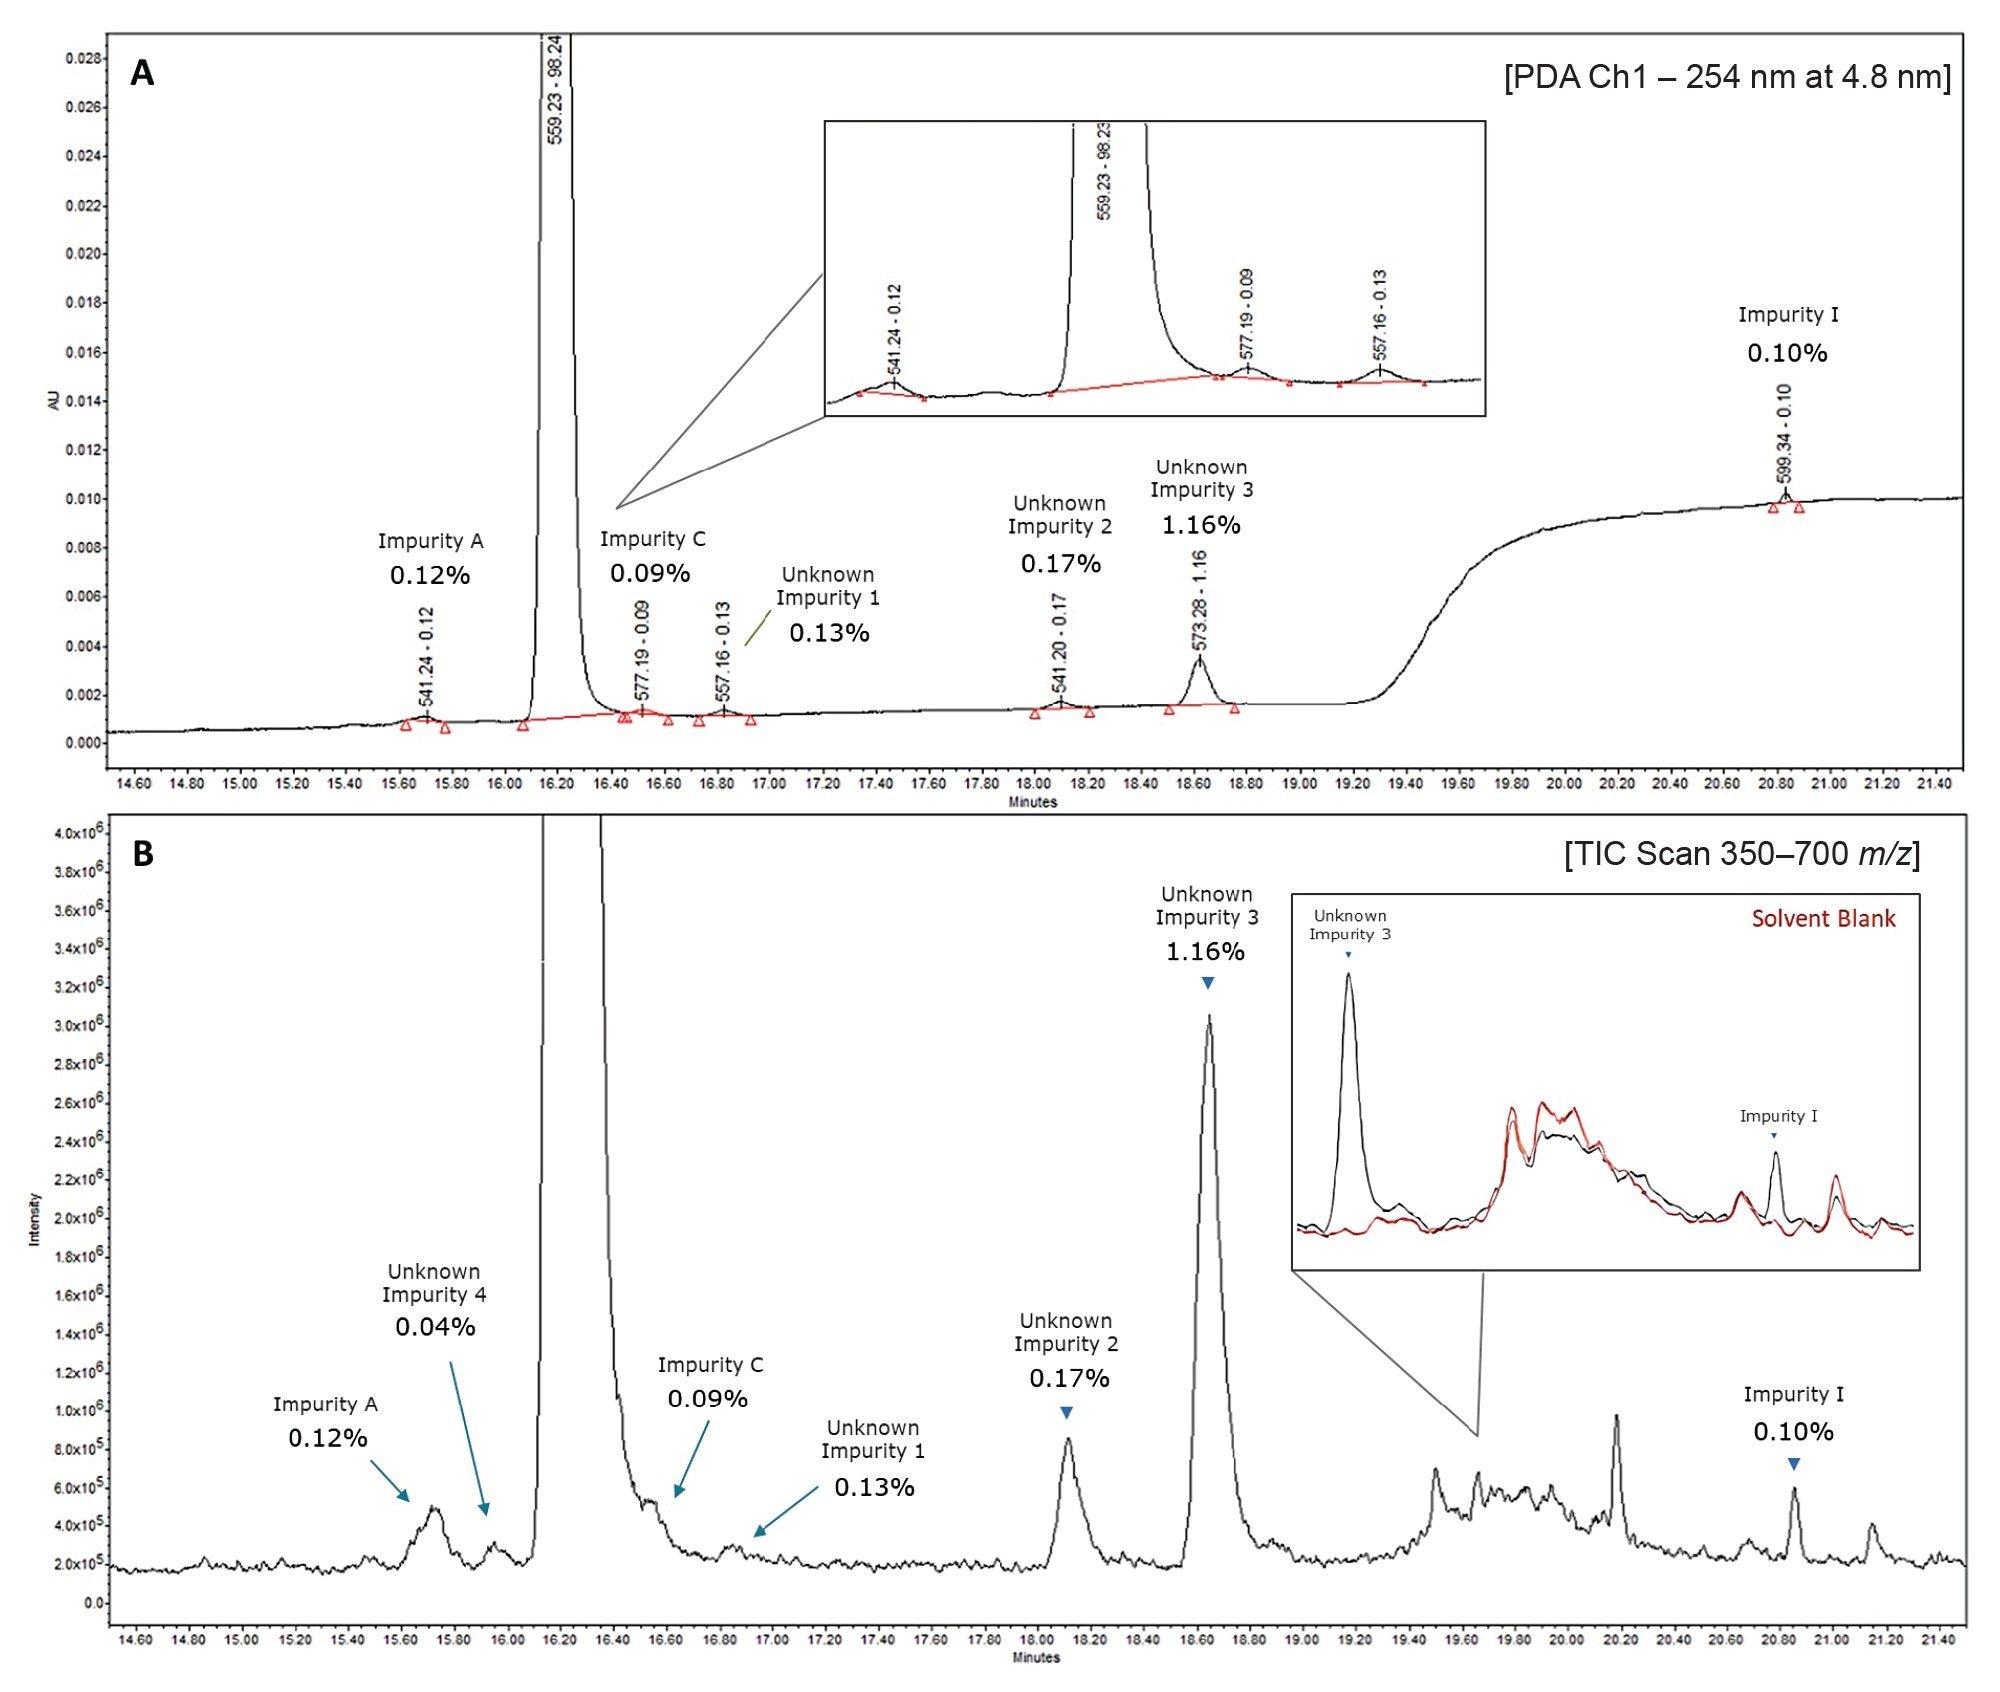
In the PDA trace in Figure 4A, three unknown peaks can be seen at 0.13%, 0.17%, and 1.16% respectively, relative concentrations comparable to those in the 25 µg/mL sample shown in Figure 1. The corresponding MS TIC chromatogram in Figure 4B shows the presence of an additional unknown impurity, Unknown Impurity 4, with more clarity.
Seen also in Figure 4B is an overlay of a solvent blank sample acquired during the same analysis, demonstrating that unlabelled peaks in the MS TIC chromatogram of Figure 4B are not exclusive to the API sample.
To assess the repeatability of this method, 10 replicate injections of the 0.12% Threshold Sample were performed. The results of this can be seen in Table 2. The %RSD for the area of each impurity was < 9% in all cases, with the exception of related impurity A which had a %RSD of 13.4% over the 10 injections.
![Relative %Area of quantified peaks in [254 nm, 4.8 mm] PDA trace of 75 µg/mL atorvastatin sample, spiked with 0.12% of impurities A, C and I, over n=10 consecutive replicates](/content/dam/waters/en/app-notes/2024/720008282/720008282en-t2.jpg.82.resize/img.jpg)
Impurities A and C can be seen more clearly in the MS TIC chromatogram with the use of a divert valve, which acts to automatically divert flow to waste during a stated time period. An example of this feature in use can be seen in Figure 5, where the flow is diverted from 16.08 to 16.47 mins (RT interval of atorvastatin API elution).
![MS TIC Chromatogram showing the use of the divert valve, directing flow to waste as the API elutes, allowing for easier quantification of impurity A [m/z 541.1] and impurity C [m/z 557.1]](/content/dam/waters/en/app-notes/2024/720008282/720008282en-f5.jpg.82.resize/img.jpg)
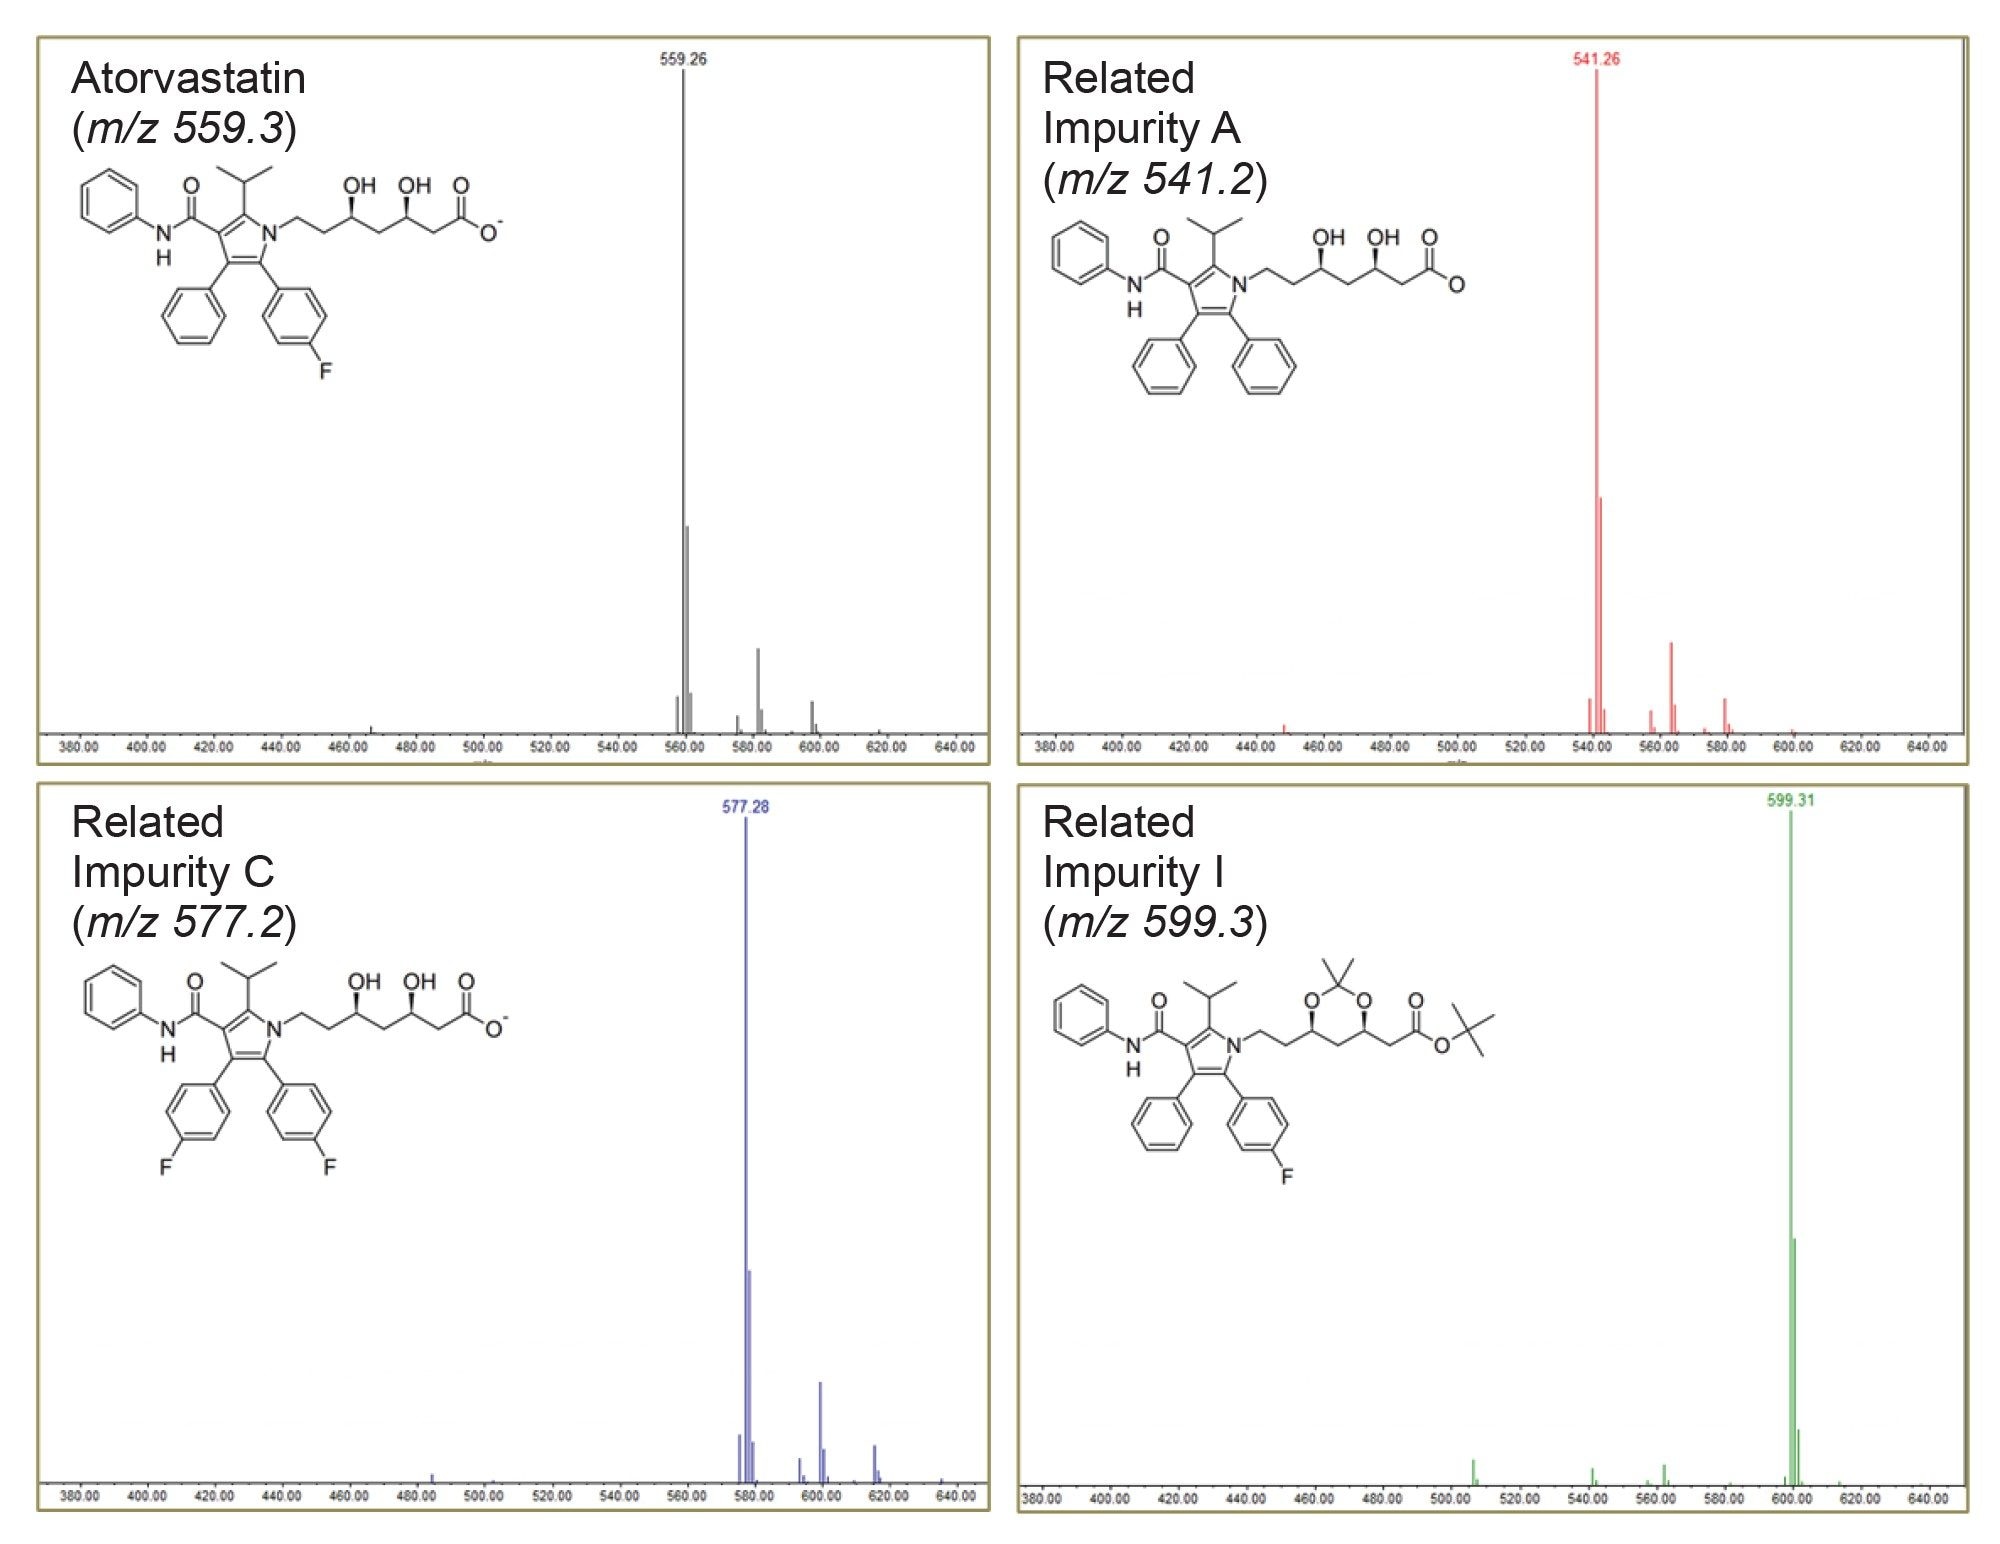
Using the ACQUITY QDa II, mass spectra for each peak in the chromatogram can be easily obtained (Figure 6).
In-Source Fragmentation for Structural Information
Upon investigation, unknown impurity 1 and 4 were found to have a molecular weight of m/z 557, only 2 Da less than that of the API. Literature suggests this is likely a common photolytic degradant of the atorvastatin compound.6 However, unknown impurities two and three require further assessment to better understand their respective structures.
In-source fragmentation can provide valuable structural information about analyte molecules, allowing for the detection of characteristic fragment ions that can aid in the identification and characterization of the compound.
By increasing the cone voltage of the QDa II Mass Detector, one can perform pseudo-MS/MS of given compounds by achieving in-source fragmentation. An example of this can be seen in Figure 7, where unknown impurities two and three are investigated.
Applying a cone voltage of 35 V, the m/z 573.3 precursor mass of unknown impurity 3 fragments into m/z 454. (Figure 7B). The fragmentation pattern suggests that this compound could either be Impurity G or Atorvastatin Methyl Ester.
An adduct ion [M+K]+ at m/z 611 can be seen in this analysis, and further fragmentation at a cone voltage of 50V generated product ions with a m/z of 436, 394, 376, and 292-which align more closely with literature assessments of Atorvastatin Methyl Ester7. However, more analysis would be needed to be absolute in this statement.
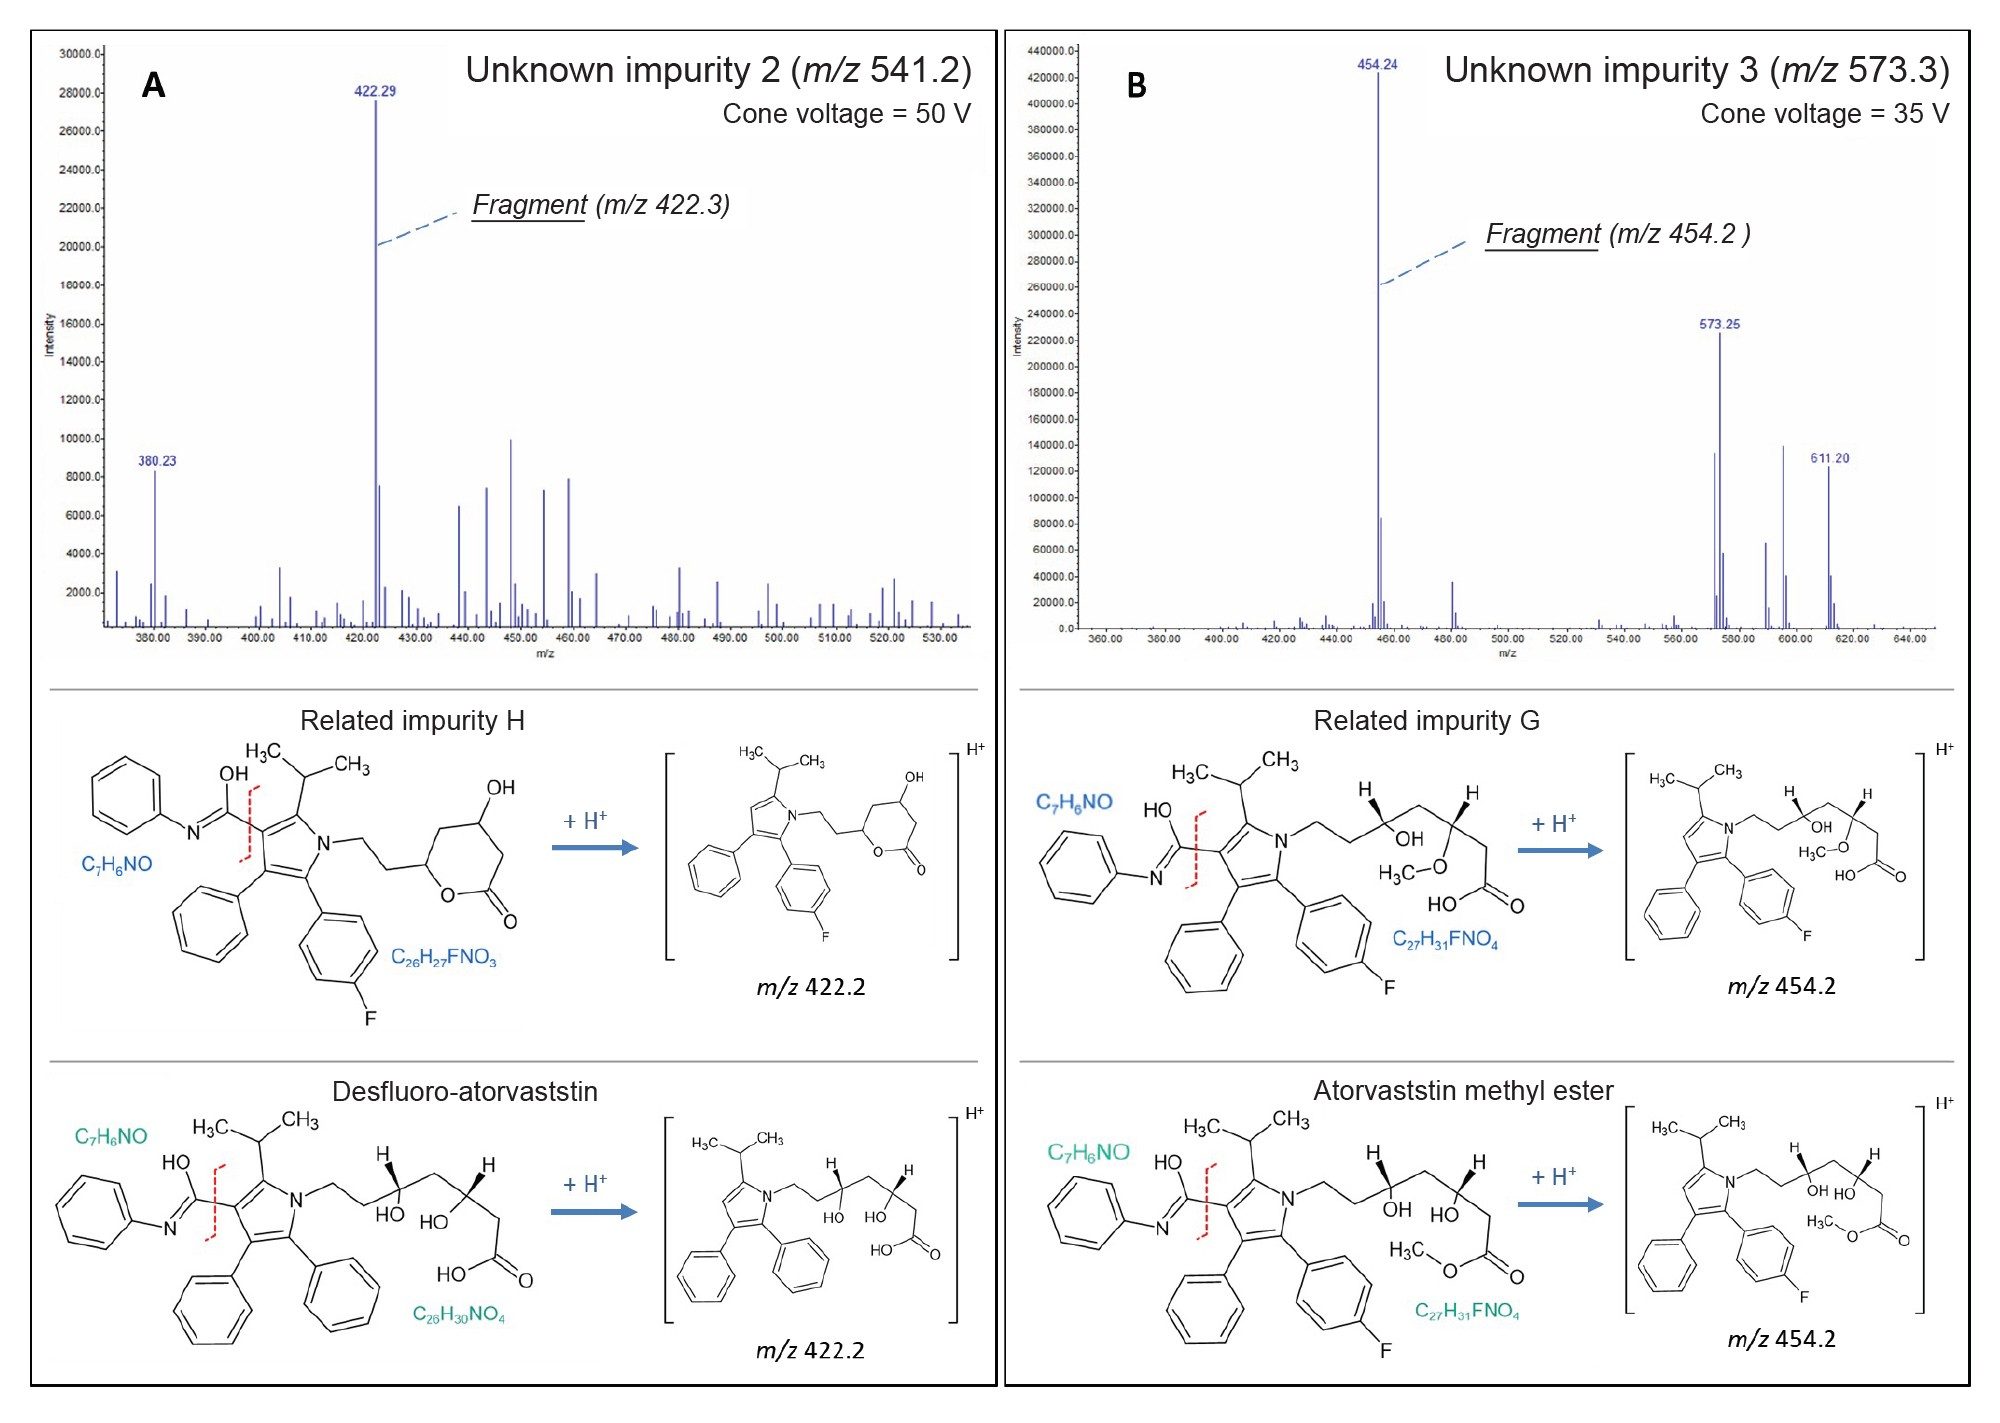
A 50V cone voltage applied to the m/z 451.2 precursor ion of unknown impurity 2 generated a fragment at m/z 422 (Figure 7A). This fragmentation pattern matches both Desfluoro-Atorvastatin and Related Impurity H. The presence a subsequent m/z 380 fragment of m/z 422 indicates a higher likelihood of this compound being Related Impurity H.
Mass Detection Detects Co-Eluting Impurities
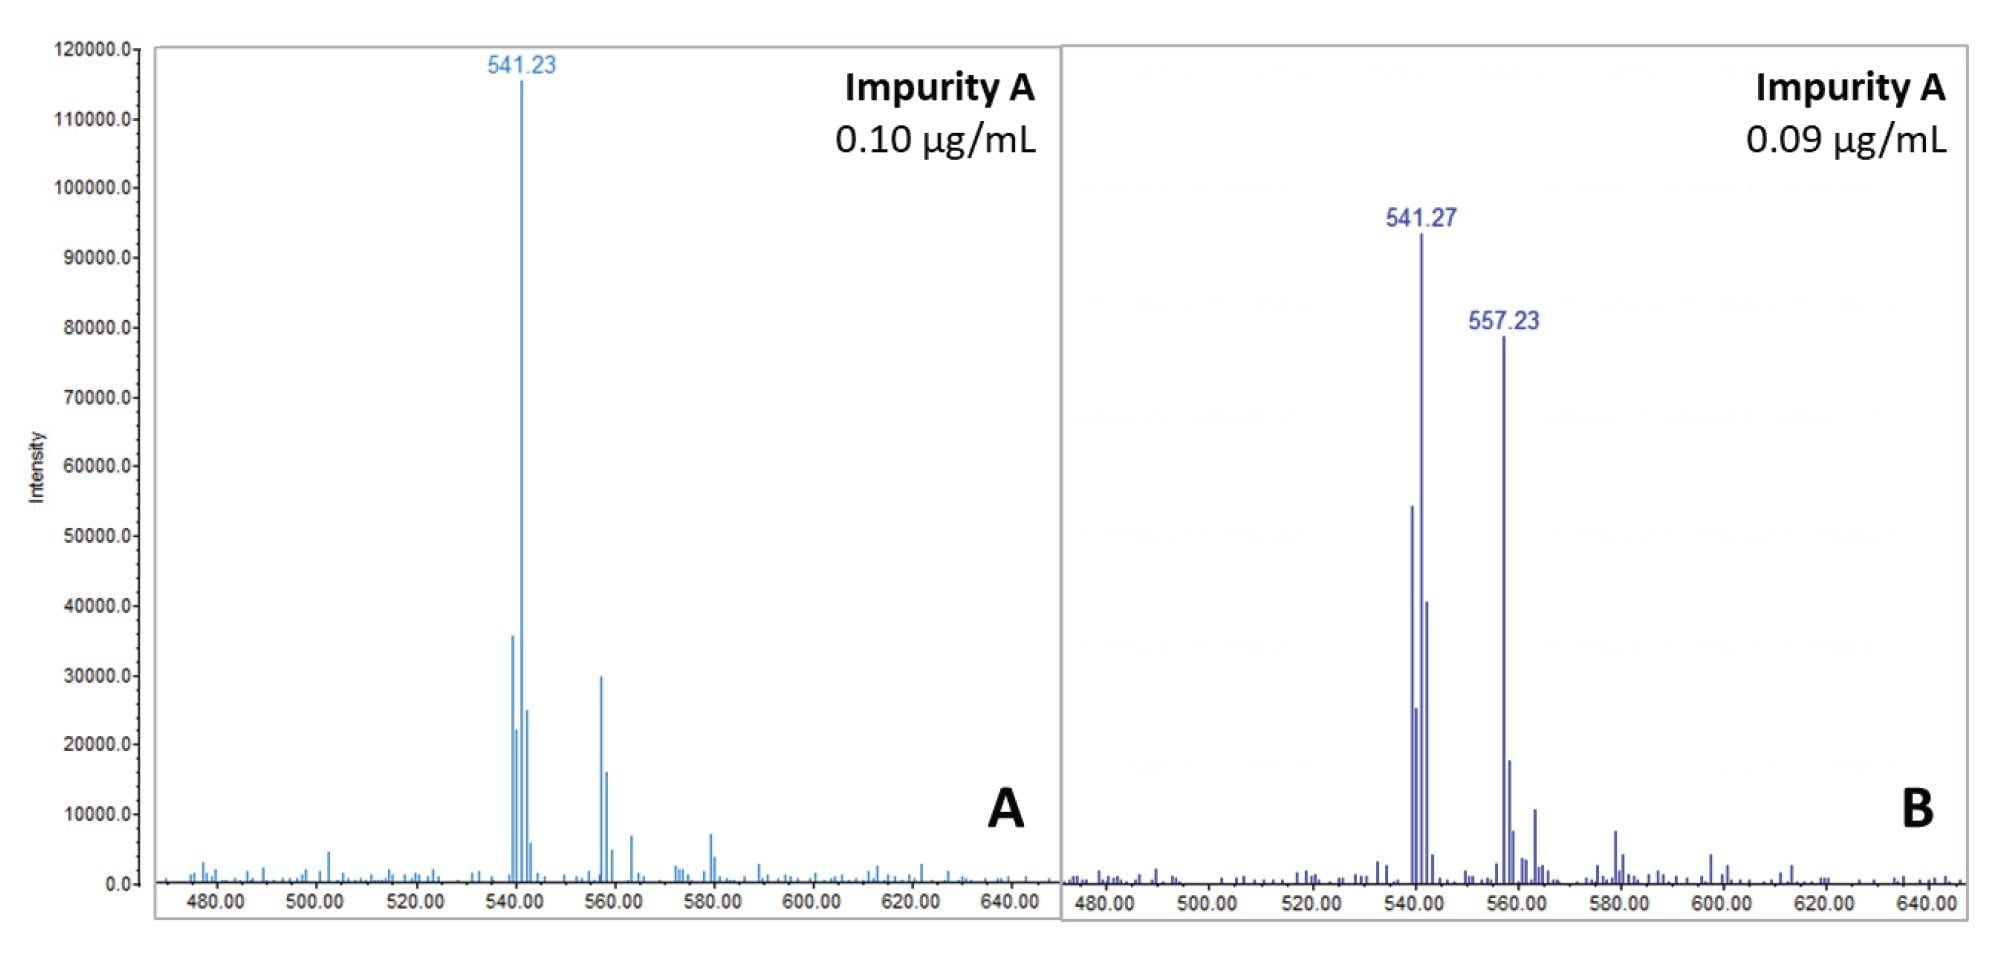
Samples were stored at 10 °C for two weeks to monitor any impurity changes over time. A 75 µg/mL atorvastatin sample spiked with 0.12% impurity mix was designated as a 'Degradation Test Sample'. Analysis shown in Figure 8 revealed intriguing differences between the mass spectrum of related impurity A in the Degradation Test Sample (Figure 8B) and a sample of similar concentration (0.10 µg/mL impurity mix) without the API present (Figure 8A). A significant increase in m/z 557.2 was observed in the former, suggesting the presence of a photolytic degradant of the API co-eluting with related impurity A.
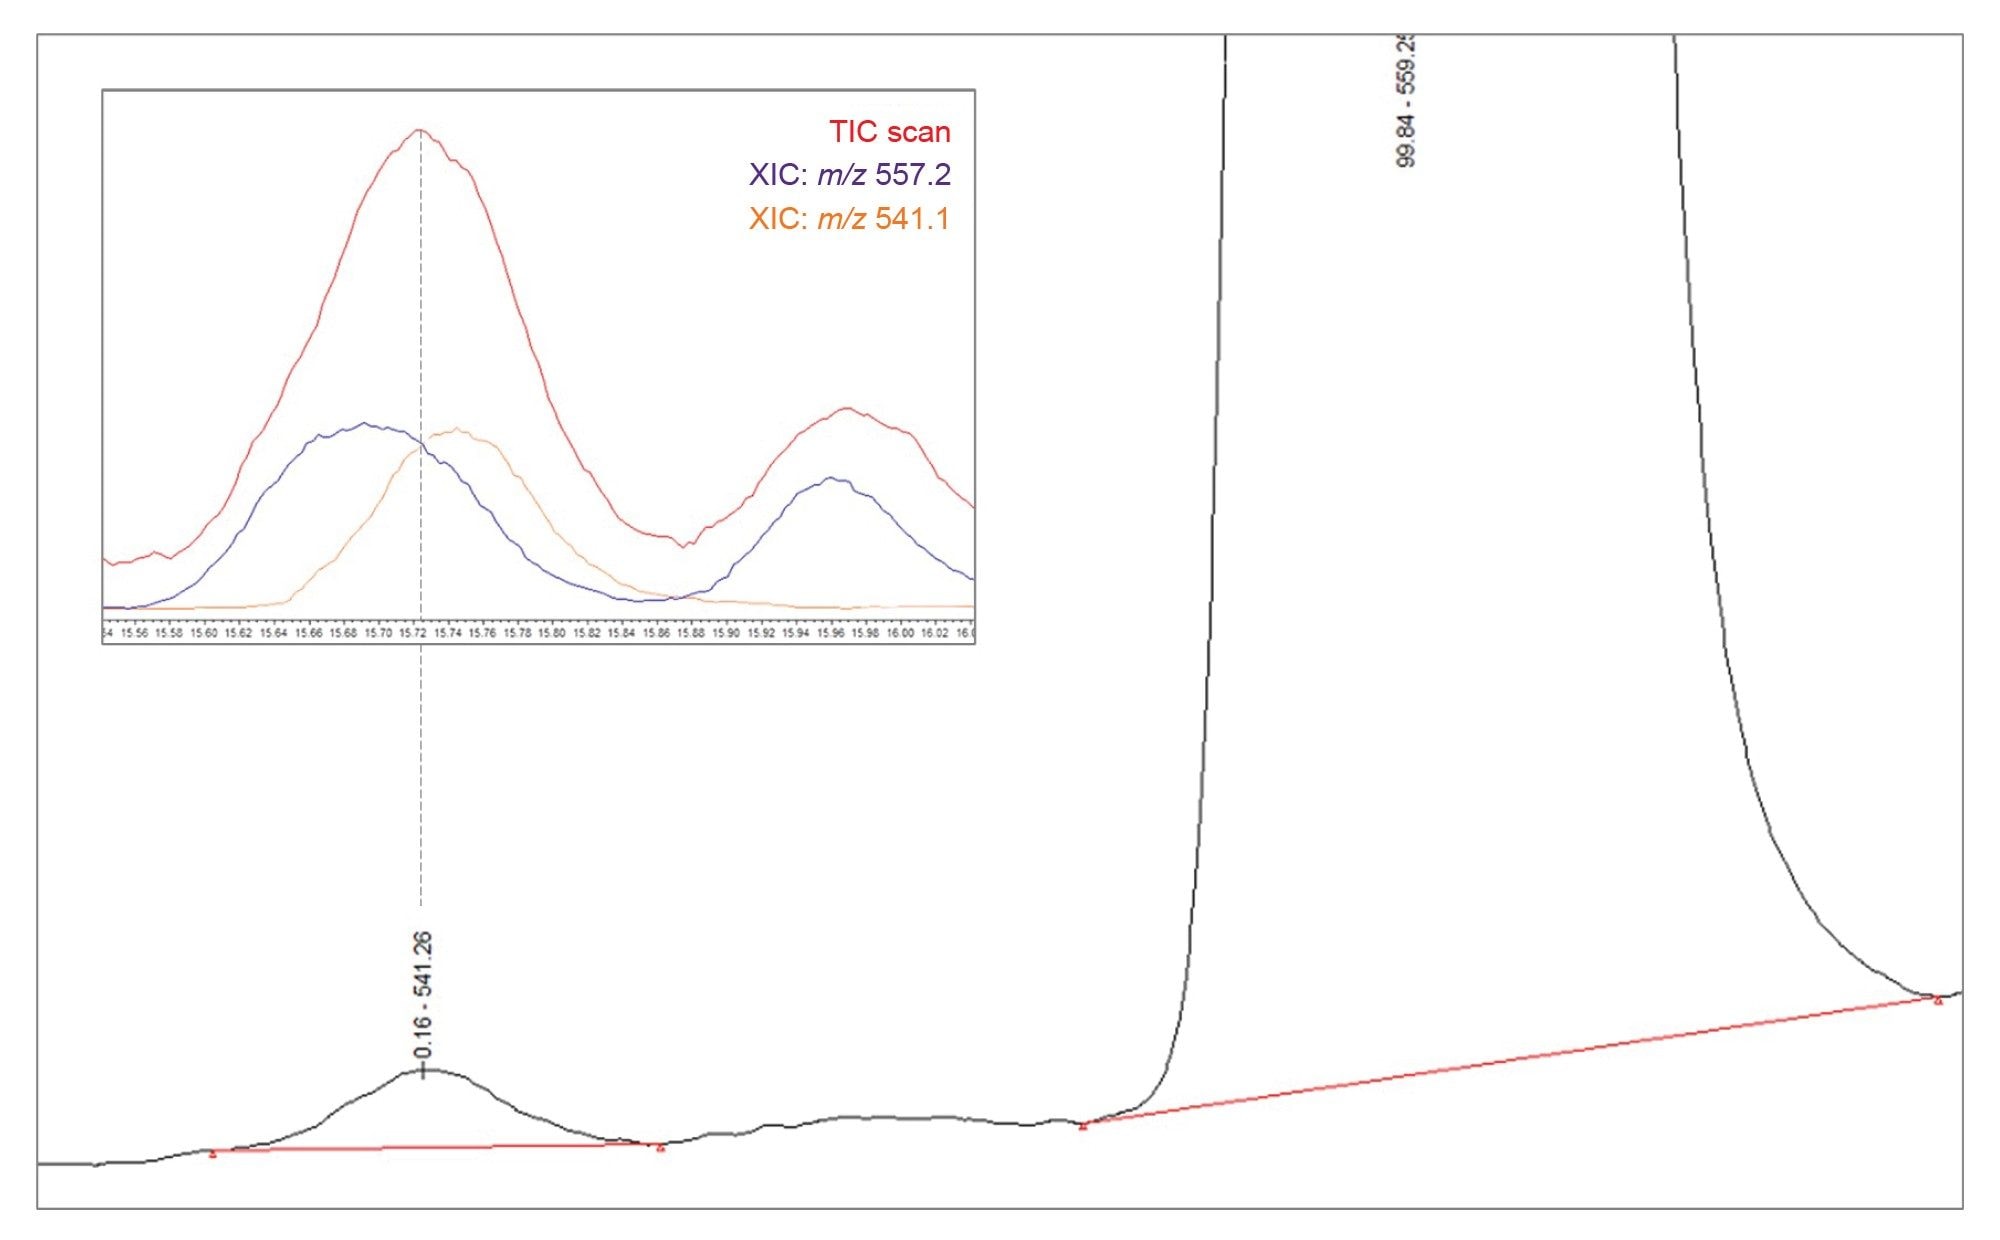
Upon re-quantification of the sample approximately 15 days after preparation, the relative amount of related impurity A compared to the API appeared to increase, from an average of 0.10% (see Table 2) to 0.16% as shown below in Figure 9. This difference is not attributed to a change in the concentration of related impurity A, but rather to a co-elution with another compound, which becomes more prominent as the API degrades. Consequently, this leads to an overestimation when quantifying using UV chromatography. The co-elution is illustrated in Figure 9, where an XIC for related impurity A (m/z 541.1) is overlayed against an XIC for the m/z 557.2 impurity, as well as the MS TIC scan. This highlights the importance of mass detection to ensure accurate quantification of impurities and proper management of co-elution.
Empowering Data Reporting
This application extensively leveraged Empower CDS reporting functionality to facilitate the streamlined assessment of relative impurity concentrations within sample batches, as depicted in Figure 10. This robust feature allows users to swiftly make well-informed decisions, thereby ensuring both workflow compliance and data integrity.
Conclusion
This work demonstrates the significant benefits for end-users in adopting the ACQUITY QDa II Mass Detector into existing UV workflows for routine testing of impurities in APIs, by demonstrating the capability to:
- Effortlessly annotate peaks with molecular weight, for simple mass confirmation within an analysis, streamlining the confirmation process of known impurities
- Precisely quantify impurity levels, ensuring atorvastatin related impurities A, C, and I are maintained below a qualification threshold of 0.15% relative to the API
- Enhance structural insights with in-source fragmentation, to facilitate the confirmation of molecular weights for unknown impurities, offering deeper understanding into compound structures
- Safeguard against biases in reporting of known impurities, with valuable insights from mass detection enabling interference detection, preserving product quality, and expediting product release timelines
In conjunction with Empower CDS software, this analytical approach further elevates the impurity workflow, delivering simplicity, efficiency, and upholding compliance and data integrity standards.
References
- Vukkum P, Moses Babu J, Muralikrishna R. Stress Degradation Behavior of Atorvastatin Calcium and Development of a Suitable Stability-Indicating LC Method for the Determination of Atorvastatin, its Related Impurities, and its Degradation Products. Sci Pharm. Jan-Mar;81(1):93–114. 2013.
- Impurities in EW drug substances Q3A(R2)–ICH (Oct 2006) ICH–Q3 Guidelines. Available at: https://database.ich.org/sites/default/files/Q3A%28R2%29%20Guideline.pdf (Accessed: 09 February 2024).
- European Pharmacopoeia (Ph. Eur.) 11th Edition. Available at: https://www.edqm.eu/en/european-pharmacopoeia-ph.-eur.-11th-edition (Accessed: 09 February 2024).
- Shulyak, N. et al. ‘Development of a Novel, Fast, Simple HPLC Method for Determination of Atorvastatin and Its Impurities in Tablets’, Scientia Pharmaceutica, 89(2), p.16. 2021.
- Piponski, M. et al. ‘Concepts in Development of Fast, Simple, Stability Indicating HPLC Method for Analysis of Atorvastatin Related Compounds in Tablets’, Journal of Analytical & Pharmaceutical Research, 7(4), pp. 450–457. 2018.
- Stach, J. et al. ‘Synthesis of Some Impurities and/or Degradation Products of Atorvastatin’, Collection of Czechoslovak Chemical Communications, 73(2), pp. 229–246. 2008.
- Mornar, A., Damić, M. and Nigović, B. ‘Separation, Characterization, and Quantification of Atorvastatin and Related Impurities by Liquid Chromatography-Electrospray Ionization Mass Spectrometry’, Analytical Letters, 43(18), pp. 2859–2871. 2010.
720008282, April 2024