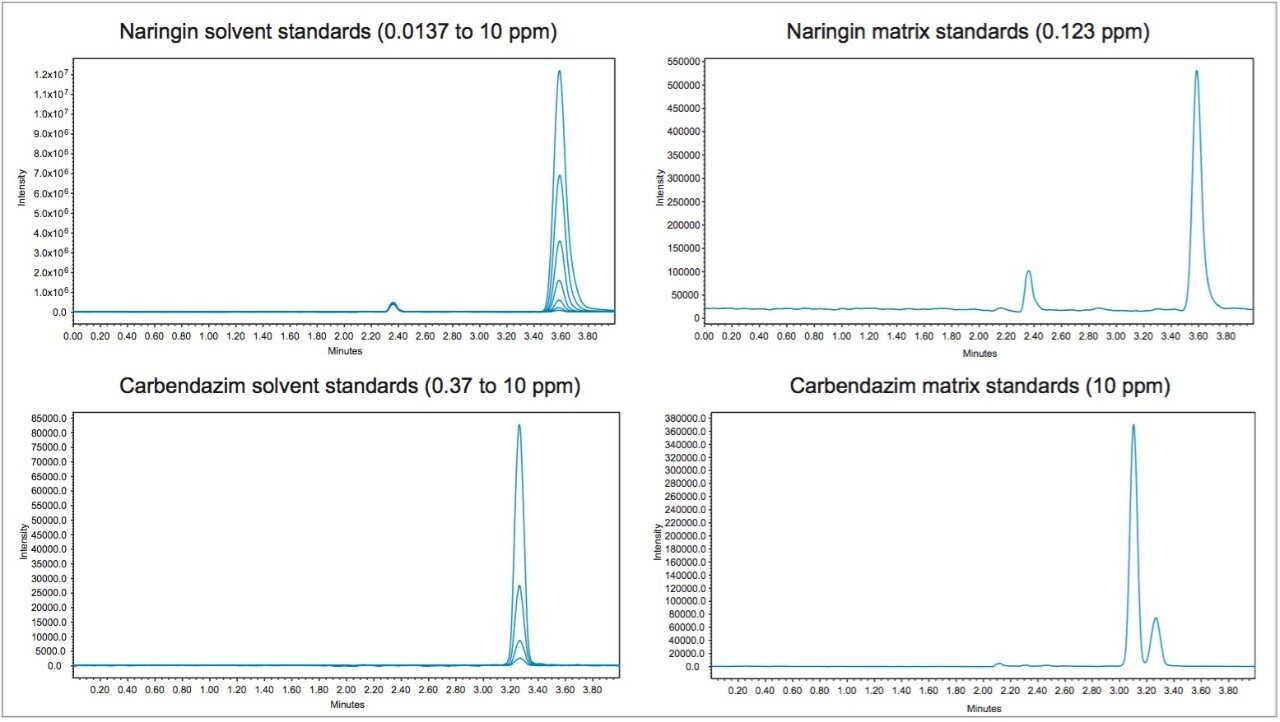
In early 2015, the U.S. FDA announced that it was investigating reports that low levels of a common fungicide, carbendazim, were being detected in imported orange juice. Naringin, a flavanone commonly found in very low levels in orange juice and high levels in grapefruit juice, is commonly tested to ensure that the orange juice is not being adulterated with grapefruit juice. At the time of writing, the testing limits for these compounds were 10 ppm for carbendazim and 0.1 ppm for naringin.
Time-consuming HPLC/UV methods are deployed in testing labs as a first pass test for these compounds. These methods are neither sensitive nor selective and therefore samples are typically re-directed to centralized MS/MS labs for further testing when any peak elutes near the expected retention time.
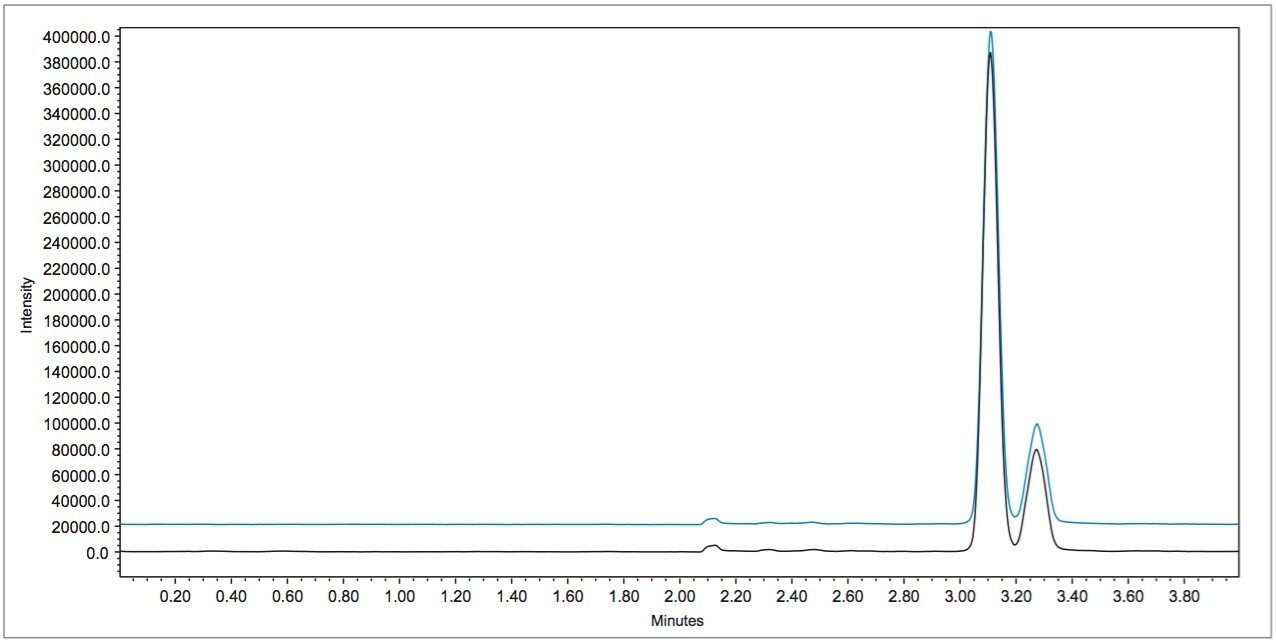
In this application note, learn how mass detection can be deployed in food QC lab environments to provide the selectivity and sensitivity necessary to detect low levels of compounds in complex matrices, such as orange juice.
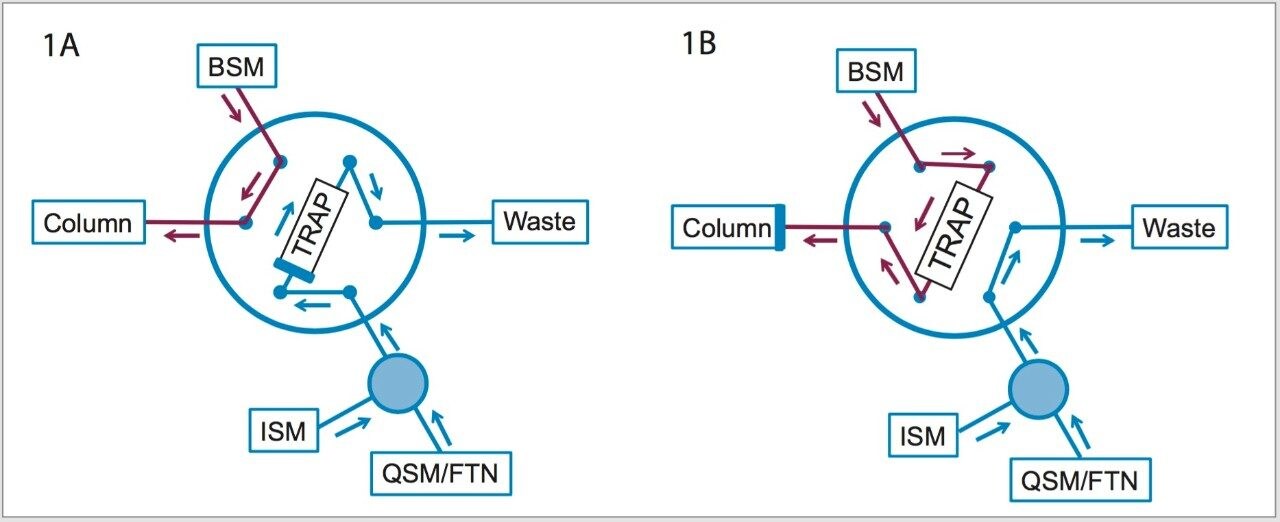
The sensitivity challenges of the aforementioned HPLC-UV method can benefit from multi-dimensional UPLC, which is an emerging technology that can provide increased peak capacity and increased sensitivity. One approach to multi-dimensional chromatography is to use trap-and-elute with at-column dilution to focus large amounts of material on a trap and then to elute to a chromatography column. Sample enrichment can be achieved as a result of deploying this approach in the lab.