• Note d'application

Development of a Quantitative SPE LC-MS/MS Assay for Bradykinin in Human Plasma

Development of a Quantitative SPE LC-MS/MS Assay for Bradykinin in Human Plasma

  • Mary E. Lame
  • Erin E. Chambers
  • Kenneth J. Fountain
  • Waters Corporation
Human serum in tube in doctor's hand

Abstract

A fast, simple, analytical-scale LC method was developed for separation of bradykinin from closely related endogenous interferences with a total LC cycle time of 3.5 minutes. The CORTECS UPLC C18 , Solid Core Column provided improved peak shape and sensitivity for bradykinin versus traditional C18 fully-porous columns.

Benefits

  • Use of the CORTECS UPLC Column facilitated narrow peak widths, providing sensitivity and resolution from matrix interferences
  • SPE using Oasis WCX, a mixed-mode sorbent, reduced matrix interferences and enhanced selectivity of the extraction for Bradykinin in plasma
  • The 96-well Oasis μElution plate format concentrated the sample and minimized peptide loss to reach detection limits of 5pg/mL for Bradykinin in plasma
  • Selective, fast SPE extraction (<30 minutes) without time-consuming immuno affinity purification 
  • High sensitivity achieved with Xevo TQ-S MS that is comparable to the more time-consuming and laborious immunoassay methods
  • More accurate and precise quantification than traditional LBA methods
  • Rapid analysis time of 3.5 minutes increases productivity

Introduction

Bradykinin is a physiologically and pharmacologically active peptide, consisting of 9 amino acids, and is derived from the kinin group of proteins (Figure 1). Kinins are effectors of vasodilation, vascular permeability, nitric oxide release and arachidonic acid mobilization. They are important regulators of blood pressure, kidney function and heart function, and are also involved in inflammation.1 Bradykinin causes blood vessels to dilate, and therefore causes a lowering of blood pressure. The ability to measure changes of this peptide hormone with high sensitivity, selectivity and accuracy, as a function of disease progression or drug treatment is thus highly advantageous. Although biologics have historically been quantified using ligand binding assays (LBAs), over the past few years, there has been a trend toward the analysis of large molecules by LC-MS/MS. This is in part driven by the fact that LBAs can suffer from significant cross-reactivity issues and lack of standardization. LC-MS/MS has the advantage of shorter development times, greater accuracy and precision, the ability to multiplex, and can readily distinguish between closely related analogues, metabolites or endogenous interferences. Peptides in general are often difficult to analyze by LC-MS/MS, as MS sensitivity is low due to poor transfer into the gas phase and poor fragmentation, making LC and sample preparation method development challenging. Accurate quantification of bradykinin in plasma is particularly challenging because it is present in low pg/mL levels, is rapidly metabolized, and also artificially produced during blood sampling and sample preparation via proteolytic processes. 

This study utilizes specifically designed blood collection techniques to inhibit bradykinin formation ex vivo and takes advantage of mixed mode solid phase extraction (SPE) and a high-efficiency, solid-core particle column to minimize and resolve interferences, while facilitating high sensitivity quantification.

Experimental

Method conditions

System:

ACQUITY UPLC

Column:

CORTECS UPLC C18 Column, 1.6 μm, 2.1 mm x 50 mm

Mobile phase A:

0.1% Formic acid in water

Mobile phase B:

0.1% Formic acid in acetonitrile

Gradient:

see Table 1

Column temp.:

35 °C

Sample temp.:

15 °C

Inj. Volume:

10 μL

Total run time:

3.5 minutes

Collection plates:

Waters 1 mL ACQUITY Collection Plates

UPLC gradient conditions
Table 1. UPLC gradient conditions.

MS conditions

MS system:

Xevo TQ-S

Ionization mode:

ESI positive

Capillary voltage:

3.0 kV

Desolvation temp.:

500 °C

Cone gas flow:

150 L/hr

Desolvation gas flow:

1000 L/hr

Collision cell pressure:

3.58 x 10 (-3) mbar

Collision energy:

Optimized by component, see Table 2

Cone voltage:

Optimized by component, see Table 2

MRM transitions, collision energies, and cone voltages
Table 2. MRM transitions, collision energies, and cone voltages for bradykinin and [Lys-des-Arg9] bradykinin, the internal standard (IS).

Data management

Chromatography software:

UNIFI 1.6

Quantification software:

UNIFI 1.6

Results and Discussion

Mass spectrometry

The 2+ and 3+ precursors at m/z 531 and m/z 354 were observed for bradykinin. Representative MS/MS spectra of the 3+ precursors for bradykinin (Panel A) and IS (Panel B) are shown in Figure 3. During method development, several different multiply charged precursors and fragments were monitored. Ultimately the 3+ precursors of bradykinin and IS were used as these were the most intense and selective in matrix. The fragment at m/z 419.18 y31+ was chosen as the primary  fragment for bradykinin quantitative analysis. The 3+ precursor and the m/z 408.18 b41+ fragment were used for confirmatory purposes. For the IS, the 3+ precursor at m/z 344.94 and the fragment at m/z 386.03 b72+ were chosen. Optimal MS conditions are shown in Table 2. Although many peptides produce intense fragments below m/z 200, these ions (often immonium ions) result in high background in extracted samples due to their lack of specificity. In this assay, the use of highly specific b or y ion fragments with m/z values higher than their precursors yielded significantly improved specificity, facilitating the use of simpler LC and SPE methodologies.

MS/MS spectra of the 3+ precursors for bradykinin

UPLC separation

Unlike small molecules, peptides suffer from poor mass transfer in and out of fully-porous particles. Thus, using a column packed with solid-core particles allows for sharper peak shapes at the higher flow rate typically used for bioanalytical studies.2,3 With the CORTECS UPLC C18 Column, narrower peaks, reduced tailing, increased peak height and area were observed for bradykinin compared to a fully-porous particle column. Peak widths of 2.5- 3.0 seconds wide were obtained for bradykinin and the IS using the CORTECS UPLC C18 Column, compared to peak widths of 4 seconds on the fully porous column. Representative chromatograms of bradykinin and the IS using the CORTECS UPLC C18 Column are shown in Figure 4.

UPLC separation of bradykinin
Figure 4. UPLC separation of bradykinin and internal standard, from blank  extracted plasma, using a 2.1 x 50 mm CORTECS UPLC C18 Column.

Sample preparation

Human plasma was obtained from blood collected in tubes containing EDTA and protease inhibitors to inhibit formation of bradykinin ex vivo. SPE was performed using Oasis WCX, a mixed-mode sorbent, to enhance selectivity of the extraction. The sorbent relies on both reversed-phase and ion-exchange retention  mechanisms to selectively separate bradykinin from other high abundance poly peptides in complex plasma samples. The 96-well Oasis μElution Plate format concentrates samples without the need for evaporation and reconstitution. This provides the benefit of saving time and eliminating peptide loss due to adsorption to the walls of the collection plate during evaporation. Optimization of the pre treatment and wash steps was critical to fully recover bradykinin during the sample pre-treatment and SPE extraction. Pre-treatment of the sample with acid or base reduces viscosity and improves contact time with the sorbent, aids in disruption of protein binding, and can also facilitate better retention of the peptide to the SPE device by using the ion exchange functionality. During initial method development, ~80% recovery was observed with acid pretreatment of the plasma prior to extraction. Because bradykinin is a basic polar peptide, as indicated by its pI (12.0) and HPLC index (47.8), it was suspected that it was partially eluting during the initial loading step. Recovery was improved to ~90% recovery with a switch to base pretreatment, facilitating initial retention of bradykinin by ion exchange during the loading step. A change from 20% to 10% acetonitrile in wash step 2 eliminated breakthrough of bradykinin during washing and improved recovery to 100%. The optimized SPE protocol using base pretreatment of the plasma prior to SPE loading, combined with the optimized wash step of 10% acetonitrile, provided full recovery of bradykinin with less than 10% matrix effects. Additionally, binding of the peptides by ion-exchange imparted orthogonality into the overall method as the UPLC separation is performed in the reversed-phase dimension.

Linearity, accuracy, and precision

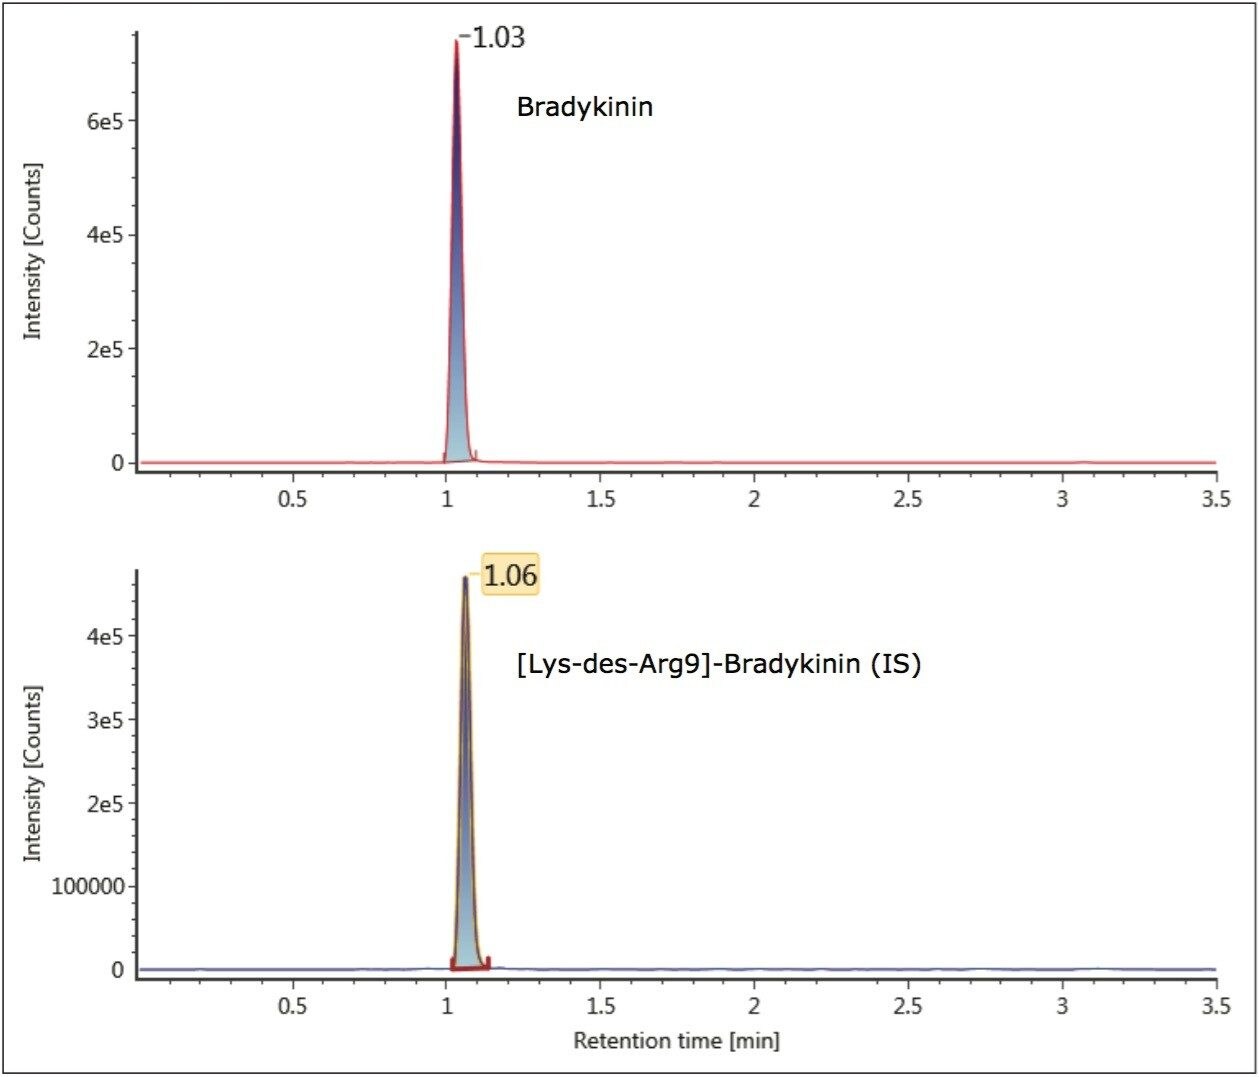
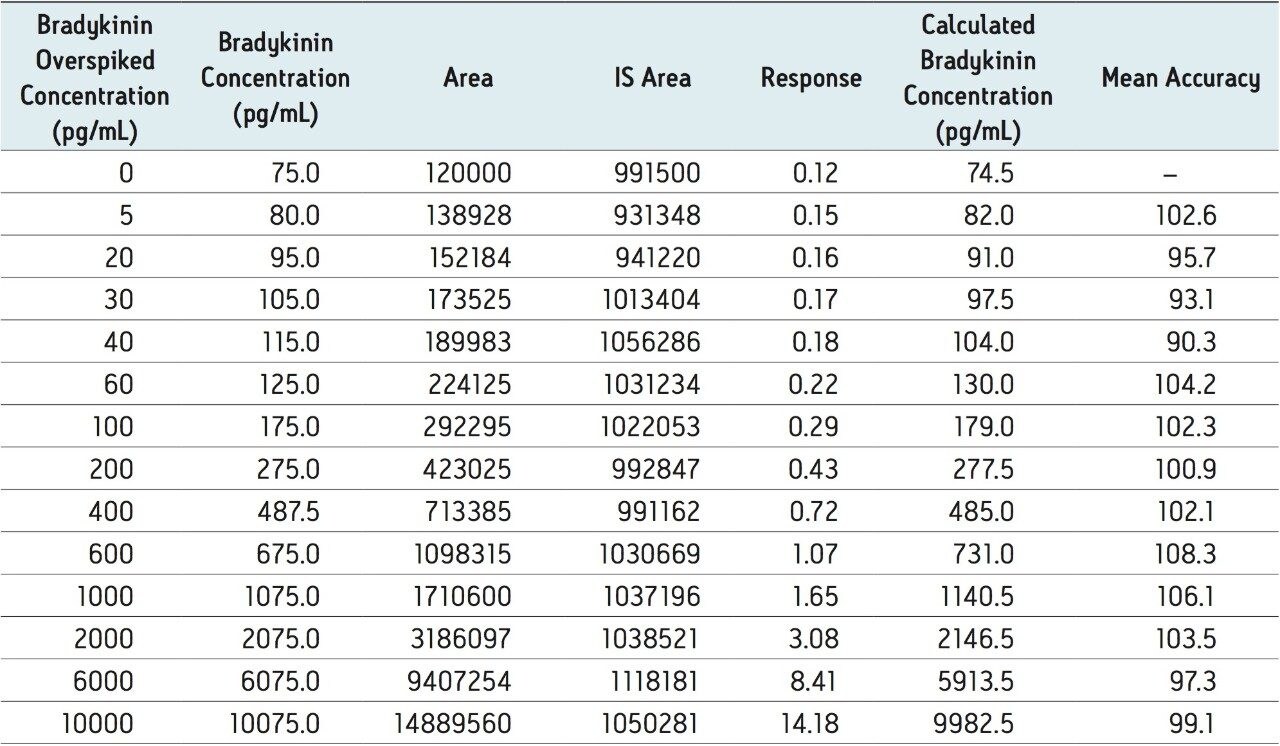
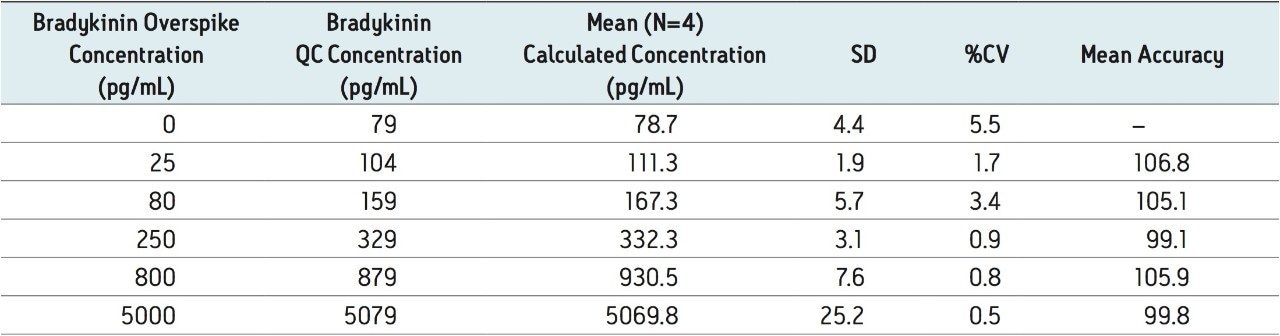
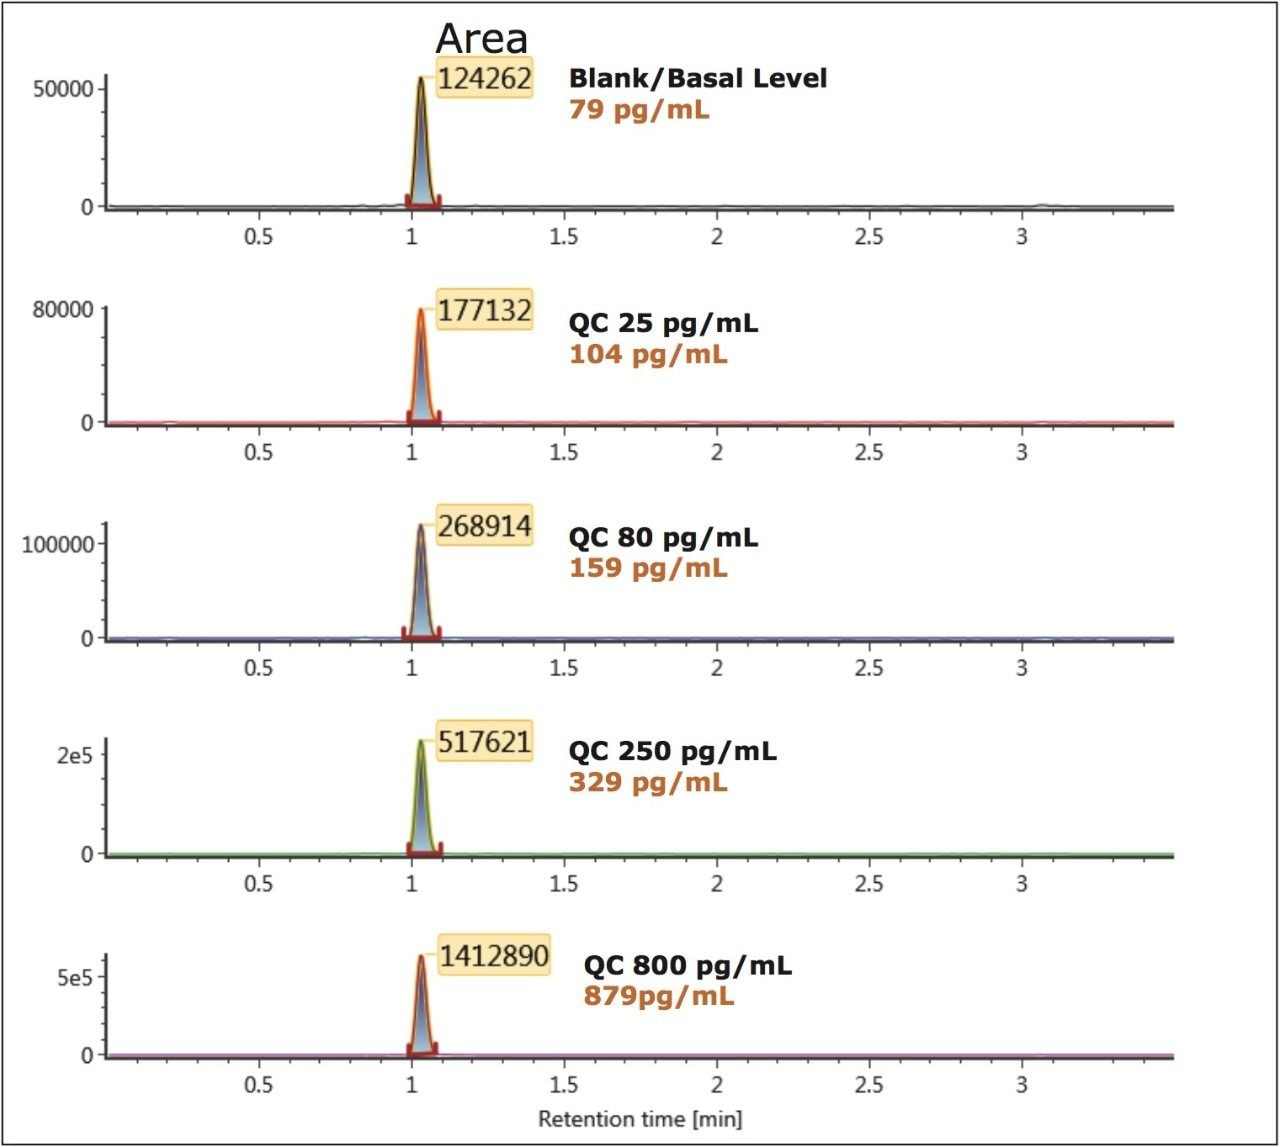
 To generate standard curves, human plasma was fortified with bradykinin at the following final concentrations: 5, 20, 30, 60, 100, 200, 400, 600, 1000, 2000, 6000, and 10000 pg/mL. Quality control (QC) samples were prepared in human plasma at the following concentrations: 25, 80, 250, 800, and 5000 pg/mL. [Lys-des-Arg9] Bradykinin (final concentration of 0.5 ng/mL) was used as the internal standard (IS) for bradykinin. Peak area ratios (PARs) of the analyte peak area to the IS peak were calculated. The calibration curve, prepared in human plasma, was constructed using PARs of the calibration samples by applying a one/ concentration (1/x) weighted linear regression model. All QC sample concentrations were then calculated from their PARS against the calibration curve. Due to the presence of endogenous bradykinin, standard addition was used. The mean basal level of bradykinin in control plasma samples was determined by calculating the x-intercept. The calculated basal level of bradykinin was then added to the spiked concentration for all standard curve and QC samples to enable accurate quantification. Using 1/x regression, bradykinin was linear with an R2 value of >0.99. A summary of standard curve performance is shown in is shown in Table 3. Results from QC analysis are shown in Table 4, and representative chromatograms of endogenous bradykinin and QC’s are shown in Figure 5. QC  samples, at all levels demonstrated very good accuracy and precision, easily meeting recommended FDA acceptance criteria outlined in the white papers describing best practices in bioanalytical method validation for LC-MS/MS assays.4,5 Mean endogenous basal levels of bradykinin were determined to be 79 pg/mL in human plasma with a SD and %CV of 4.4 and 5.5, respectively. This indicates a robust and reproducible method.

 Standard curve summary and statistics
Table 3. Standard curve summary and statistics from 5-10000 pg/mL for bradykinin extracted from human plasma.
QC statistics from bradykinin extracted from human plasma
Table 4. QC statistics from bradykinin extracted from human plasma.
Representative chromatograms of bradykinin

Importance of pre-analytical collection and handling

Accurate quantification of bradykinin in plasma is particularly challenging because it can be artificially produced during blood sampling and sample preparation, via proteolytic processes.1,6,7 In this study, particular attention was paid to the protocol for blood collection which employed the use of protease inhibitors to prevent ex vivo bradykinin formation. In Figure 6, panels A and B demonstrate an increase in bradykinin concentration from 90 pg/mL to 250 pg/mL from the same donor using the same collection protocol, but with blood collection in EDTA tubes with and without protease inhibitors, respectively. The artifactual formation of bradykinin is further demonstrated in Figure 6 (Panels C and D) in two additional donors obtained from a commercial vendor, with unspecified sample collection and protocol. In these cases, blood samples were collected in EDTA tubes that did not contain protease inhibitor upon collection and concentrations reached high ng/mL levels. These results further emphasize the need for proper sample collection to accurately quantify endogenous bradykinin plasma levels.

Representative chromatograms of endogenous levels
Figure 6. Representative chromatograms of endogenous levels of bradykinin extracted from human plasma with and without protease inhibitors and from multiple donors.

Conclusion

A mixed-mode SPE extraction method was developed for bradykinin from human plasma. The μElution format SPE plate eliminates the need for evaporation, minimizing the potential for losses due to non specific binding and facilitated concentration of the sample. A fast, simple, analytical-scale LC method was developed for separation of bradykinin from closely related endogenous interferences; with a total LC cycle time of 3.5 minutes. The CORTECS UPLC C18 , Solid Core Column provided improved peak shape and sensitivity for bradykinin versus traditional C18 fully-porous columns. The use of the CORTECS UPLC C18 Column, mixed-mode weak cation exchange SPE and higher m/z b or y ion MS fragments provided the level of selectivity and sensitivity necessary to accurately quantify and distinguish subtle differences in bradykinin levels from only 200 μL of plasma. Standard curves were accurate and precise from 5-10000 pg/mL. The lowest level of bradykinin that could be accurately and precisely quantified above the basal level was 5 pg/mL. QC samples at all levels easily met FDA regulatory criteria4,5 with mean accuracies ranging from 99.8-106.8 and mean %CV’s of 0.5-5.5. This indicates an accurate and reproducible method. This study also demonstrates the importance of proper sample collection with protease inhibitors to accurately represent endogenous levels of bradykinin. This method shows great promise for high sensitivity quantification of bradykinin in patient samples from PK and clinical studies using LC-MS/MS if further validation was performed.

References

  1. Murphey LJ, Hachey DL, JA. Oates JA, Morrow JD, and Brown NJ. Metabolism of Bradykinin In Vivo in Humans: Identification of BK1-5 as a Stable Plasma Peptide Metabolite J Pharmacol Exp Ther July 1, 2000 294:263-269
  2. Wagner BM, Schuster SA, Boyes BE, Kirkland JJ. Superficially porous silica particles with wide pores for biomacromolecular separations. Journal of Chromatography A. 2012; 1264(0): 22-30
  3. Kirkland JJ, Schuster SA, Johnson WL, boyes BE. Fused-Core Particle Technology in High-Performance Liquid Chromatography; An Overview. Journal of Pharmaceutical Analysis.
  4. Viswanathan CT, Bansal S, Booth B, DeStefano AJ, Rose MJ, Sailstad J, Shah VP, Skelly JP, Swann PG, Weiner R, Quantitative bioanalytical methods validation and implementation: best practices for chromatographic and ligand binding assays, Pharm. Res., 24 (2007) 1962-1973.
  5. Bansal S, DeStefano A, Key elements of bioanalytical method validation for small molecules, AAPS J., 9 (2007) E109-114.
  6. Cugno M, Agostoni P, Brunner HR, Gardinali M, Agostoni A, Nussberger. Plasma bradykinin levels in human chronic congestive heart failure J. Clin Sci. (Lond). 2000 Nov; 99(5):461-6.
  7. Nussberger J, Cugno M, Amstutz C, Cicardi M, Pellacani A, Agostoni A. Plasma bradykinin in angio-oedema. Lancet. 1998 Jun 6; 351(9117):1693-7.

Acknowledgements

We thank Jeffrey Widdos and Biological Specialty Corporation for providing excellent service and assistance in the special collection of human plasma used in this work.

720004833, November 2013

Haut de la page Haut de la page