PAAs are widely used in high amounts as a chemical feed stock within the chemical industry, and many of them are highly toxic to humans.1,2,3 PAAs can be used to produce many commodities, such as pharmaceuticals, pesticides, explosives, epoxy polymers, rubber, aromatic polyurethane products, and azo-dyes. They can be found in final products due to incomplete reactions, as impurities, by-products, or as degradation products. PAAs can be produced as by-products of azo dyes, which are a diverse and widely used group of organic dyes. Azo dyes have a wide range of uses including special paints, printing inks, varnishes, and adhesives; and can be found in many products such as textiles, cosmetics, plastics, and also in food contact material.
The inks and dyes industry is highly legislated and manufacturers that use these materials must monitor and quantify various regulated parameters, such as the presence or absence of PAAs.
Previous example methodologies for the analysis of PAAs include: GC-MS analysis following ion-pair extraction with bis-2-ethyl phosphate followed by derivatization with isobutyl chloroformate;4,5 UPLC analysis following a solid phase extraction (SPE) using cation-exchange cartridges;6 and reduction by liquid phase sorbent trapping followed by thermal desorption GC-MS analysis.7 Many previously used methods for PAA analysis lack robustness, selectivity, and sensitivity, and require lengthy, costly and time-consuming pre-treatments (derivatization, SPE).
Many PAAs have either a proven or suspected carcinogenic nature and are highly toxic, so there are a range of potential health risks that have led to strict worldwide regulations. U.S. FDA regulations (21 CFR 74.705 and 21 CFR 74.706) restrict the use of azo dyes that could degrade to PAAs; whereas EU regulations (commission directive 2002/72/EC and the amendment 2007/19/EC) set legislative limits for the release of total PAAs from food contact material.
Analytical laboratories require accurate and robust techniques to ensure confidence and versatility in meeting these legislative requirements The SQ Detector 2 offers a flexible solution for the ink and dyes industry.
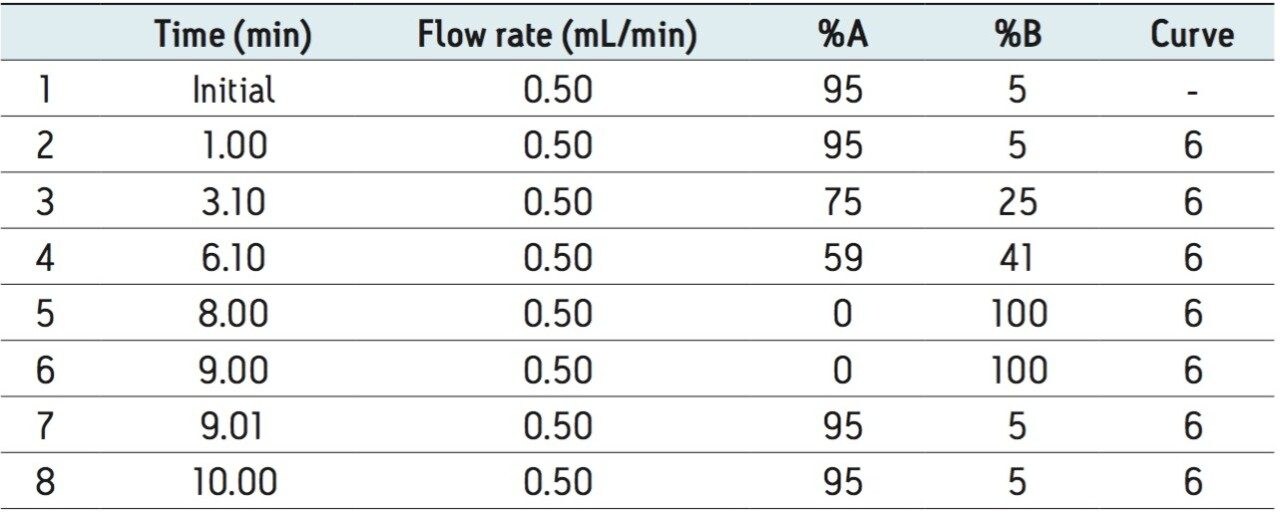
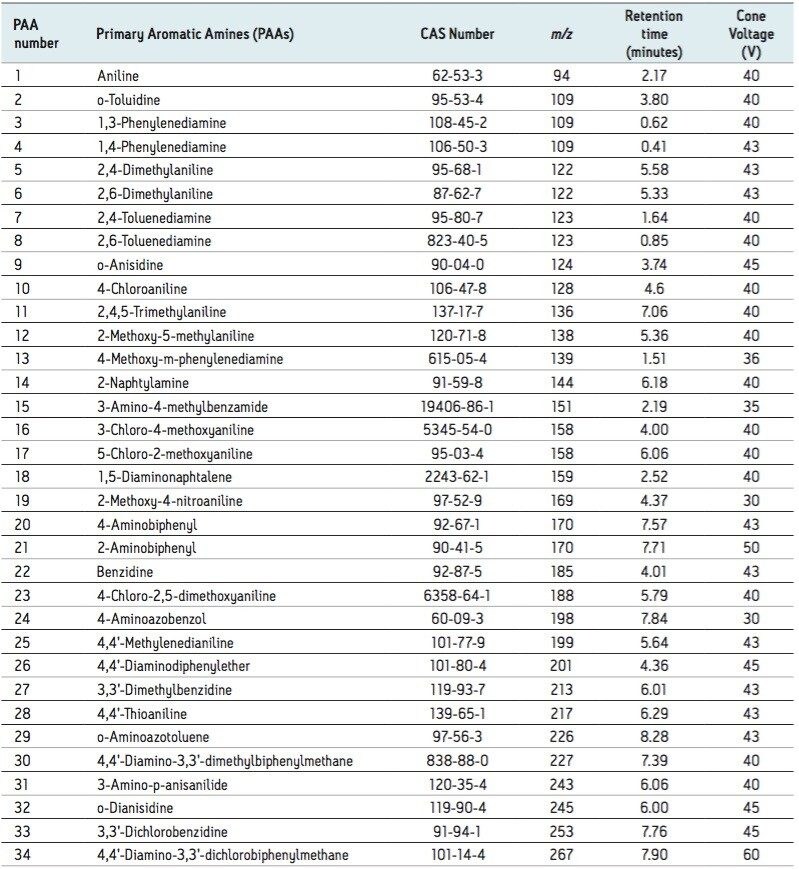
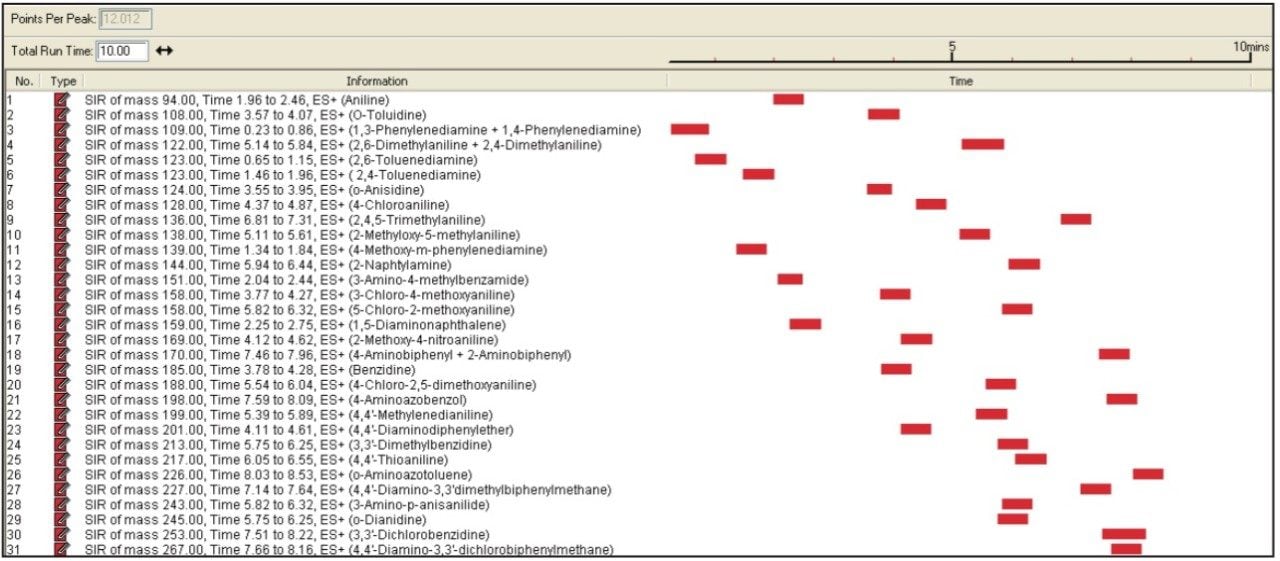
This application note describes the use of Waters ACQUITY UPLC H-Class coupled with the SQ Detector 2 for the rapid analysis of PAAs in ink.