• Note d'application

Enhancement of the UPLC Amino Acid Analysis Solution with Flexible Detector Options

Enhancement of the UPLC Amino Acid Analysis Solution with Flexible Detector Options

  • Hillary B. Hewitson
  • Thomas E. Blé
  • Diane M. Diehl
  • Waters Corporation

Abstract

In this experiment, hydrolyzed samples of pure protein and of animal feed were analyzed using the Waters UPLC Amino Acid Analysis Solution with a TUV detector, photodiode array detector (PDA), and with fluorescence detection (FLR). Absolute amounts of amino acids as well as molar ratios were compared between TUV and FLR detection options for reproducibility, consistency, and accuracy as compared to expected values.

Introduction

The measurement of amino acids is important in many applications. Protein structure laboratories use it to confirm the identification and modification of proteins and peptides. Also, the sum of the amounts of amino acids gives the total concentration of the samples. Biopharmaceutical manufacturing facilities can optimize drug yield through careful monitoring and adjustments to the nutrient levels in cell cultures used in its production. In the animal feed industry, amino acid levels are measured as part of determining nutritional content. In each of these applications, it is essential to be able to quickly and accurately identify and quantitate amino acid levels. Incorrect results could result in poor batch yields, delay of product to market, or loss of product. 

Waters provides a complete turnkey solution to meet the needs for each of these applications. The Waters UPLC Amino Acid Analysis Solution was initially offered in 2006 as a total system solution that was available to users with a tunable UV (TUV) detector. Through the use of the application-specific quality tested columns, eluents, and derivatization chemistry, users can count on accurate results. Inclusion of pre-defined Empower software methods provides users with powerful data generation and handling capabilities and allows rapid analysis and reporting of sample results. Recently, photodiode array and fluorescence detection have been added as options in the defined system, providing the users with equipment flexibility to satisfy the requirements of their laboratories, while maintaining the same quality results regardless of which detection option is chosen.  

Figure 1. Waters UPLC Amino Acid Analysis Solution

In this experiment, hydrolyzed samples of pure protein and of animal feed were analyzed using the Waters UPLC Amino Acid Analysis Solution with a TUV detector, photodiode array detector (PDA), and with fluorescence detection (FLR). Absolute amounts of amino acids as well as molar ratios were compared between TUV and FLR detection options for reproducibility, consistency, and accuracy as compared to expected values. 

Experimental

Samples

Acid-hydrolyzed bovine serum albumin (BSA) and soybean meal samples were prepared in an independent laboratory as part of a collaborative study. The samples were supplied at an estimated concentration of 1.0 mg/mL in 0.1 M HCl sealed under argon in ampoules. Samples were stored at -80 °C until analysis. 

Sample dilution and derivatization

The supplied samples were diluted with 0.1 M HCl prior to derivatization, as necessary, to assure accurate pipetting and complete derivatization. The samples were derivatized in batches, and were stable for up to one week at room temperature when tightly capped. Conditions, including suggested neutralization, for pre-column derivatization and analysis are described in detail in the Waters UPLC Amino Acid Analysis Application System Guide. The following sequential modified derivatization conditions were used for these samples.

  1. 60 µL AccQ•Tag Ultra Borate Buffer
  2. 10 µL diluted sample
  3. 10 µL 0.1 N NaOH
  4. 20 µL reconstituted AccQ•Tag Ultra Reagent

Chromatographic conditions

LC System:

Waters ACQUITY UPLC System

Column:

AccQ•Tag Ultra, 2.1 x 100 mm, 1.7 μm

Column Temp:

55 ˚C

Sample Temp:

20 ˚C

Flow Rate:

700 μL/min

Mobile Phase A:

1:20 Dilution of AccQ•Tag Ultra Eluent A Concentrate (prepared fresh daily)

Mobile Phase B:

AccQ•Tag Ultra Eluent B

Needle Washes:

Weak – 95:5 Water: Acetonitrile

Strong – 5:95 Water: Acetonitrile

Gradient:

AccQ•Tag Ultra Hydrolysate Method (provided in the UPLC Amino Acid Analysis Solution)

Total Run Time:

9.5 min

Injection volume:

1 μL, Partial Loop with Needle Overfill (2 μL loop installed)

Detection:

UV (TUV), 260nm

UV (PDA), 260nm, using 2D mode Fluorescence (FLR),

λEx 266 nm

λEm 473 nm

Acquisition and processing methods

The Waters UPLC Amino Acid Analysis Solution is provided with a CD that contains all the Empower methods necessary for acquisi-tion and processing of the samples, as well as reporting of results. Details of the methods can be found in the Waters UPLC Amino Acid Analysis System Guide.

Results and Discussion

The operating conditions were optimized  for each of the three detectors to give the highest signal-to-noise ratio. The results were compared, and a representative chromatogram of an amino acid hydrolysate standard is shown for each detector in Figure 2. 

Figure 2. Analysis of Hydrolysate Standard, 10 pmoles of each amino acid on column (except Cystine at 5 pmoles), with (A) TUV detector, (B) PDA detector, and (C) FLR detector.

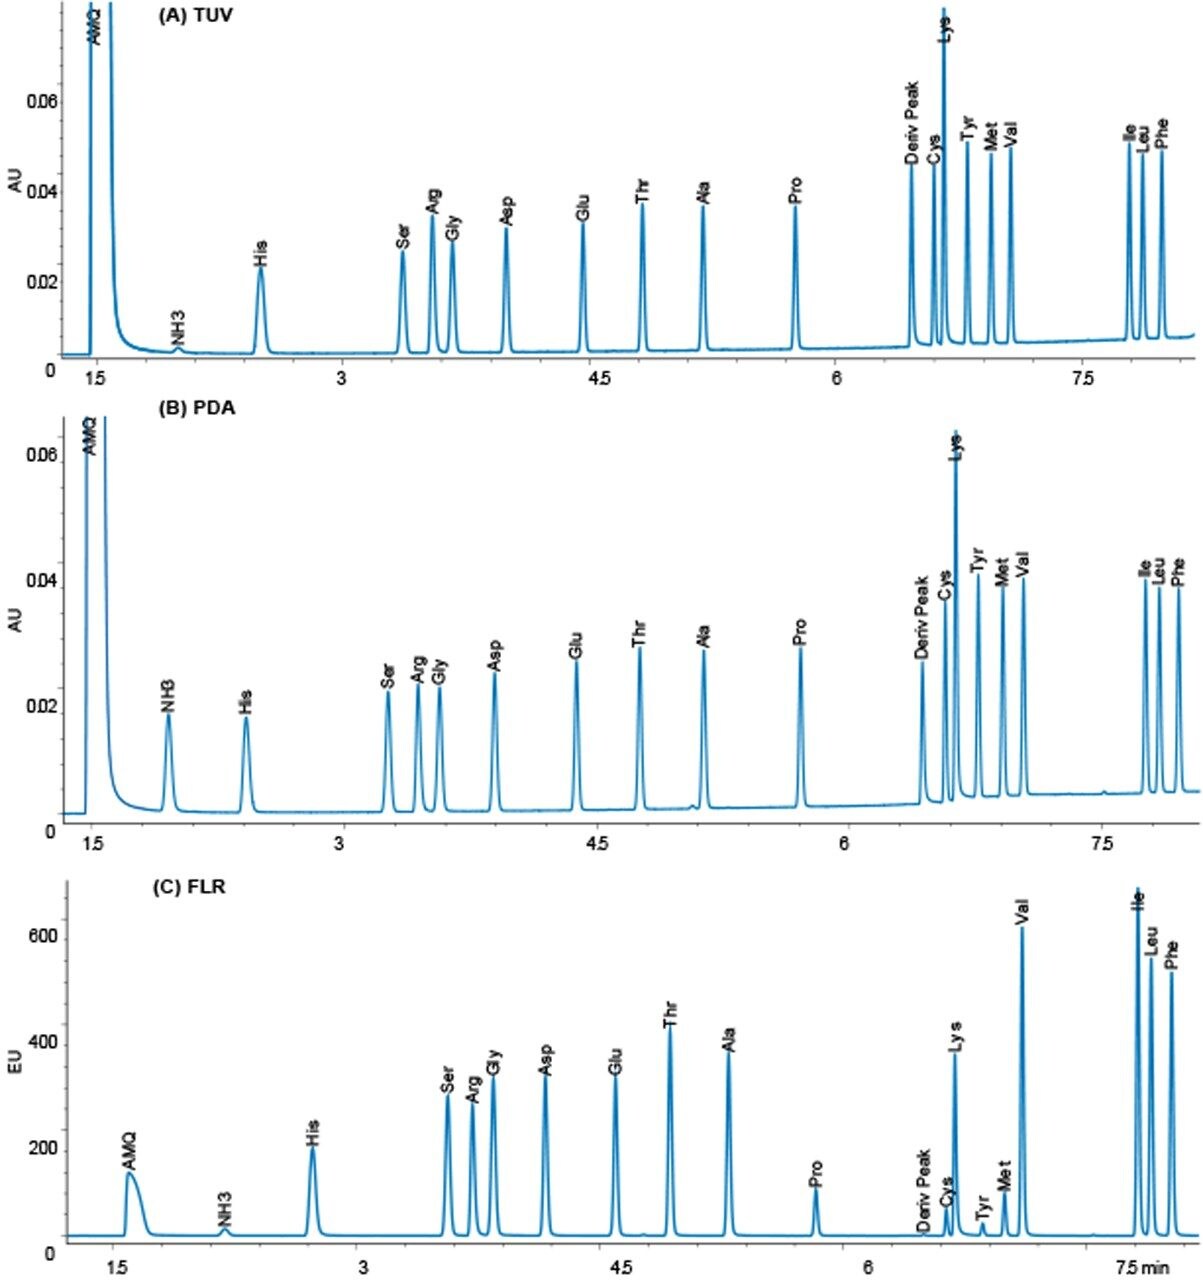
It has been widely accepted  that a TUV is more sensitive than a PDA, and that a FLR is much more sensitive than UV detection. In addition, it is also believed in general that a FLR detector will give more selec-tivity, while a PDA can give UV spectral information to confirm peak identity and purity. The data was analyzed with these assumptions in mind, to see if they were true in this application solution.

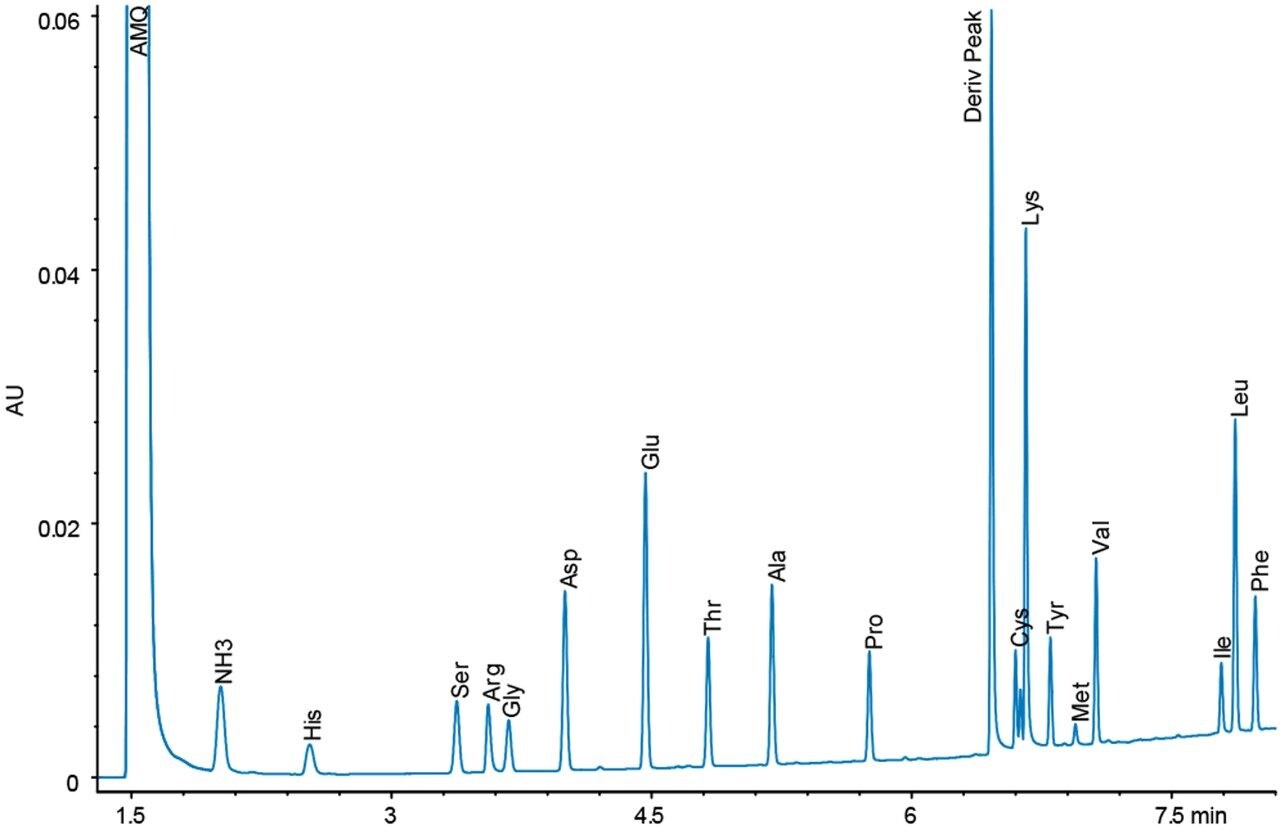
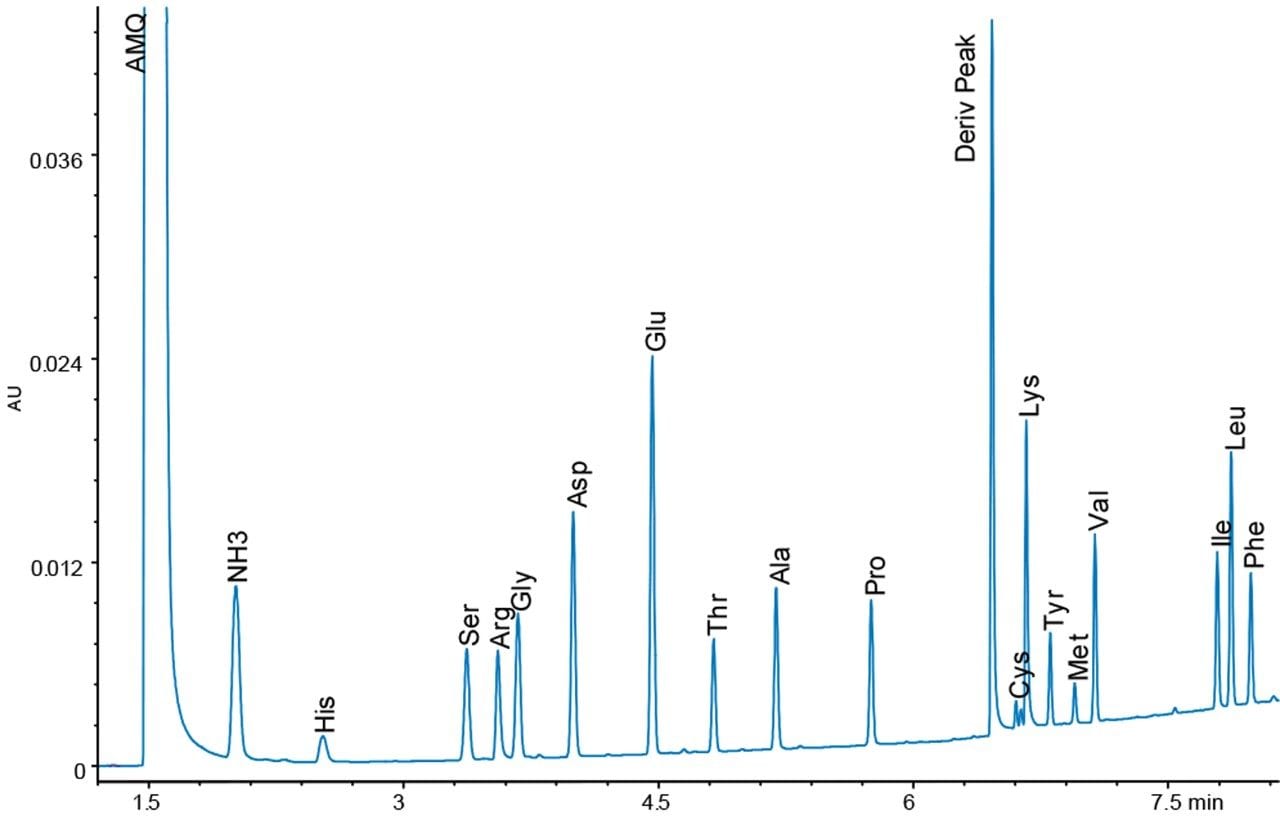
The response for 10 pmoles on column is almost identical for the TUV and PDA detectors, while the FLR gives quite a different response. The TUV has lower noise than the PDA detector by approximately a factor of two, so the sensitivity as signal-to-noise is higher for the TUV by about the same factor. 

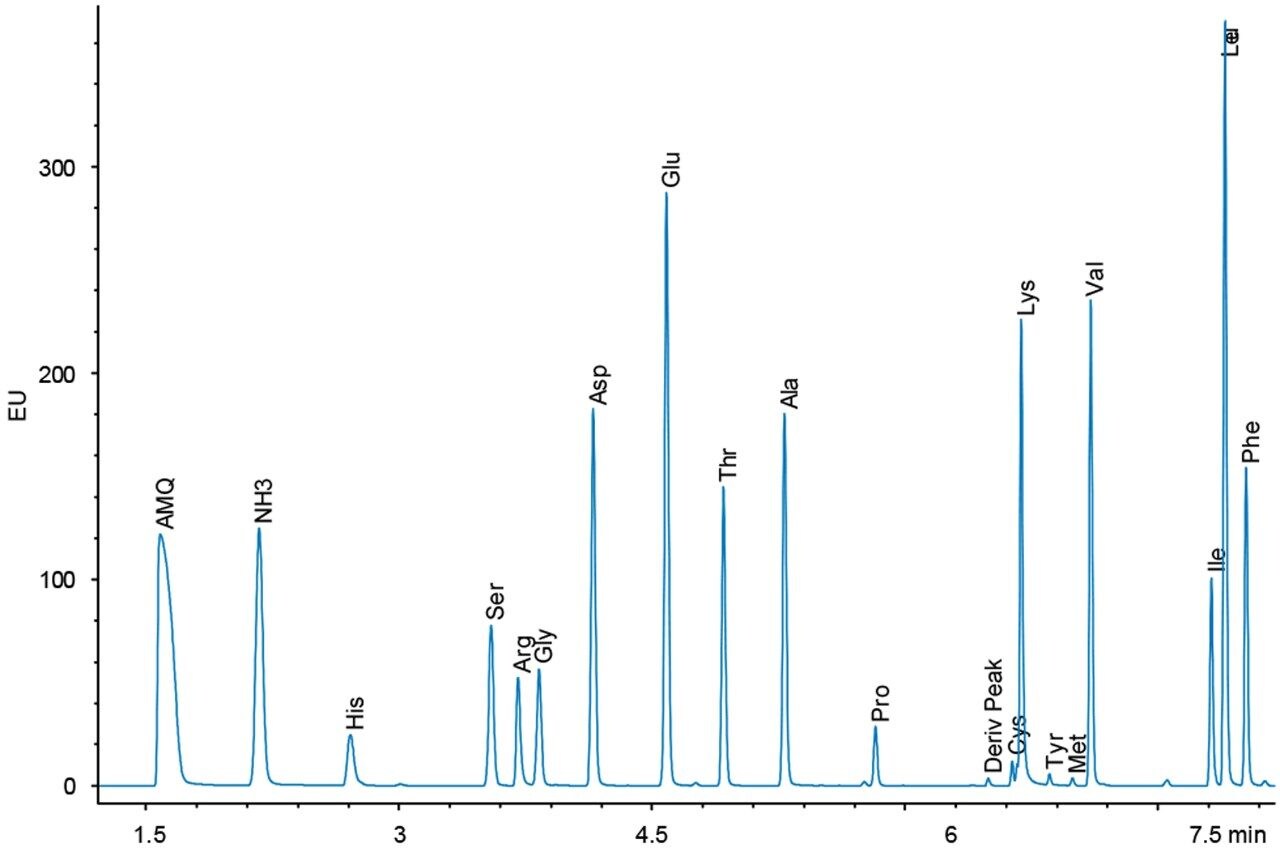
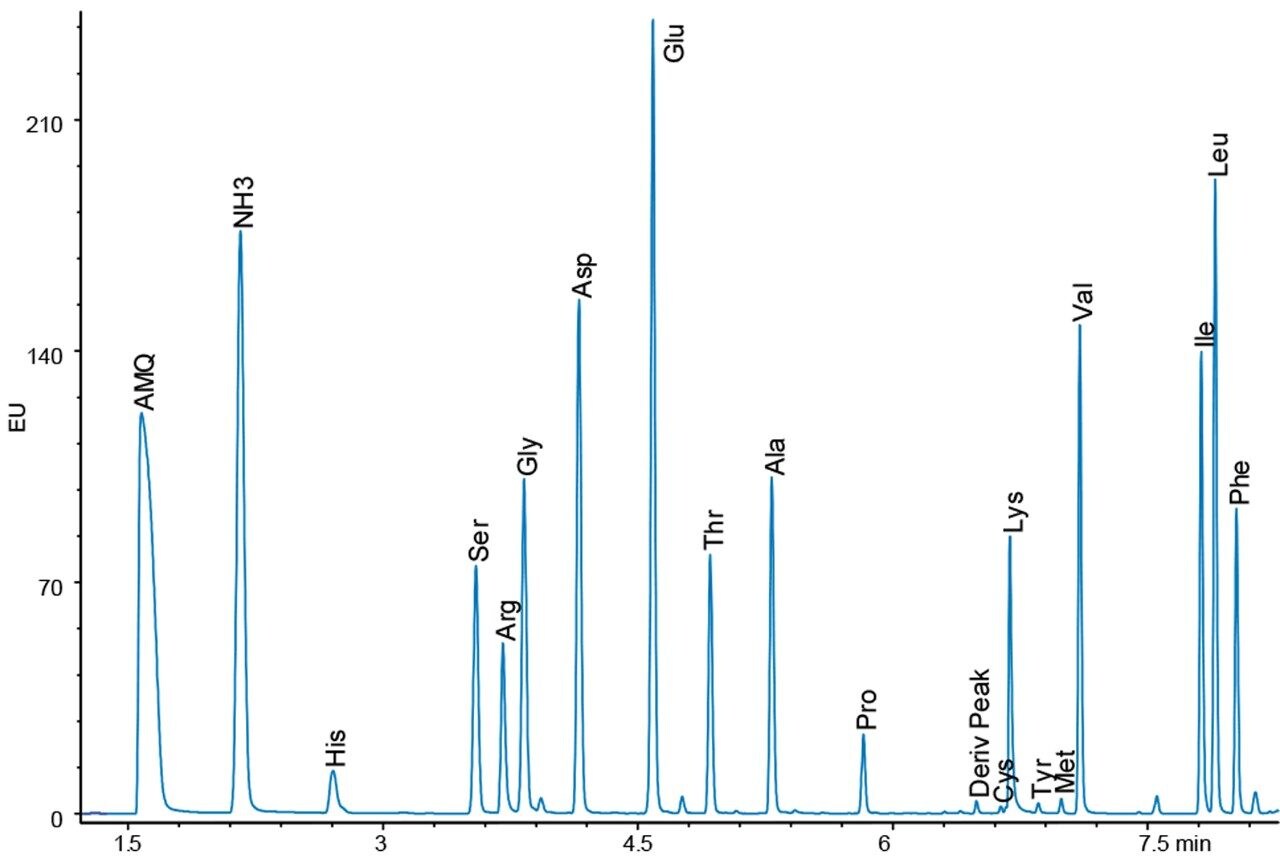
With the FLR detector, we observe that the derivatives of the different amino acids have different fluorescence yields, and thus different sized peaks. The excitation and emission spectra are identical for all the amino acids. The differences do not seem to be related to spectral shifts. Tyrosine is the smallest peak in the fluorescence chromatogram, and, therefore, dictates the limit of quantitation. The usable range for both the TUV and FLR detectors in the application is 50 fmoles to 50 pmoles on column.

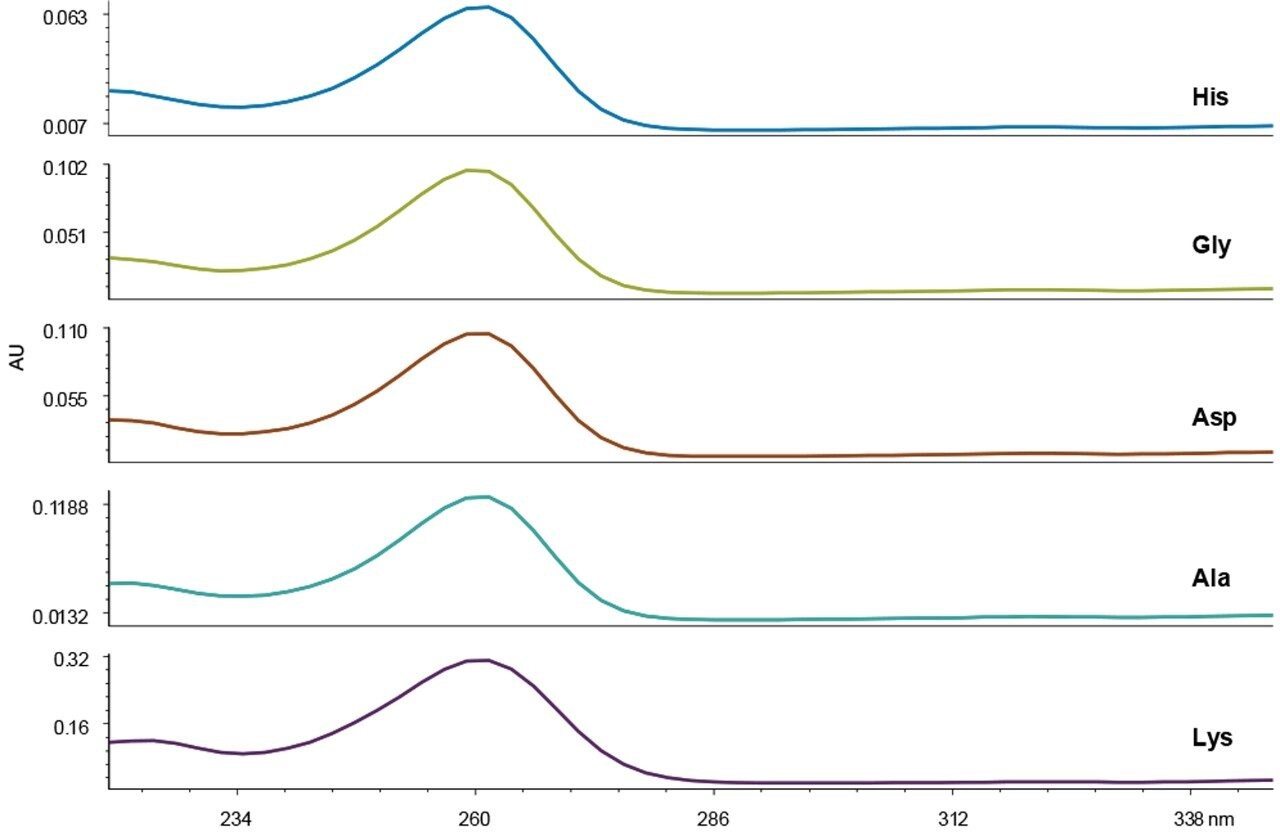
Peak identity and purity are often assessed based on spectral properties using a PDA detector. Figure 3 shows the UV spectra for five examples of AccQ•Tag derivatized amino acids, including acids, bases, neutrals, and doubly-derivatized molecules. The chemical distinctions between amino acids do not yield any useful spectral differences that could be used for peak identification. Therefore, the major value of using a PDA detector in the UPLC Amino Acid Analysis Solution is in the instrument flexibility created for other applications that require its use.

Figure 3. UV Spectra for various AccQ•Tag derivatized amino acids.

Figures 4 and 5 show chromatograms with the same load of BSA hydrolysate on the column. Again, there is a difference in response for the amino acid peaks between the UV and fluorescence detectors. However, since the sample analysis is calibrated against a standard analyzed under the same conditions, no differences in the final result should be expected. 

The accuracy of the results  for both detectors is demonstrated by the quantitative results seen in Table 1. For all sample types, the 75 data points represent five days of analysis, each with independent sample dilutions, fresh mobile phase preparation, and each diluted sample derivatized five separate times, and injected in triplicate. The amino acid composition is expressed as residues per mole of BSA. Tryptophan and cysteine/cystine are excluded from the calculations because they are destroyed by the acid hydrolysis. The measured results for each detector match each other very well in addition to agreeing with the expected composition values

Figure 4. Analysis of BSA hydrolysate sample with UV detection, approximately 9 ng on column.
Figure 5. Analysis of BSA hydrolysate sample with fluorescence detection, approximately 9 ng on column.

Table 1. Comparison of observed with expected composition derived from known sequence of BSA for both UV and fluorescence detection.

*Average of 75 data points (25 derivatizations, each injected in triplicate)

The analysis of complex animal feed hydrolysate samples with both UV and fluorescence detection is shown in Figures 6 and 7. As with the analysis of the BSA hydrolysate, the difference in response for amino acids between the detectors does not mean that one detector is more suitable for quantitation than the other. This fact is further supported by the comparison of measured absolute amounts of the same samples with both detectors. Table 2 shows the mean weight % values for both TUV and FLR for the 75 data points. The ratio of amount of each amino acid to amount of feed hydrolysate was expressed using the residue molecular weights of the amino acids. Since each analysis was calibrated relative to a standard with the same detector, the quantitative results are the same.

The reliability of the method is demonstrated with the reproduc-ibility of the results over a large number of determinations that intentionally includes the variability that would be possible in routine analysis. These variations include multiple columns, elu-ents, and derivatizations. The largest contribution to variability in the method is due to the pipetting steps in the sample preparation. The addition of an internal standard to the sample to be hydrolyzed will correct for pipetting variability. Norvaline is the preferred internal standard for this purpose.

Figure 6. Analysis of soybean meal hydrolysate sample with UV detection, approximately 6 ng on column.
Figure 7. Analysis of soybean meal hydrolysate sample with fluorescence detec-tion, approximately 6 ng on column.

Table 2. Weight/Weight % Comparison of TUV and FLR results for soybean meal hydrolysate; approximately 6 ng hydrolysate injected on column.

*Average of 75 data points (25 derivatizations, each injected in triplicate) ± Standard Deviation

Conclusion

The Waters UPLC Amino Acid Analysis is extended to three detector choices: TUV, PDA, and FLR. All three detectors give the same qualitative and quantitative result.

Historically, fluorescence detection has often been desired in amino acid analysis to provide enhanced sensitivity and to give specificity in the analysis of complex samples. The low variable fluorescence yield for the amino acids means that sensitivity is limited to the least responsive amino acid, specifically tyrosine. The analyses of pure protein and complex animal feed hydrolysates in this experi-ment shows that fluorescence and UV detectors both give accurate and consistent results with the Waters UPLC Amino Acid Analysis Solution.

It is generally true that cleanliness limits the usable sensitivity in any amino acid analysis method. Both the UV and fluorescence detectors give good analytical results well below the typical back-ground limits. The Waters UPLC Amino Acid Analysis Solution provides a complete turnkey analytical method for the analysis of hydrolysate samples that allows the selection of a detector that not only meets the needs of the application, but also that of other assays in the laboratory as well. Regardless of the detector option chosen for the application, the ruggedness of the total system solution ensures highly reliable and rapid identification and quantitation of amino acids, with no interference or ambiguity.

720002913, January 2009

Haut de la page Haut de la page