• Note d'application

Multi Residue Analysis of Priority Pollutants in Drinking and Surface Water Using Solid Phase Extraction and GC Tandem Quadrupole MS/MS

Multi Residue Analysis of Priority Pollutants in Drinking and Surface Water Using Solid Phase Extraction and GC Tandem Quadrupole MS/MS

  • Keith Worrall
  • Timothy Jenkins
  • Waters Corporation

Abstract

The method presented is intended as an example of what is possible by implementing techniques such as GC Tandem Quadrupole MS/MS and solid phase extraction.

Introduction

EU council directive 76/464/EC1 lists 132 compounds that have restricted levels in drinking and surface waters. Of these compounds, 109 are amenable to gas chromatographic analysis. Currently published methods2 involve the use of two injections, one using selected ion recording as a screen, followed by a full scan injection for confirmation. The use of tandem quadrupole GC-MS/MS allows the analyst to combine the screening and confirmatory injections into one run, while also allowing a reduction of the chromatographic separation required for confirmation of some of the target compounds. The EU list has many similarities with the target compound lists of U.S. EPA water quality methods such as 6253 and 82704 (it should be noted that the list analyzed in this method is by no means an exhaustive one). The compound groups represent a wide range of polarities and compound types, and include benzidines, chloronitrotoluenes, organochloro pesticides, organophosphorus pesticides, chloroanilines, chlorophenols, chloronitrobenzenes, chlorotoluidines, phenylurea pesticides, PCBs, semi-volatile halogenated compounds, PAHs (Polynuclear Aromatic Hydrocarbons), triazines, and volatile amines.

Many of these compound groups will typically have their own dedicated analysis method that requires specific extraction/clean-up and final analysis.

Combining these groups into a single method would allow the laboratory to significantly increase sample throughput. The high selectivity and specificity of multiple reaction monitoring (MRM) acquisitions also help to shorten the time required for data processing by reducing the possibility of false positives and time spent confirming the presence of target compounds. The method presented is intended as an example of what is possible by implementing techniques such as GC Tandem Quadrupole MS/MS and solid phase extraction.

Experimental

Methods and Materials

All chemicals were obtained from Sigma-Aldrich, with all compounds having >99.5% purity. All analyses were performed using an Agilent 6890 GC oven fitted with a CTC Combi PAL Autosampler.

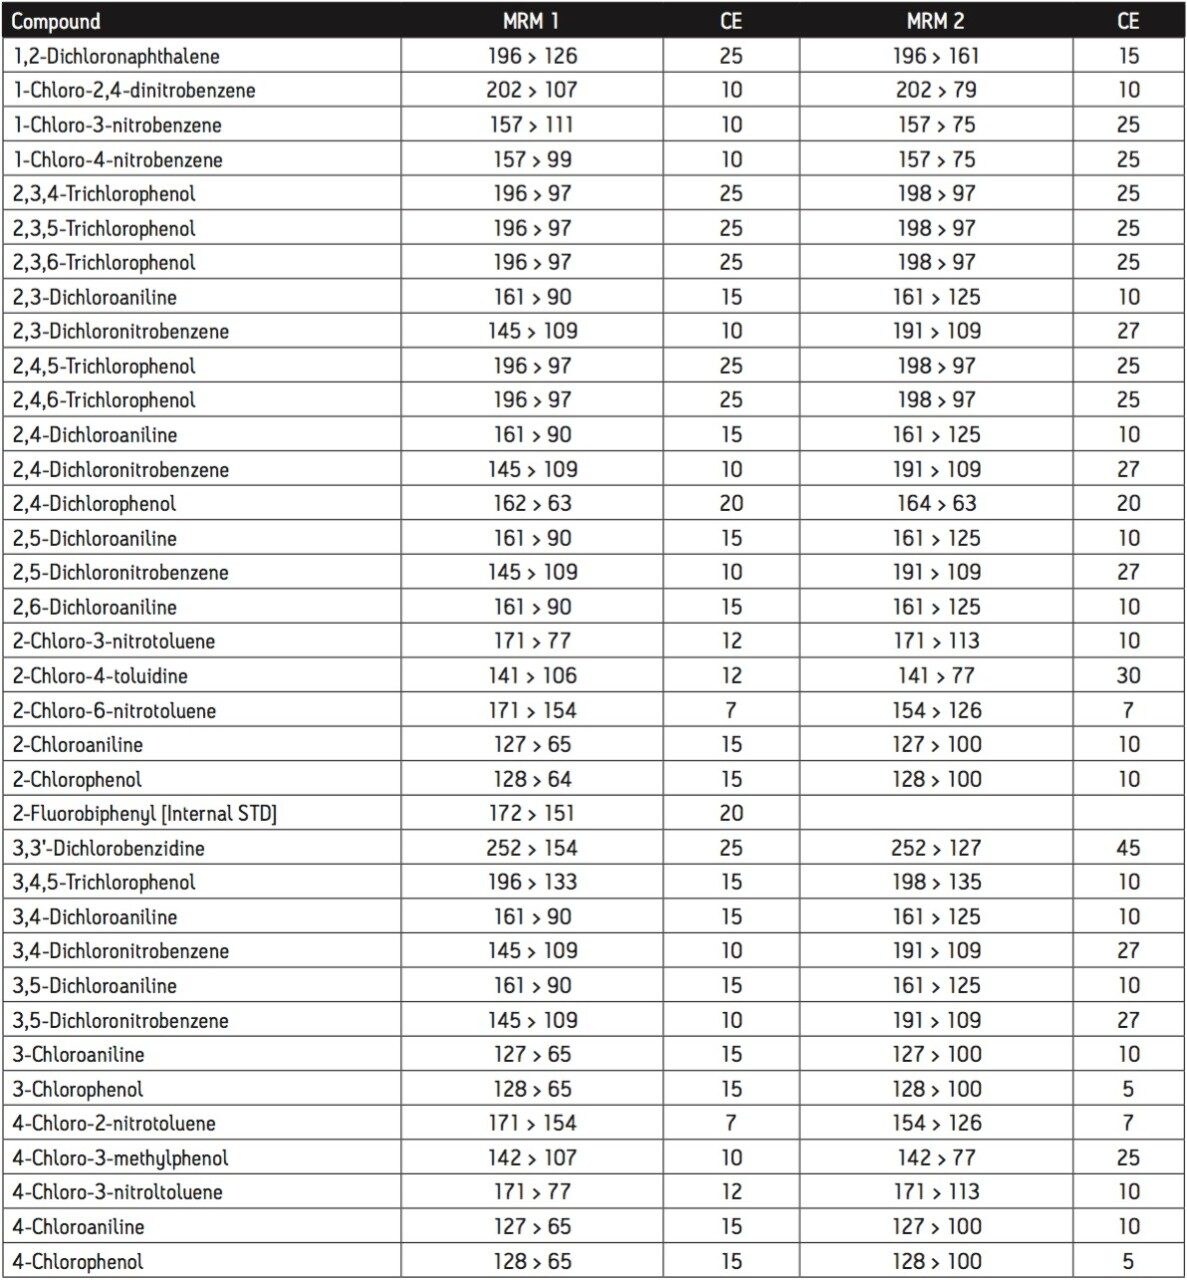
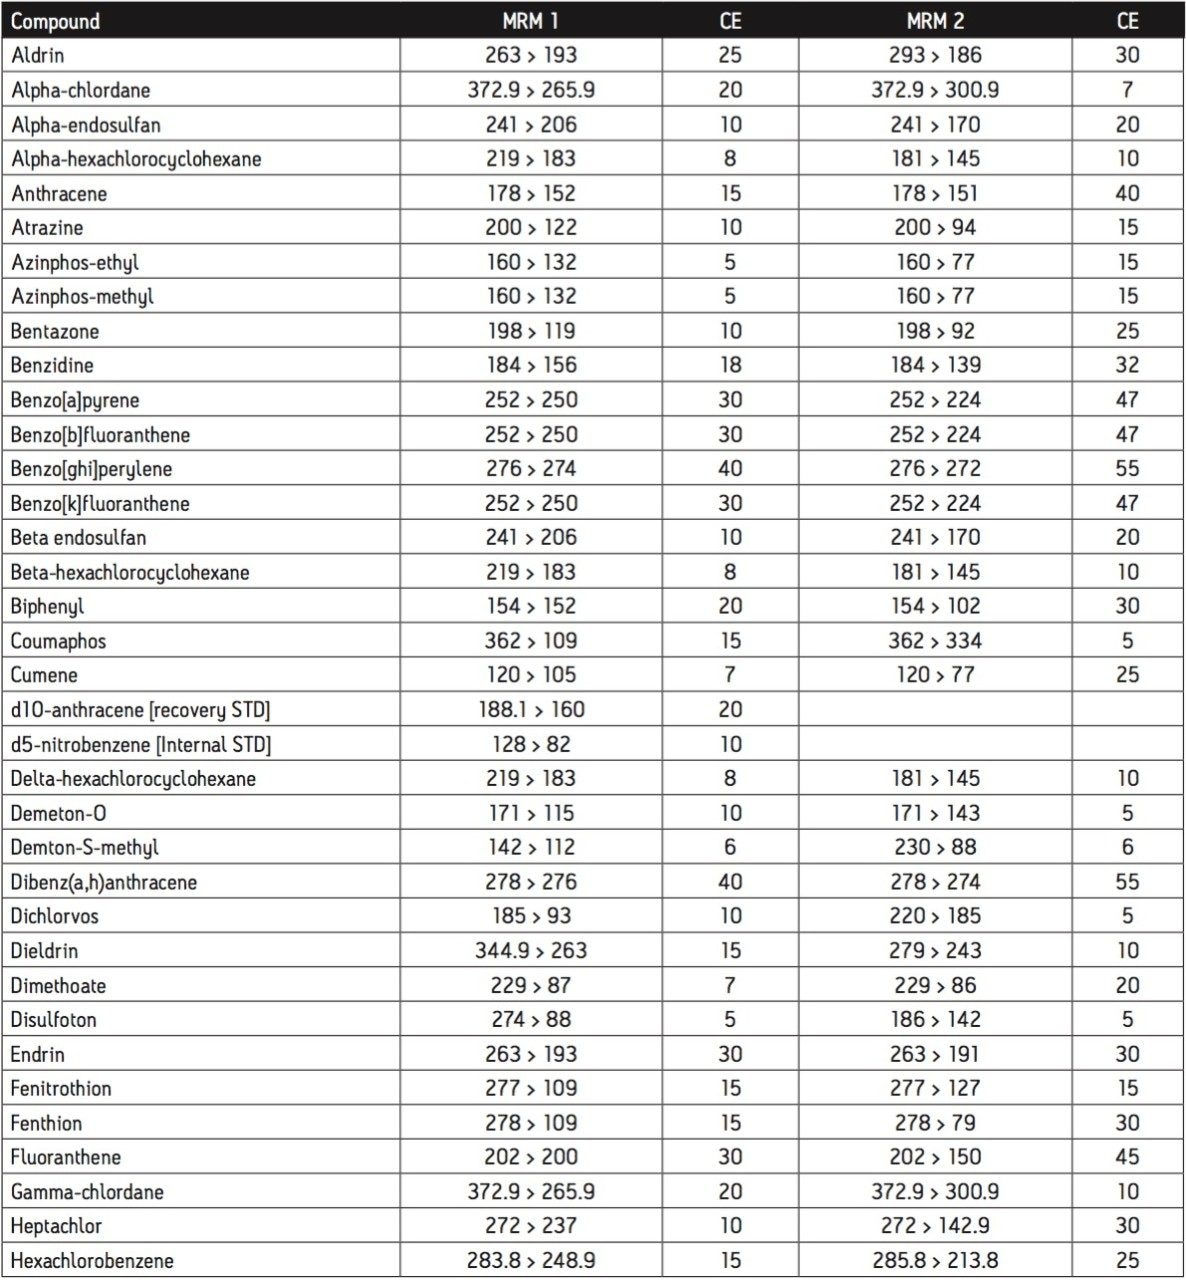
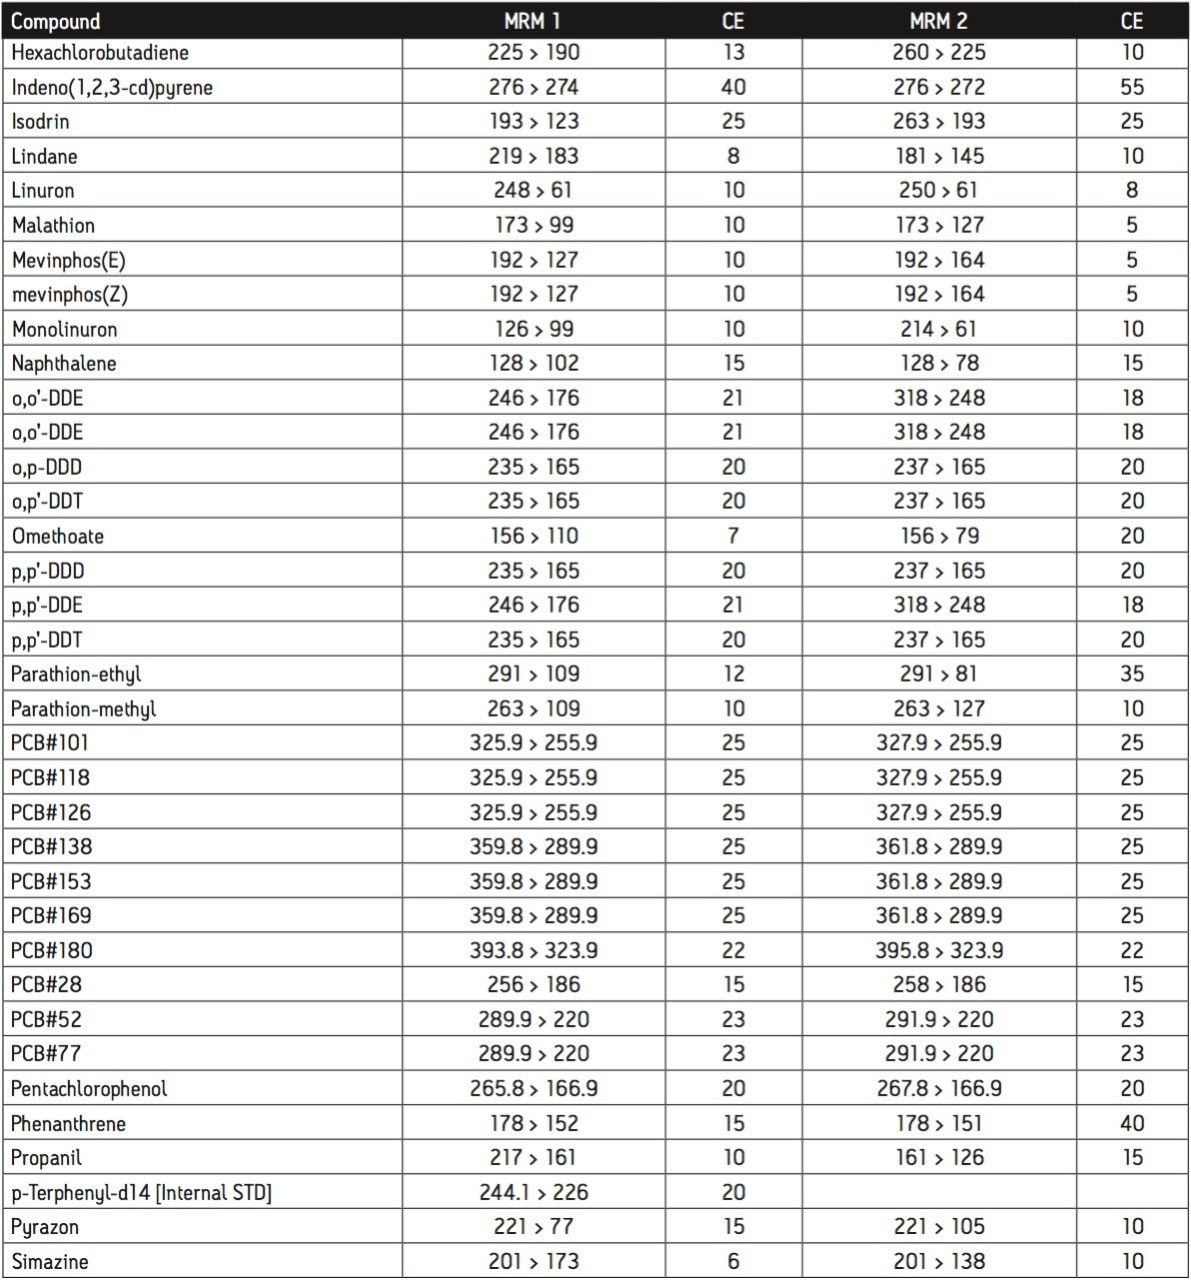
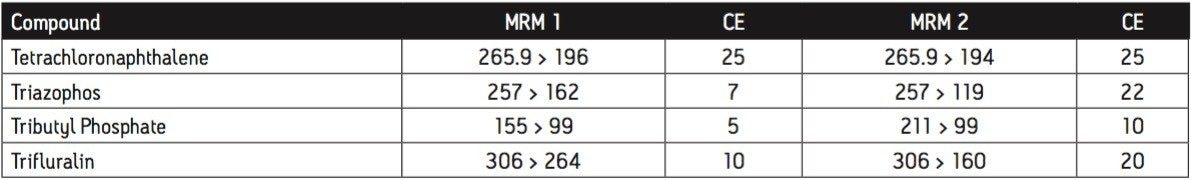
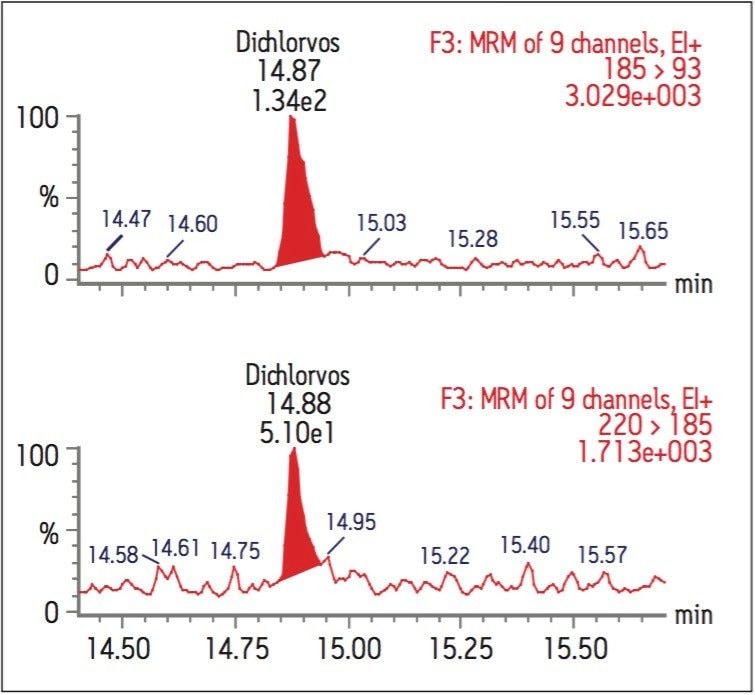
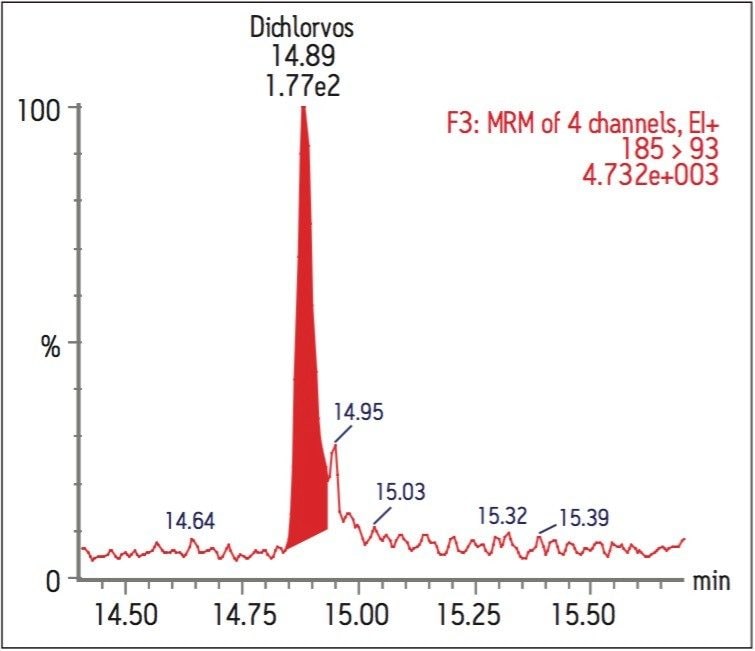
The GC was directly interfaced to a Waters Quattro micro GC Tandem Quadrupole Mass Spectrometer that was operated in the EI+ ion mode. The instrument ion source was operated at 70 eV electron energy, with a source temperature of 180 °C. Three GC columns were evaluated, J&W DB17-ms 30 m 0.25 mm ID, .25 μm df, Restek RTX-5, 40 m 0.18 mm ID, 0.2 μm df and Varian factor four vf5-ms 30 m 0.25 mm ID, 0.25 μm df. Injections were made using both pulsed splitless and cool on column (COC) injections, with a 2 m 0.53 mm ID retention gap fitted for COC injections. All compounds were acquired in full scan and daughter scanning acquisition modes, with the results used to optimize at least two MRM transitions per compound. Internal and recovery standards had one MRM transition optimized. MRM analysis was performed using a single transition per compound, where confirmation is based upon one MRM transition plus the retention time, and also using two MRM transitions per compound, where the strictest EU confirmatory criteria are satisfied. The difference in sensitivity between the two approaches was compared. The three GC Columns were assessed for chromatographic resolution of critical pairs of co-eluting peaks, overall run time, and sensitivity of active components. All standards were prepared from >99.5% purity solids dissolved in dichloromethane (DCM), with a mixed standard being prepared at a concentration of 5 ng/L in DCM, and also acetone (for spiking purposes).

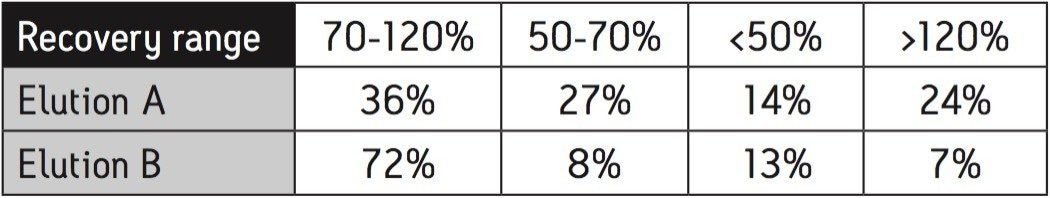
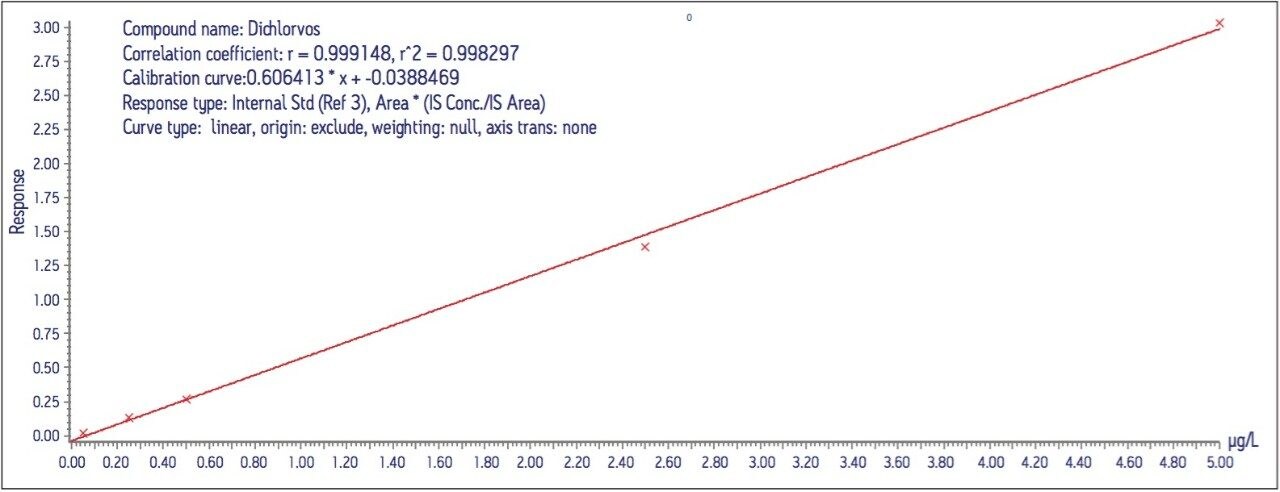
Calibration curves were acquired over the concentration range of 0.05 to 5 μg/L. Extraction and clean-up were performed using Waters Oasis HLB 3cc, 60 mg SPE cartridges. 200 mL of each filtered water sample was spiked with an internal standard mixture containing d5-nitrophenol, 2-fluorobiphenyl and p-terphenyl-d14 at a level of 500 ng for each component. The water was adjusted to pH4 using 1 N HCl solution. The SPE cartridges were conditioned with 6 mL DCM, 6 mL acetonitrile and 6 mL of water at a flow rate of 3 mL/min. The water samples were then loaded at a flow rate of ca 6 mL/min. After sample loading was completed, the cartridges were washed with 1 mL water. The cartridges were then dried under a flow of nitrogen (ca 1 mL/min) for 20 mins, followed by final elution with either A. 2.5 mL DCM/ACN (4:1), 5 mL DCM; or B. 5 mL DCM. After elution, the extract was adjusted to a volume of ca 0.5 ml under a stream of dry nitrogen at ambient temperature, followed by the addition of 500 ng of d10-anthracene as a recovery standard. Drinking and canal water samples were spiked with the analytes at concentrations of 0.5 μg/L and 5 μg/L prior to extraction for recovery tests.

The GC temperature ramps employed were:

30 m DB17-ms

40 °C/1 min, 3 °C/min to 160 °C, 7 °C/min to 240 °C, 15 °C/min to 305 °C, hold 15 mins. 1 mL/min He flow

40m RTX5

40 ° C/1 min, 3 °C/min to 160 °C, 7 °C/min to 240 °C, 15 °C/min to 310 °C, hold 15 mins. 0.7 ml/min He flow

30 m vf5-ms

40 °C/0.8 min, 6 °C/min to 160 °C, 8 °C/min to 310 °C, hold 2 mins. 0.9 mL/min He flow

All injections in pulsed splitless mode were made with an injection temperature of 250 °C, using a double gooseneck 4 mm ID liner and 1 μL injection volume. The injections were made with a 1 min 110 kPa pulse, a purge time of 1 minute and a purge flow of 70 mL/min.

Cool on column injections were made in track oven mode.

Data were acquired with Waters MassLynx Software and processed with Waters TargetLynx Application Manager.

Results and Discussion

The optimized MRM transitions for the compounds analyzed are presented in Table 1. The transitions given in the MRM 1 Column were used as the quantification transition for the confirmatory method, and as the analytical transition for the screening method. The three GC Columns were evaluated for both sensitivity and chromatographic separation. The optimum conditions for separation were obtained using the DB17-ms column with COC injection. However, these conditions resulted in a 70 minute run time, with a 22 function MRM experiment required. Figure 1 shows the reconstructed TIC chromatogram from a 1 ng/μL (5 μg/L) injection in MRM mode. Figure 2 shows the separation obtained for the two main critical pairs (E/Z Mevinphos and o,p'-DDT and p,p'-DDD). The DB17-ms column showed excellent selectivity for these compounds, as well as achieving baseline separation of 3-chlorophenol and 4-chlorophenol. The COC injection technique was found to be less robust when compared with pulsed splitless injection, and was not deemed suitable for a high throughput screening method. However, due to the possibility of larger volume injection, it would be suitable for maximizing sensitivity within a high sensitivity confirmatory method.

Table 1. (continued) Optimized MRM transitions for analytes and internal/recovery standards.

Analysis using the vf5-ms Column, combined with pulsed splitless injection afforded the best overall compromise of separation: sensitivity and robustness. This analysis was the most suitable option studied for a robust, high throughput screening/confirmatory method. The vf5-ms resulted in a total run time of <43 minutes, requiring 19 MRM time windows to be employed for confirmatory analysis. Due to the distribution of eluting peaks, it also afforded the opportunity for overlapping time windows in some areas of the elution range. This gives more flexibility if retention times were to change for any reason (typically as the GC Column is shortened during its lifetime). The separation of the previously mentioned critical pairs (Mevinphos, DDD/DDT) was also adequate. Figure 3 shows the reconstructed TIC from a 1 ng/μL (5 μg/L) injection acquired in MRM mode. Figure 4 shows the separation of the critical pairs (E/Z Mevinphos and o,p'-DDT and p,p'-DDD). The RTX5 Column resulted in comparable separation but a longer run time when compared with the vf5-ms. The pulsed splitless injection combined with vf5-ms separation was adopted for all further analyses.

The 0.5 μg/L spiked water samples were analyzed and quantified to determine the specific recoveries for >100 compounds using the single SPE sorbent, with a single extraction procedure. Table 2 summarizes the recoveries achieved for the compounds, using both elution methods (A. 2.5 mL DCM/ACN [4:1], 5 mL DCM; B. 5 mL DCM), showing the percentage of compounds that fit within each recovery range.

Table 2. Summary of extraction recoveries, expressed as percentage of total number of compounds within each range. Based upon average of five replicates.

Elution method B was found to give the best overall performance with 72% of compounds recovered within the range 70-120%. The compounds recovered <50% included compounds such as disulfoton, which undergoes rapid degradation5 in aqueous solution.

Other compounds within this range were the benzidines and bentazone, compounds which are either more suitable for LC-/MS/MS determination, or require derivatization prior to GC based analysis. Elution method B also gave poorer recoveries for 4-chloroaniline and 3,4,5-trichlorophenol (average recoveries; n=10; 32%, 14% respectively).

However, the use of elution method A resulted in a number of difficulties, with degradation of chromatographic performance due to residual ACN in the extracts, and drastically reduced recovery of lower boiling compounds, such as cumene and hexachlorobutadiene. As a result, elution method B was adopted for the final method. The chart shown in Figure 5 depicts the average recoveries (based upon 5 replicates) for all of the compounds analyzed. Some of the recoveries >100% can be explained by reduced internal standard recoveries given that all blanks were residue free. Overall, the distribution of recoveries for such a wide range of polarities, boiling points, pKa’s and water octanol partition coefficients (Kow) using a single SPE sorbent is excellent.

Figure 5. Distribution of average recoveries (n=5) for elution method B (5 mL DCM).

The method LODs were assessed, both for the confirmatory (two MRM transitions per compound) and screen (single MRM transition per compound. All LODs are based upon a signal to noise ratio of 3:1, using the confirmatory transition (where applicable). The instrumental LODs are based upon the lowest concentration standard injection where possible. The method LODs are based upon the average LOD obtained from 5 replicate 0.5 μg/L spiked water samples, extracted using elution method B. Table 3 summarizes the LOD’s achieved. Figure 6 gives a graphical representation of the LODs for all compounds determined, showing the distribution of LOD across the complete range of compounds analyzed. The LODs reported are excellent for such a wide range of compounds with a single generic extraction, with many method confirmatory LODs in the low ppt (ng/L) range.

Table 3. Summary of instrumental and method LODs, based upon average of 5 replicates for method LOD calculations, showing number of compounds within each range.
Figure 6. Distribution of instrumental and method LODs for all compounds.

The overall linearity of the method is excellent with >95% of the compounds having coefficients of determination (r2) >0.99. Coupled with this is the excellent agreement of detected ion ratios, compared with theoretical ratios. Figure 7 shows the chromatograms for both MRM transitions for dichlorvos, detected at a concentration of 0.05 μg/L using the confirmatory method. The chromatograms show excellent signal to noise, and the presence of the compound is confirmed by an actual ion ratio of 2.62 (-3.2%) compared with a theoretical ratio of 2.70.

Figure 7. Dichlorvos at a concentration of 0.05 μg/L, demonstrating detection and confirmation at low concentration.

The same concentration acquired using the single MRM transition screening approach is shown in Figure 8, demonstrating the excellent sensitivity that can be achieved. Figure 9 shows the linearity that can be achieved, showing an excellent coefficient of determination (r2) of 0.998 for dichlorvos of the concentration range 0.05 to 5 μg/L.

Figure 8. Dichlorvos at a concentration of 0.05 μg/L, demonstrating detection and confirmation at low concentration.
Figure 9. Dichlorvos linearity over the concentration range 0.05 to 5 μg/L.

The reconstructed TIC for a canal water extract is shown in Figure 10, with Figure 11 showing the reconstructed TIC a portion of the same sample spiked at a level of 0.1 μg/L prior to extraction and analysis. No target peaks were detected above the LOD in the unspiked sample.

Figure 10. Reconstructed TIC for a canal water extract.
Figure 11. Reconstructed TIC for a 0.1 μg/L spiked canal water extract.

Conclusion

The analysis of pollutants in water requires the laboratory to analyze a large number of samples for a wide range of compounds. The analysis can be time consuming requiring the application of a number of different methods for different compound groups. The method described here presents the laboratory with the opportunity to combine a number of these class specific analyses into a single method that can result in the reduction of sample turnaround times. The use of solid phase extraction, combined with GC-MS/MS detection allows the laboratory to achieve much greater confidence in results obtained. Additionally, the laboratory can reduce solvent usage and improve analyte recovery during sample preparation when compared with traditional liquid-liquid techniques.

References

  1. Directive 76/464/EEC, Dangerous Substances Discharged into the Environment, Official Journal of the European Union No. L 129, Brussels, 1976.
  2. Lacorte, S., Guiffard, I., Fraisse, D., Barceló, D. Anal. Chem., 2000, 72,1430–1440; Broad Spectrum Analysis of 109 Priority Compounds Listed in the 76/464/CEE Council Directive Using Solid Phase Extraction and GC/EI/MS.
  3. U.S. EPA method 625, Base/Neutral and Acid Organics in Wastewater, U.S. EPA National Exposure Research Laboratory (NERL) Microbiological and Chemical Exposure Assessment Research Division (MCEARD), Cincinnati, OH.
  4. U.S. EPA method 8270, Semivolatile Organic Compounds by GC/MS, U.S. EPA Office of Solid Waste (OSW) Methods Team, Ariel Rios Bldg. (5307W), 1200 Pennsylvania Ave. NW, Washington, DC 20460.
  5. Lacorte, S., Lartiges, S., Garrigues, P., Barceló, D. Environ. Sci. Technol., 1995, 29 (2), 431–438.

720001438, June 2007

Haut de la page Haut de la page