MALDI and DESI: Complementary Lipid Imaging on a Single Mass Spectrometry System
Mark Towersa, Nuria Sliijkhuisb, Lisa Towersa, Emmanuelle Claudea, Joanne Ballantynea, Gijs Van Soestb
a Waters Corporation, Wilmslow, United Kingdom
b Department of Cardiology, Cardiovascular Institute, Thorax Centre, Erasmus MC, Rotterdam, The Netherlands
Published on April 14, 2026
Abstract
In this study, both MALDI (matrix-assisted laser desorption/ionization) and DESI (desorption electrospray ionization) are examined to evaluate how they can be used complementarily to identify lipids in heterogeneous tissue sections, specifically atherosclerotic plaques. Atherosclerotic plaques are a condition in which lipids accumulate in the blood-vessel wall; if these plaques break from the blood-vessel wall, it can lead to heart attacks, strokes or localized tissue damage/death. Understanding the plaque lipid compositions could help identify the likelihood of detachment from the blood-vessel wall. Therefore, with a primary focus on lipid detection and aiming to ionize as many lipid species as possible, the analysis was conducted on complementary MALDI and DESI Imaging techniques. The differences between spectral profiles, sensitivity, and image quality generated by these two ionization modes were investigated. The study demonstrates that both MALDI and DESI are equally suitable for detecting a wide range of lipids in atherosclerotic plaque sections and shows how these orthogonal techniques can be used to increase compound coverage or be selected to favor particular classes of lipid.
Benefits
- A significant number of lipid species can be detected and putatively identified using both MALDI and DESI Mass Spectrometry Imaging (MSI) techniques. Either technique could be implemented independently and provide the user with a large lipid coverage
- MALDI and DESI are complementary, with each ionization technique offering a number of putative lipid identifications not identified by the alternate ionization method. Therefore, lipid coverage can be increased utilizing both ionization techniques together on the same tissue
- Images generated by both MALDI and DESI are comparable when displayed in High-Definition™ Imaging (HDI™) Software
Introduction
MSI is a powerful tool that allows a user to not only identify marker compounds within a complex matrix – such as tissue sections – but also allows visualization of spatial localization of these compounds. This enables a deeper dive into biological relevance versus homogenized tissue extracts analyzed by more traditional liquid chromatography-mass spectrometry (LC-MS) applications. Additionally, with LC-MS applications, tissue requires considerable and lengthy sample preparation that can lead to compound losses: homogenization to release the compounds of interest, extraction to solubilize the intended classes of compound, and clean-up to ensure no solid material is injected onto the column causing blockage. Whereas with MSI, significantly less sample preparation is required once a tissue has been sectioned, MALDI only requires the section to be coated in a suitable matrix prior to analysis, and DESI analysis needs no further sample preparation.
Historically MSI has relied heavily on MALDI and many advances have been made within this technique. However, in the last few years, the availability and increased usability of DESI has increased popularity of this imaging technique and allowed these two orthogonal imaging platforms to become equally valid.
MALDI requires the application of a matrix layer on the surface of the tissue section. The matrix selectively draws out compounds from the tissue and then crystallizes as it dries, enabling compound ionization when desorbed by laser irradiation. As such, the selection of the matrix can be optimized toward the detection of compounds of interest, producing a much more targeted approach. The method of matrix application can have a large effect on analyte intensity and image resolution.
DESI utilizes a spray of charged microdroplets to desorb and ionize molecules from the sample surface, thus requiring minimal sample preparation and without the need for application of matrices. Another advantage to DESI is that, upon analysis, minimal disruption or damage is caused to the surface of the tissue making it a much ‘softer’ ionization than MALDI. This allows for multiple analyses of the same tissue area or the ability to utilize the same tissue section for orthogonal techniques such as MALDI or histological staining.
Having access to two distinctly different ionization modes provides the user with a more tailored approach to their MSI analyses. This can improve study outcomes by offering complementary ionization modes to increase compound coverage and potentially improve the study outcome.
Atherosclerosis is a condition whereby lipids accumulate in the blood-vessel wall causing the formation of plaques.1 If these plaques break from the blood-vessel wall, a thrombus is released, which can travel to another area of the body and cause blockage leading to heart attacks, strokes, or localized tissue damage/death. Understanding the different lipid compositions of these plaques could help identify the stability of the plaques and their likelihood of detachment from the blood-vessel wall. Being a lipid-rich target application, it was important to detect and identify as many lipid analytes as possible. With this in mind, the analysis was conducted using both MALDI and DESI Imaging techniques. These are complementary to one another with their sample preparation and ionization modes favoring different lipid species to one another. Here, a SYNAPT™ XS Mass Spectrometer (MS) is utilized to image sections of atherosclerotic plaques by both MALDI and DESI ionization to investigate lipid profile and distribution.
MS Conditions
|
MS system: |
SYNAPT XS Mass Spectrometer |
|
Ionization mode: |
Positive |
|
Acquisition range: |
100–1200 |
|
Analyzer mode: |
Sensitivity |
|
Experiment type: |
MS |
DESI Setup
|
Capillary voltage (kV): |
0.6–0.8 |
|
Cone voltage (V): |
30 |
|
Source temperature (°C): |
150 |
|
Nitrogen flow (psi): |
10–15 |
|
Solvent: |
98% Methanol 2% Water |
|
Solvent flow rate: |
2 µL/min |
|
Heated transfer line temperature (°C): |
250 |
|
Pixel size: |
100 µm |
|
Step rate: |
200 µm/s |
|
Equivalent scan speed: |
2 scans per second |
MALDI Setup
|
Laser frequency: |
1 KHz |
|
Laser attenuation: |
260 |
|
Shots per pixel: |
500 |
|
Cooling gas: |
50 ml per min |
|
Pixel size: |
100 µm |
|
Equivalent scan speed: |
2 scans per second |
Experimental
Sample Preparation
Carotid plaques (n=14) were removed from patients undergoing carotid endarterectomy, snap-frozen, and stored at -80 ºC prior to analysis. For analysis, the plaques were cut into 3 mm cross-sections and embedded in 10% porcine type A gelatin. These blocks were then cryosectioned at 10 µm.
For MALDI, the matrix was a 10 mg/mL solution of 2,5-dihydroxybenzoic acid (DHB) (Sigma-Aldrich®) prepared in 70% Acetonitrile (aq). Matrix was applied to the tissue surface using a SunCollect sprayer (SunChrom), 25 layers were applied with a line spacing of 1.5 mm, a nebulizing gas (nitrogen) at 1.7 bar and a flow rate of 20 µL per min. Analysis was performed on a MALDI SYNAPT XS Mass Spectrometer.
For DESI, the sections were analyzed with no further treatment. Analysis was performed on a SYNAPT XS Mass Spectrometer coupled to a DESI XS Source, equipped with a high-performance sprayer and heated transfer line.
Data Processing
MS data were manually assessed using MassLynx™ MS Software prior to being processed in HDI Software (V1.9.1) for image visualization. All tissues were used to generate an acquisition specific target list of the top 2000 analytes and a single tissue data file was processed using this target list. The target list processed datafile was imported into Analyte Browser (v2.2.2) Database. Searching software and lipid identification were performed against a LIPID MAPS® database with a ±5 ppm mass accuracy cutoff.
Please note that phosphatidylcholine lipids (PC) and phosphatidylethanolamine (PE) lipids have been grouped together for identification purposes. These analyses were performed in MS only mode and, as such, there is no associated head group data to differentiate these two lipid classes. When analyzed in positive ionization mode, PCs are known to be preferentially ionized; however, a contribution from the isomeric PE cannot be discounted.
Results and Discussion
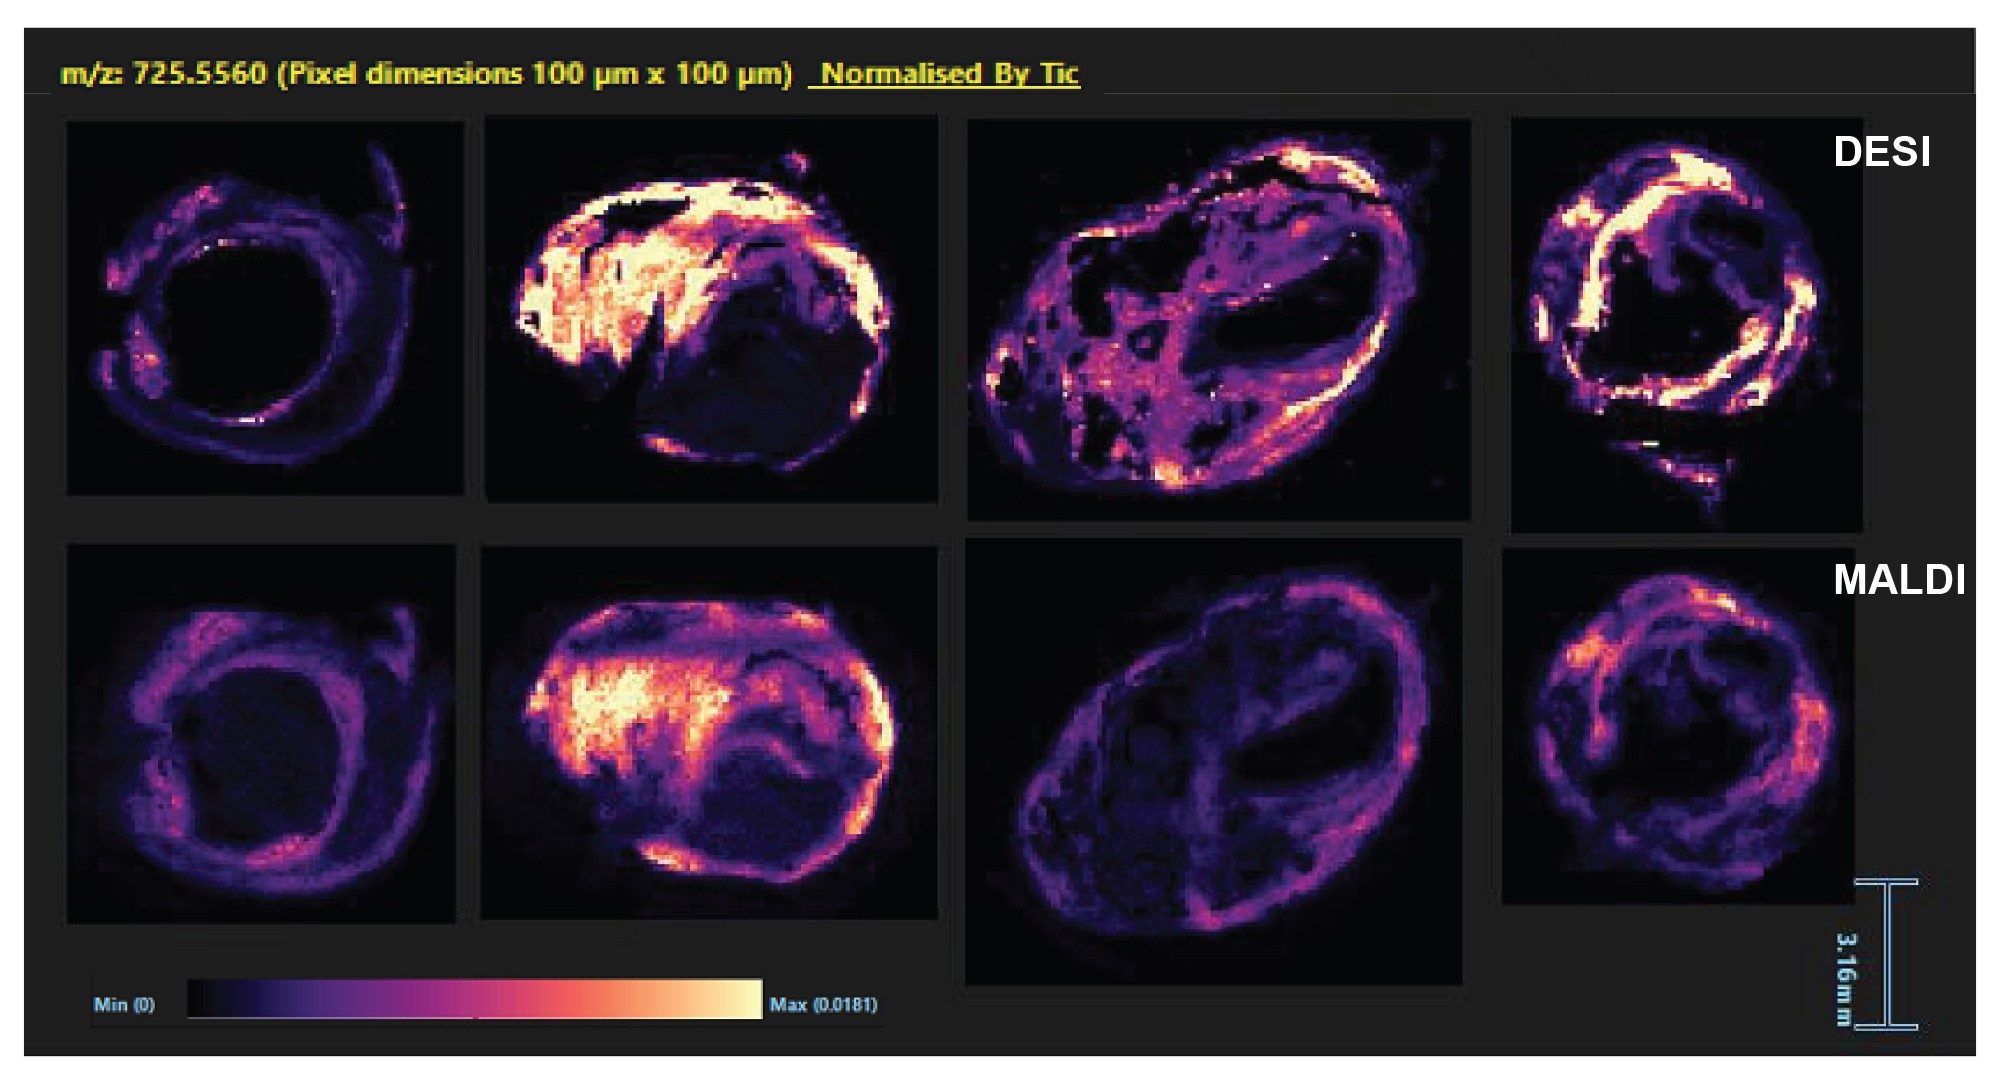
For this analysis, 14 carotid artery atherosclerotic plaque sections were imaged, each taken from individual patients undergoing a carotid endarterectomy. The MSI was performed on consecutive sections to ensure comparable analyses between the two ionization modes. Initially, data from all 28 individual images were imported into HDI Software for visualization. It was observed that all analyses strongly detected a lipid signal with an m/z 725.5560, putatively identified as SM 34:3. As such, this was chosen for display purposes. It can be seen in Figure 1 that the images generated by both DESI and MALDI MSI techniques are comparable and the distribution of the analyte is consistent. For these images, the data has been normalized by total ion count (TIC) and the scale maximum set to be the same for each tissue section to simplify the visual. From this, it can be seen that the distribution and relative intensity of the analyte varies between the individual plaques and that the DESI may ionize this lipid slightly better than the MALDI. The DESI images also appear to have sharper definition between the features of the section suggesting a slightly higher image resolution than seen with the MALDI. This could be due to MALDI matrix application. These analyses were acquired using large 100 µm x 100 µm pixels. As such, should a user require a higher image resolution, the pixel size could be reduced for either technique.
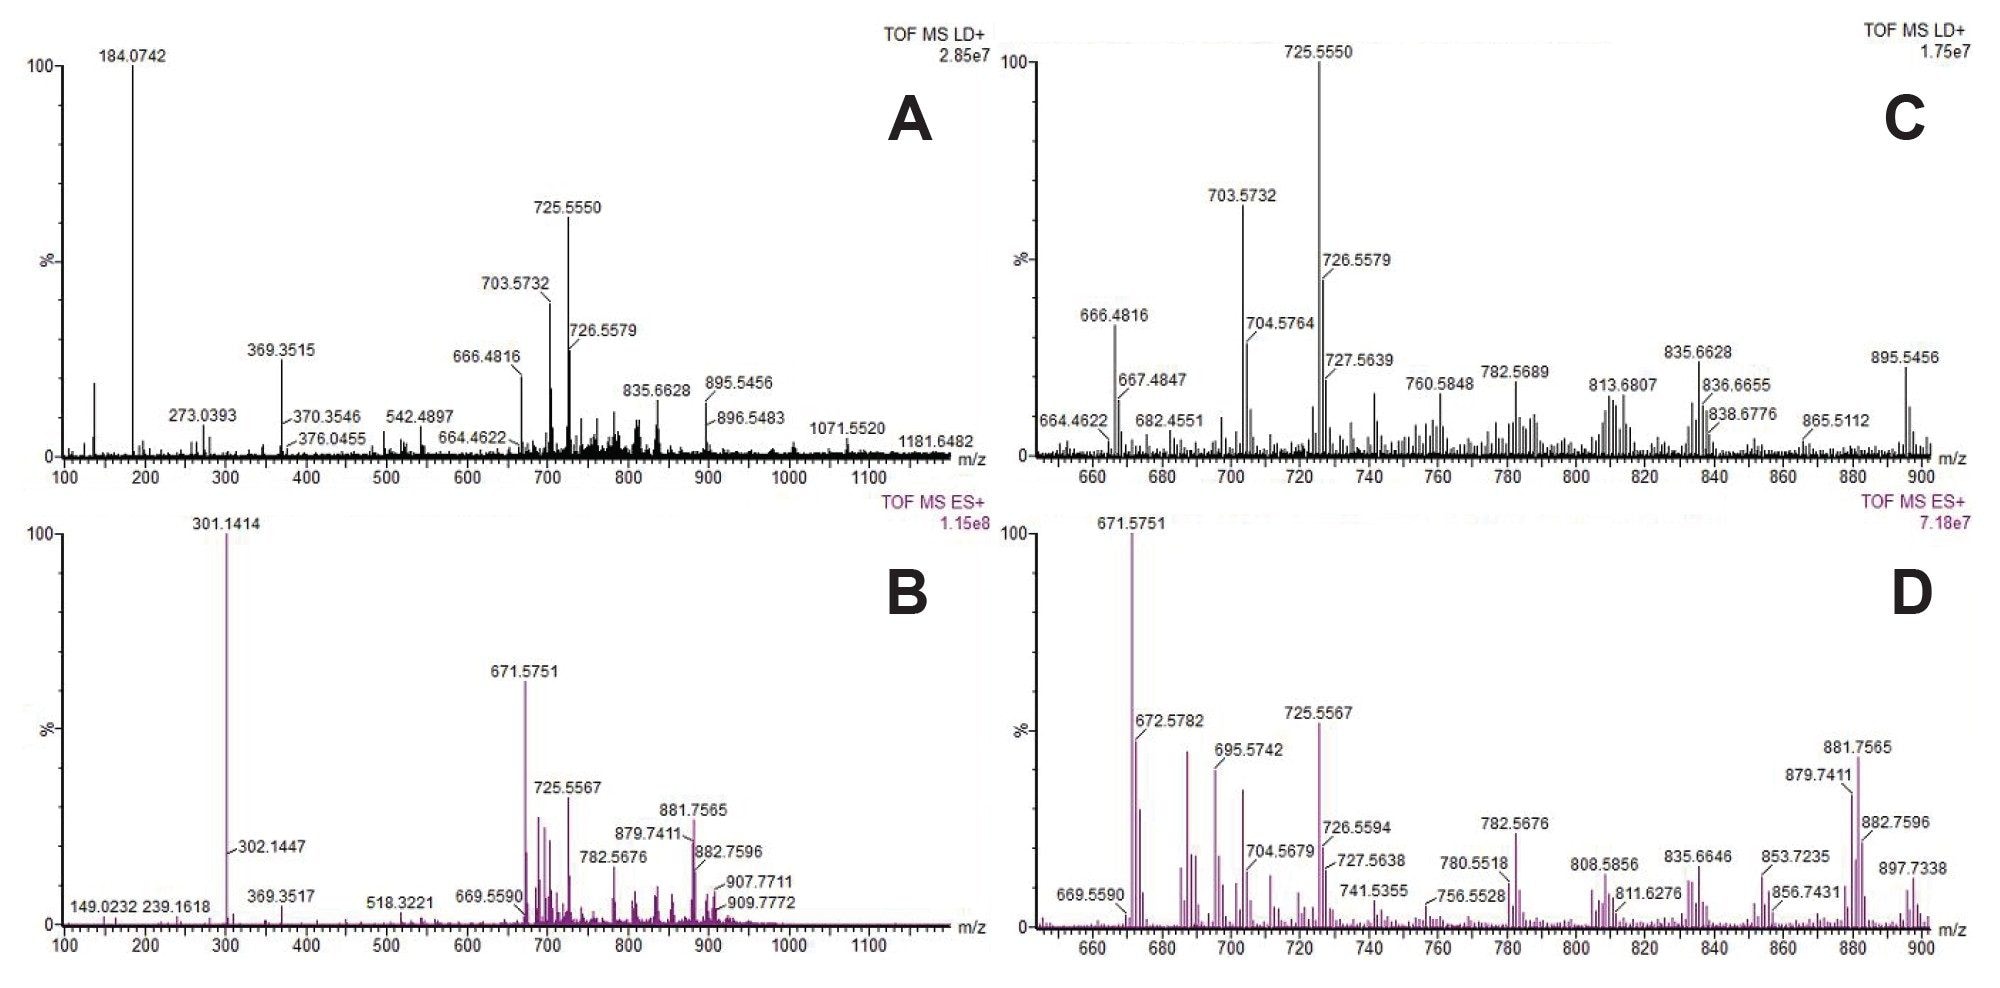
From the HDI, generated images regions of interest (ROIs) were drawn totaling 100 pixels on a lipid dense region of each of the tissue sections. Figure 2 shows an example of spectra (displayed in MassLynx Software) from both DESI and MALDI acquisitions of the same carotid plaque. Figure 2 A (MALDI) + B (DESI) shows the full spectral range of 100–1200 Da. This indicates that the MALDI acquisition (A) is possibly causing a degree of lipid fragmentation, as there is a strong signal seen at m/z 184.074, a fragment mass associated with the head group of a phosphocholine lipid. The DESI (B) analysis has a strong signal at m/z 301.14. This is also seen strongly off tissue and is therefore a solvent/background contaminant. Both the MALDI and DESI spectra show a good signal in the ‘lipid’ mass range (~650–900 Da) and this area is shown at higher magnification in Figure 2 C (MALDI) + D (DESI). Visually, there are differences in the lipid profile between the MALDI and the DESI spectra. It can also be noted that the overall DESI signal intensity is slightly higher than the MALDI signal intensity for these analyses.
Lastly, HDI was used to process each sample with a top 2000 most intense peaks. A ‘target list’ was then generated from all 14 samples of each mode and a single sample as a representative was processed. This sample was then uploaded into the analyte browser MicroApp, and a Lipid Maps database was used for putative identifications. Tentative identification was performed using a ±5ppm mass accuracy threshold only. The features include ionization states [M+H]+, [M+Na]+, and [M+K]+ which means some identical annotations can occur in different forms. Therefore, identification data were exported into Excel and any duplicate molecular formulas were removed. Duplication can be caused by either multiple adduct formation or by similar mass values resulting in matching identifications.
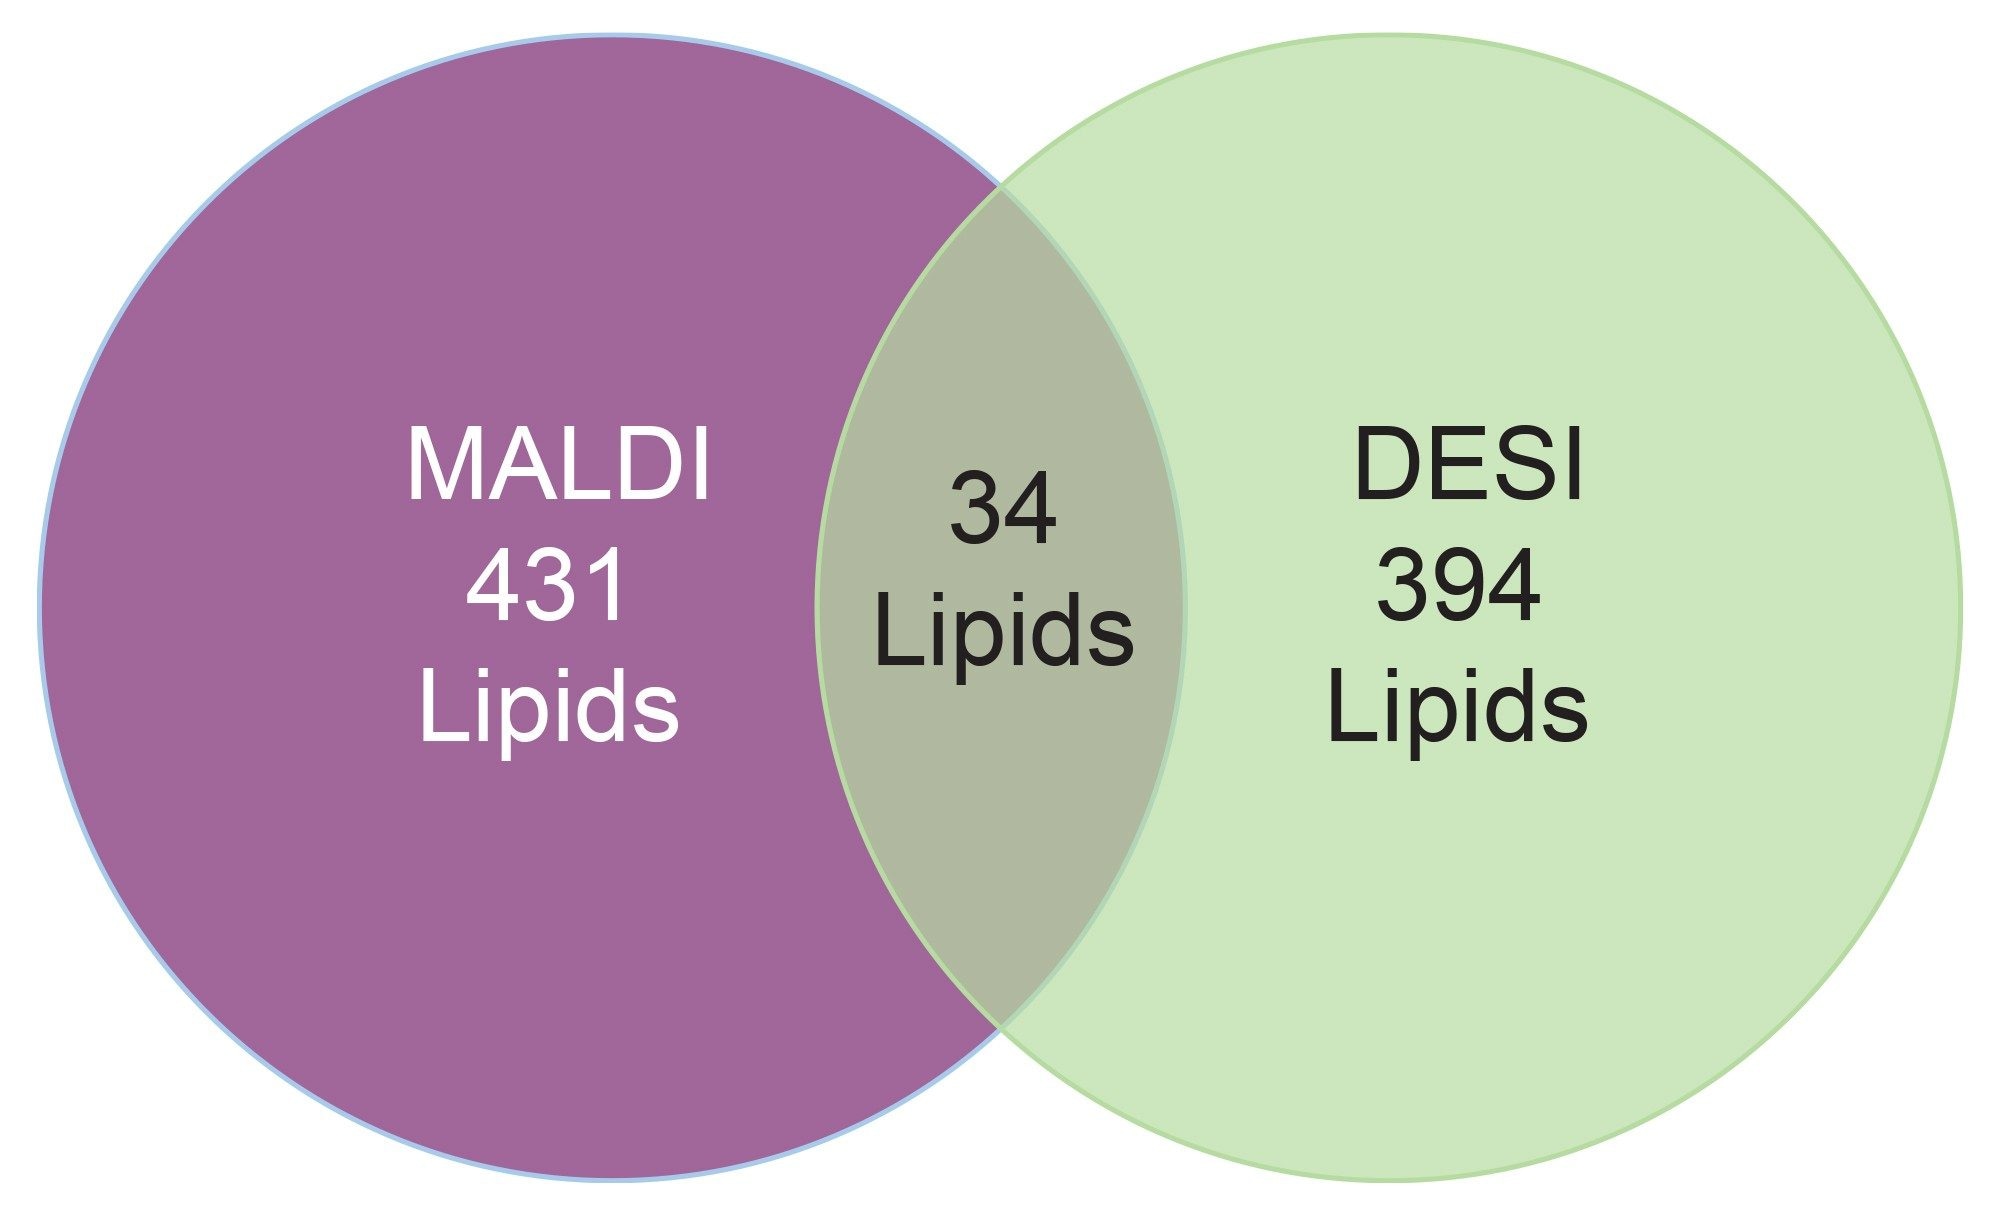
Once duplicate formulas had been deleted, there were a total of 465 unique lipids tentatively annotated within the MALDI sample set and 428 unique lipids tentatively annotated within the DESI sample set. Among these unique lipid annotations, 34 lipids were commonly detected by both MALDI and DESI. Whereas, a significant number of annotations were exclusive to each ionization technique, with 431 lipids only observed in the MALDI analysis and 394 lipids only observed in the DESI analysis (Figure 3). This suggests that the techniques are highly complementary giving a broad lipid coverage when a sample can be analyzed utilizing both ionization techniques.
Digging deeper into this identification data, from all tissue acquisitions of carotid plaques, a number of different lipid classes were tentatively identified. Classes were defined as any lipid sub-class which contained >15 lipids when the MALDI and DESI identifications were combined. Any sub-class which did not meet this criteria were grouped together in Class (other).
Using this criteria, the putatively identified lipids were split into 26 lipid sub-classes, namely: ceramides, diradylglycerols, eicosanoids, fatty acids and conjugates, fatty acids (other), fatty acyl glycosides, fatty amides, fatty esters, glycerolipids (other), glycerophosphates, glycerophosphoglycerols, glycerophosphoinositolglycans, glycerophosphoinositols, isoprenoids, neutral sphingolipids, oxidized glycerophospholipids, phosphocholines and phosphoethanolamines, phospholipids (other), phosphoserines, phosphosphingolipids, secostreroids, sphingolipids (other), steroid conjugates, steroids (other), sterols, and triacylglycerols.
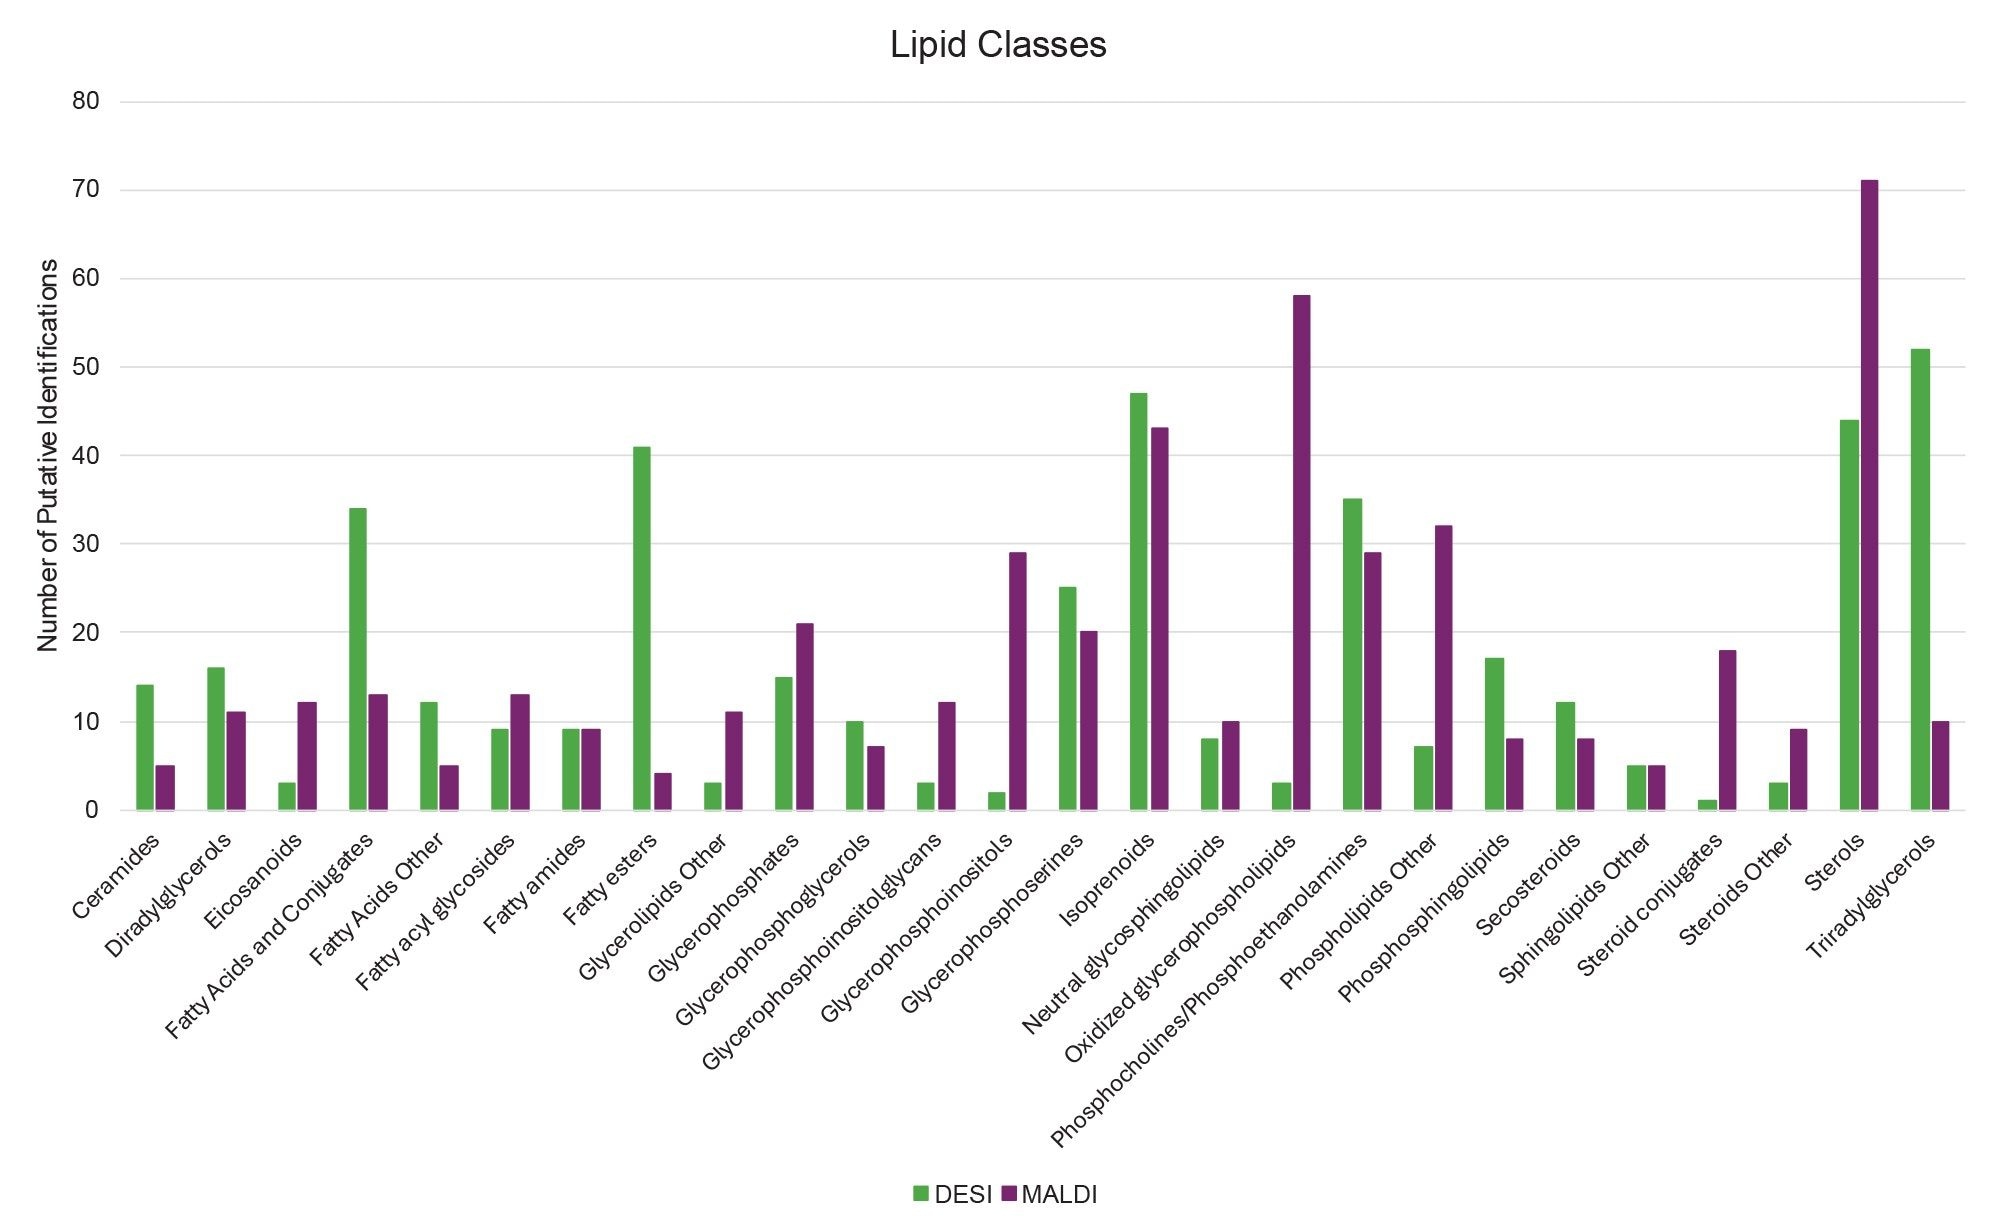
When looking for significance in difference between ionization of lipid classes for both MALDI and DESI, a ≥80% total lipid class identified cut-off was applied which resulted in eight lipid classes showing a significant change in ionization efficiency between the two ionization modes. These were: eicosanoids, fatty esters, glycerophoinositolglycans, glycerophosphoinositols, oxidized glycerophospholipids, phospholipids (other), steroid conjugates, and triacylglycerols.
Lipid classes favoring MALDI ionization were eicosanoids with 15 total putative identifications (12 from MALDI), glycerophoinositolglycans with 15 total putative identifications (12 from MALDI), glycerophosphoinositols with 31 total putative identifications (29 from MALDI), oxidized glycerophospholipids with 61 total putative identifications (58 from MALDI), phospholipids (other) with 39 total putative identifications (32 from MALDI) and steroid conjugates with 19 total putative identifications (18 from MALDI).
Lipid classes favoring DESI ionization were: fatty esters with 45 total putative identifications (41 from DESI), and triacylglycerols with 62 total putative identifications (52 from DESI).
Figure 4 provides a graph showing the unique numbers of species per lipid class identified by MALDI and DESI respectively.
Conclusion
Here, it has been demonstrated that a wide range and large number of lipids can be ionized and detected by either DESI or MALDI imaging. The results show that these ionization modalities are complementary to each other, both in the lipid species detected and also in lipid classes, with a significant number of unique lipids ionized by each technique respectively.
Analyses can be tailored to focus on certain classes depending upon the analytical question. Alternatively, running a tissue section by DESI (a non-destructive imaging technique) prior to analysis by MALDI would give a much wider lipid coverage than a stand-alone analysis using just one of the two ionization modalities.
This workflow utilizes the Analyte Browser MicroApp and demonstrates its utility to putatively identify a number of lipid species from both DESI and MALDI analyses simply and rapidly.
References
- Slijkhuis N, Towers M, Claude E, van Soest G. MALDI versus DESI Mass Spectrometry Imaging of lipids in atherosclerotic plaque. Rapid Commun Mass Spectrom. 2025 Jan 15;39(1):e9927. doi: 10.1002/rcm.9927. PMID: 39435741.
720009320, April 2026