A New Method for Measuring Particulates in Protein Drug Formulations with Complex Excipients
Waters Corporation, United States
Published on November 06, 2025
Experiments in this application note were performed on the HORIZON™ system, an earlier generation of Waters BMI technology. The Aura™ platform now replaces HORIZON as the current standard for BMI, offering improved image resolution and more accurate quantitative particle analysis.
Introduction
Protein drugs need to be highly stable in order to increase product shelf life and inhibit protein aggregation which presents an immunogenic risk1. To achieve protein drug stability, formulators use an array of water-soluble excipients including various buffers, detergents, sugars and other compounds to inhibit protein aggregate formation2.
Measuring the quality and the state of the excipients in a formulation is a big challenge. Each formulation parameter plays a key role in determining its stability, but due to the nature and sheer variety of excipients, these materials can often confound protein particle measurements3. This measurement gap is accentuated in flow-based subvisible particle analyzers, where the protein sample cannot be reanalyzed to gain greater insights of the formulation’s state. Running subsequent measurements enables formulators to gain greater insights on the state of the protein formulation’s components and its overall stability.
The HORIZON system, powered by backgrounded membrane imaging (BMI), enables users the unique ability to conduct serial wash measurements of protein formulations filtered on a membrane, to dissolve water soluble excipients and reveal the hidden insights of a formulation’s state. In this application note, we present three independent case studies that leverage the HORIZON system’s unique capability to analyze samples after serial washes to investigate the impact on the number of protein and excipient particulates in the sample to gain a clearer understanding of the formulation state.
Experimental
Sample Preparation and Methods
Samples: Interfacially stressed IgG Aggregates: Protein aggregates made of immunoglobulin G (IgG) antibody were generated using a periodic interfacial compression method4. Briefly, IgG protein was diluted into pH 7.4 phosphate buffered saline (PBS) then filtered using 0.2 µm pore size sterile filters. Samples were rotated in a half-filled 50 mL conical tube at 15 rpm for 3 hours (IgG) at room temperature.
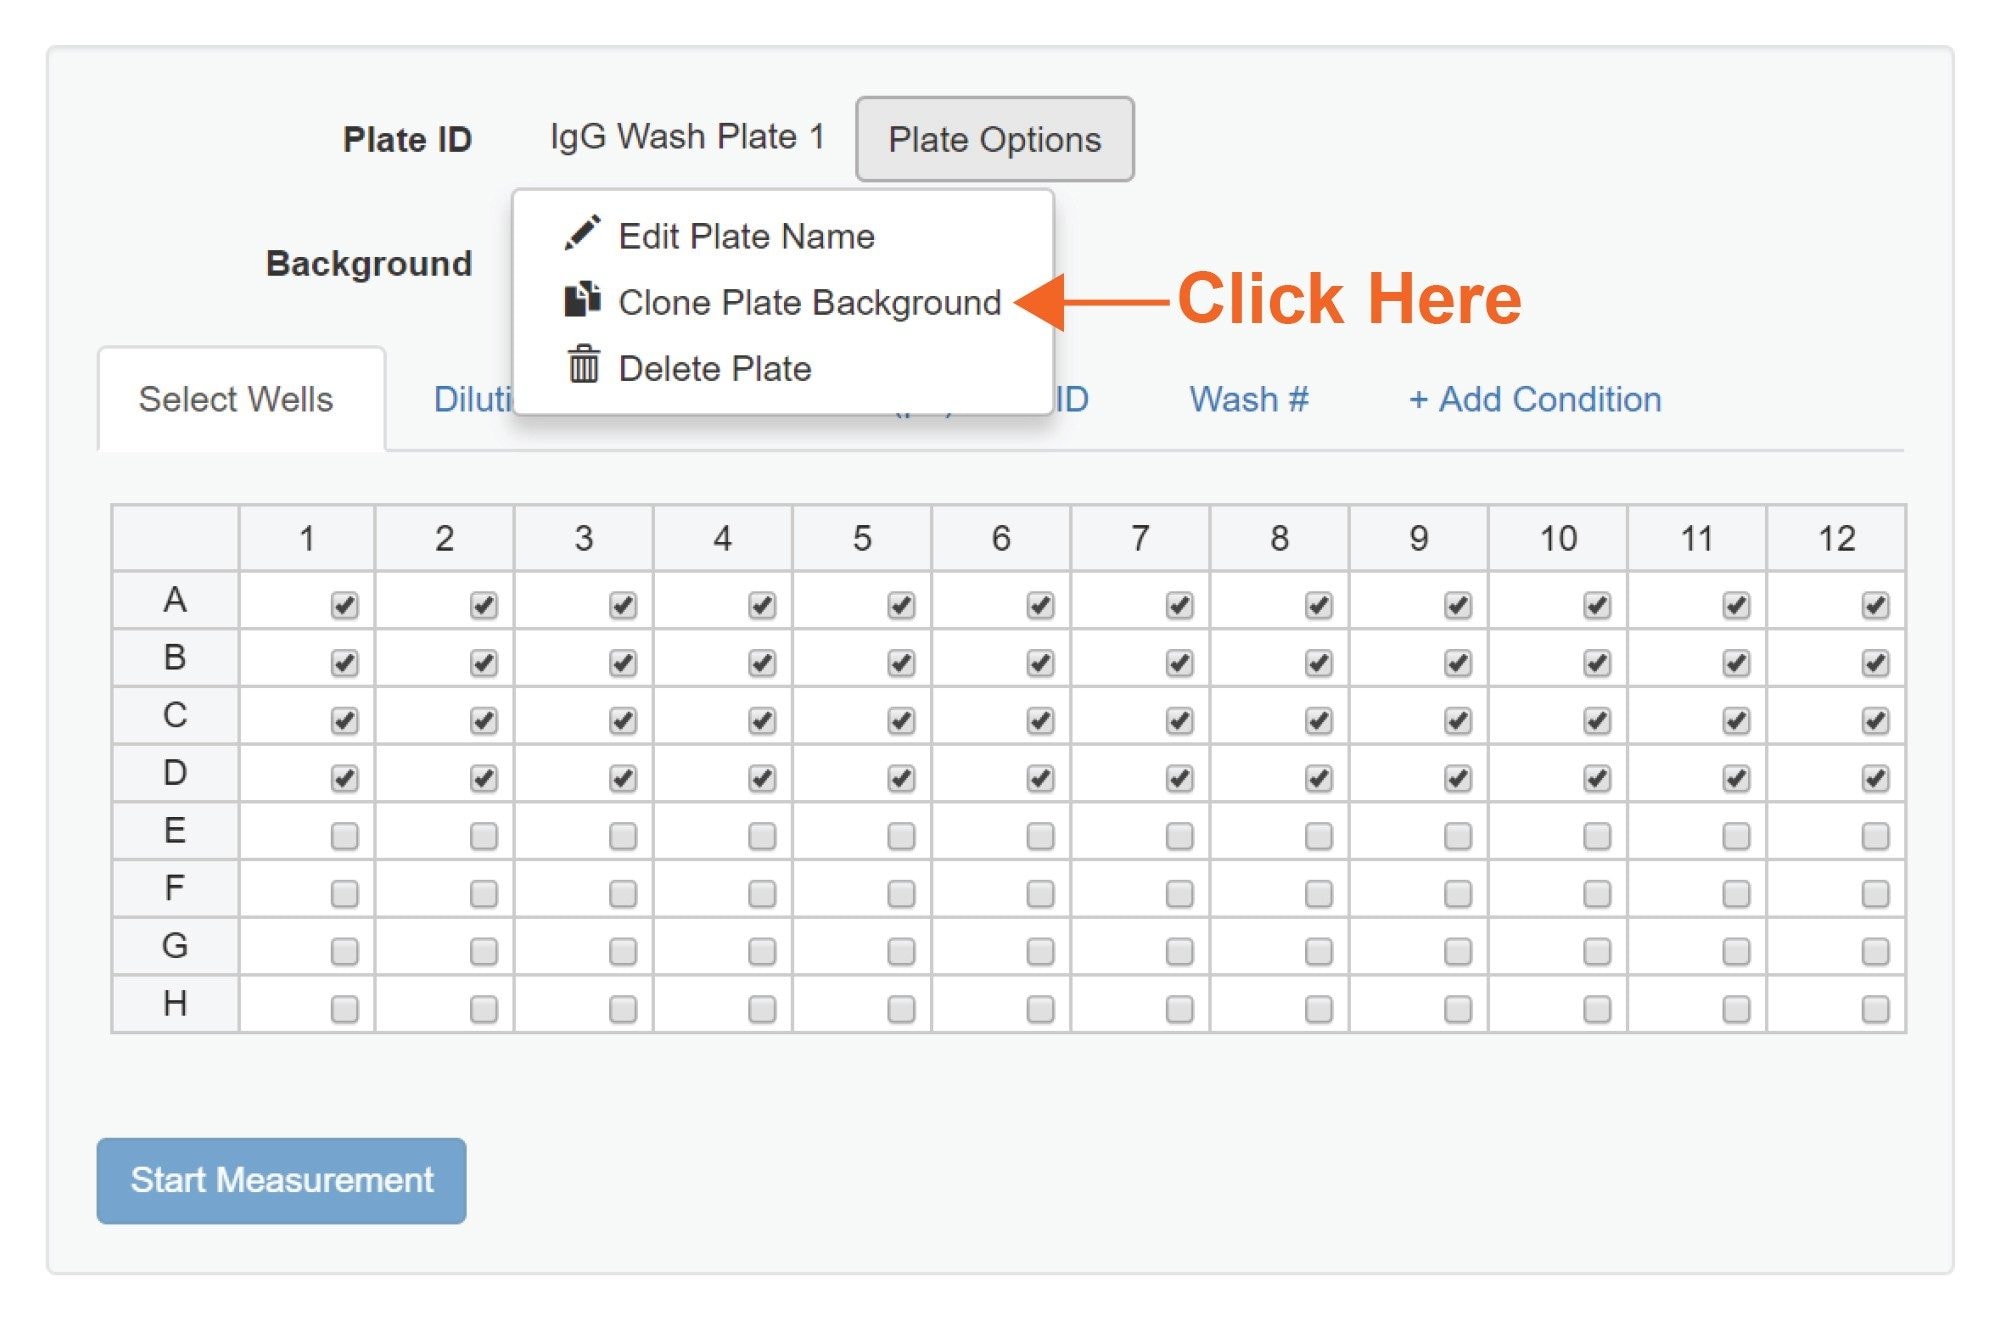
Software: HORIZON Vue 1.3 and above has a feature that enables making identical copies (clones) of the original plate background image (Figure 11). Creating multiple copies of the original plate background image allows one to reanalyze the same well several times and subject it to several treatment conditions. In this application note, we use this feature to conduct serial washing of the same wells.
Serial Washing Method: Every wash step used 50 µL of filtered (0.2 µm Luer Lock syringe filter) deionized (DI) water. After the sample was applied to the membrane and filtered via vacuum, 1 to 3 aliquots of 50 µL of DI water was applied to the same well and vacuumed through the membrane as defined for each case study below.
Software Condition Setup: To facilitate analysis, we created the following conditions in the HORIZON system to group the data.
- Software Condition 1: Particle ID – We created individual conditions for each dilution and excipient concentration
- Software Condition 2: Wash # – To independently group and compare the impact of each membrane wash on the particle counts
Results and Discussion
Study 1 — Buffer Crystallization
The HORIZON system was used to analyze the quality of the buffer in a solution of interfacially stressed IgG aggregates suspended in PBS and measured 1 day after formulation, and then again 30 days after formulation.
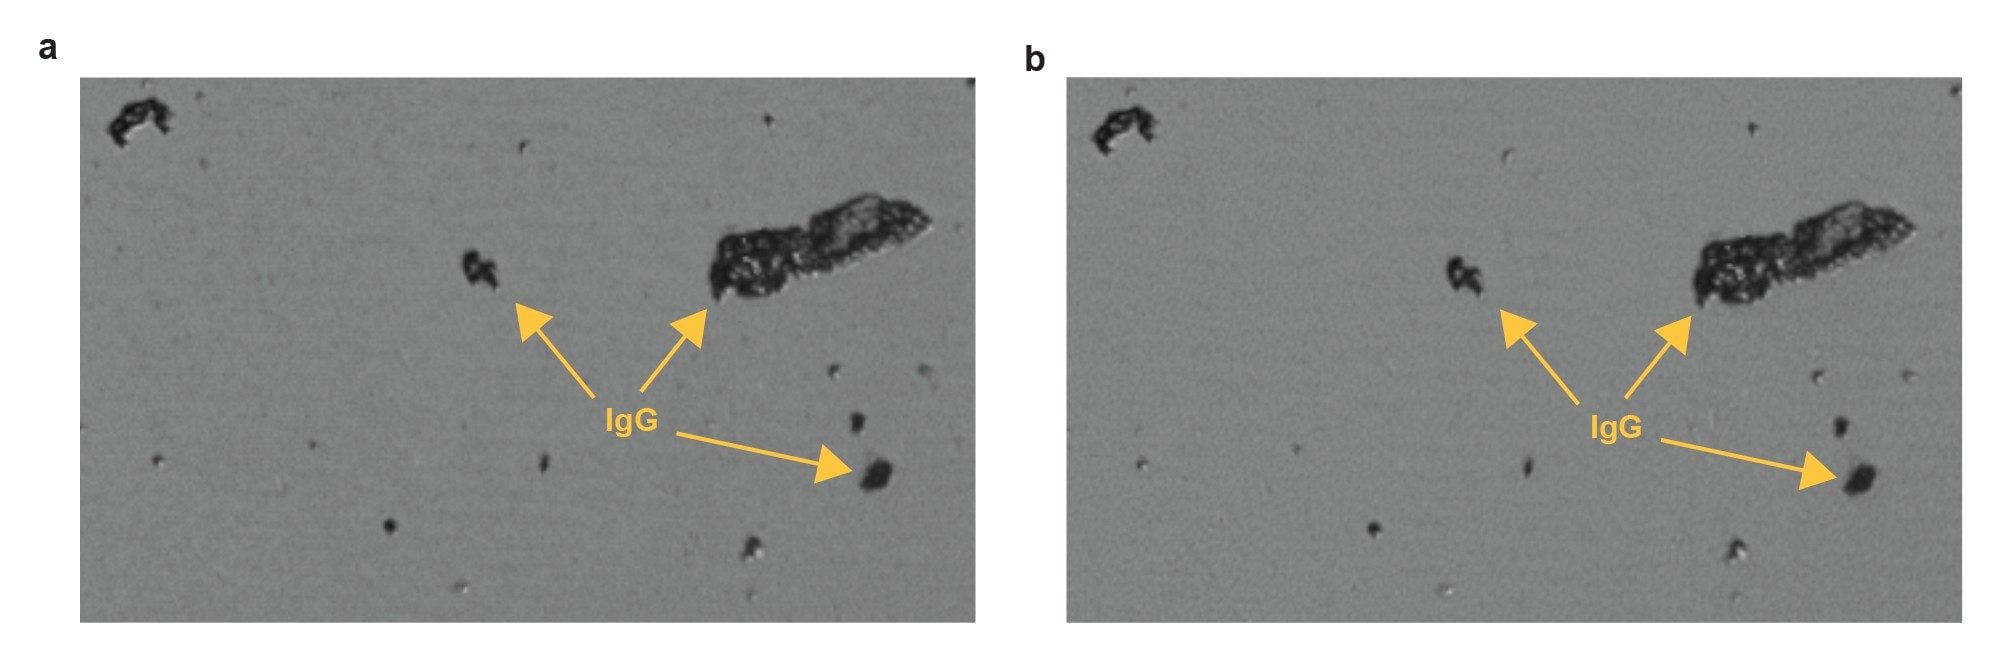
Figure 2 shows the filtrate difference image of the sample processed 1 day after formulation. The images exhibit dark amorphous IgG particles (a) before and (b) after applying a 50 µL DI water wash. The second image was obtained by cloning the background of the first well image, applying a 50 µL DI water wash, and remeasuring. The IgG aggregates remain bound to the membrane and are unaffected by the wash.
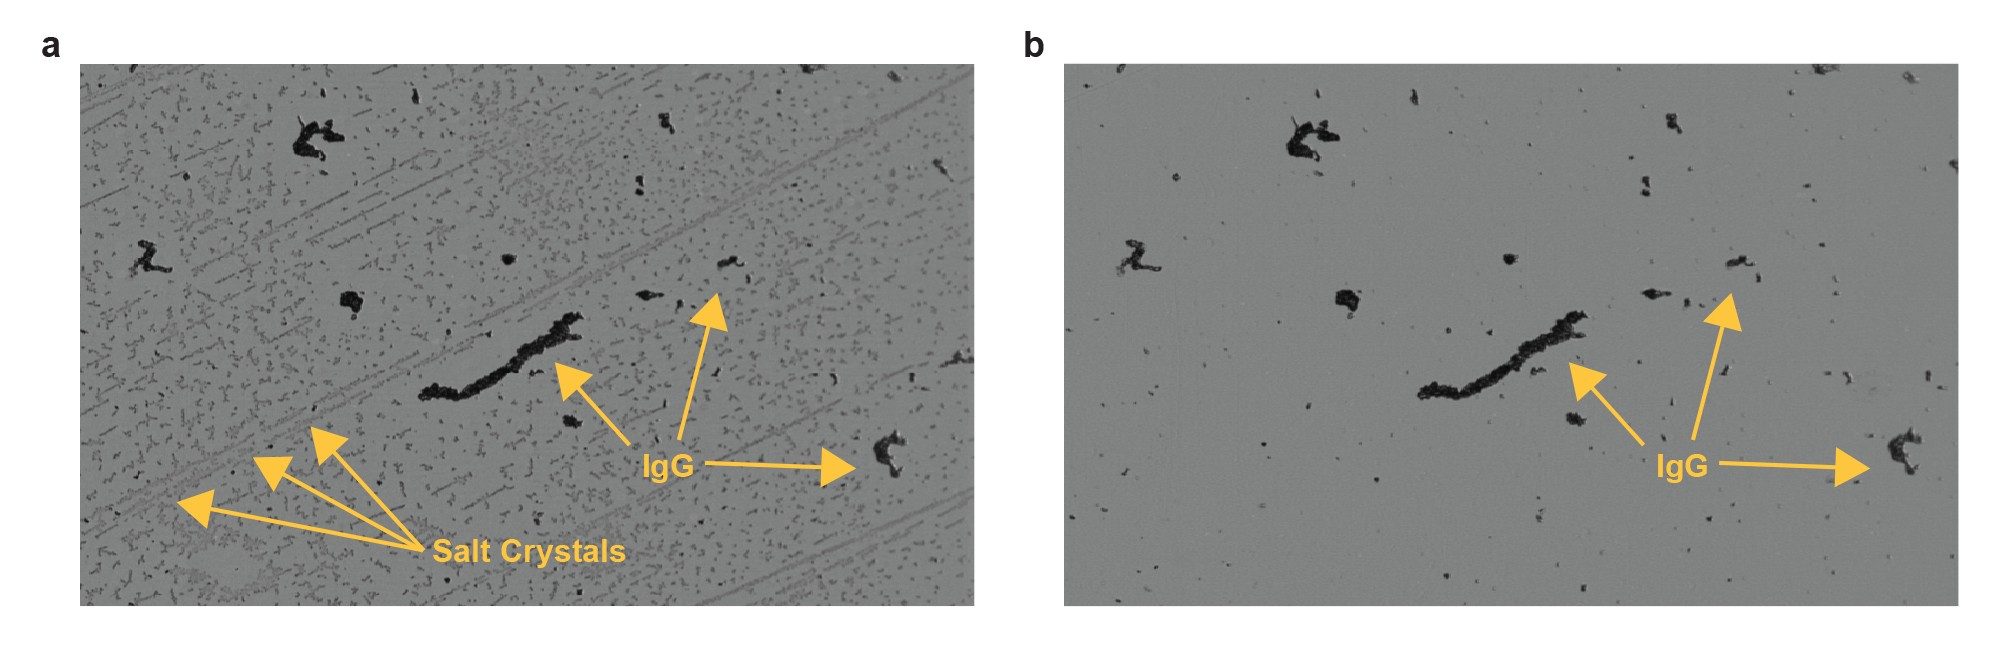
Figure 3 shows the filtrate difference image of the sample processed 30 days after formulation. These images also exhibit dark amorphous IgG particles as seen in Figure 2, but also show many unexpected faint gray anisotropic particles (Figure 3a). The faint particles disappear upon a single 50 µL DI water wash (Figure 3b), while the dark protein aggregates remain bound to the surface.
Irreversible, highly aggregated proteins tend to be dense (dark appearance) and amorphous. The faint anisotropic particles are directional and soluble in water upon washing. With the only other constituent in this solution being salt from the buffer, we can conclude that the faint, anisotropic particles are salt crystals. These were not visible for fresh formulations, and possibly resulted from buffer degradation.
Study 2 — Protein Aggregate Solubility and Adsorption to the Surface
In this case study we used IgG aggregates using the same sample preparation procedure described above and created two stock IgG solutions using PBS and DI water respectively. We ran 2X serial dilutions of the samples in their corresponding buffers from stock (1X) down to 32X dilutions. Samples were filtered through a HORIZON filter plate and subsequently measured using 50 µL of sample per well, measuring N = 4 samples per condition. For this experiment, the background of the software plate was cloned 3 times. All the wells were washed with 50 µL DI water, and remeasured, and this process was repeated 3 times for each wash step.
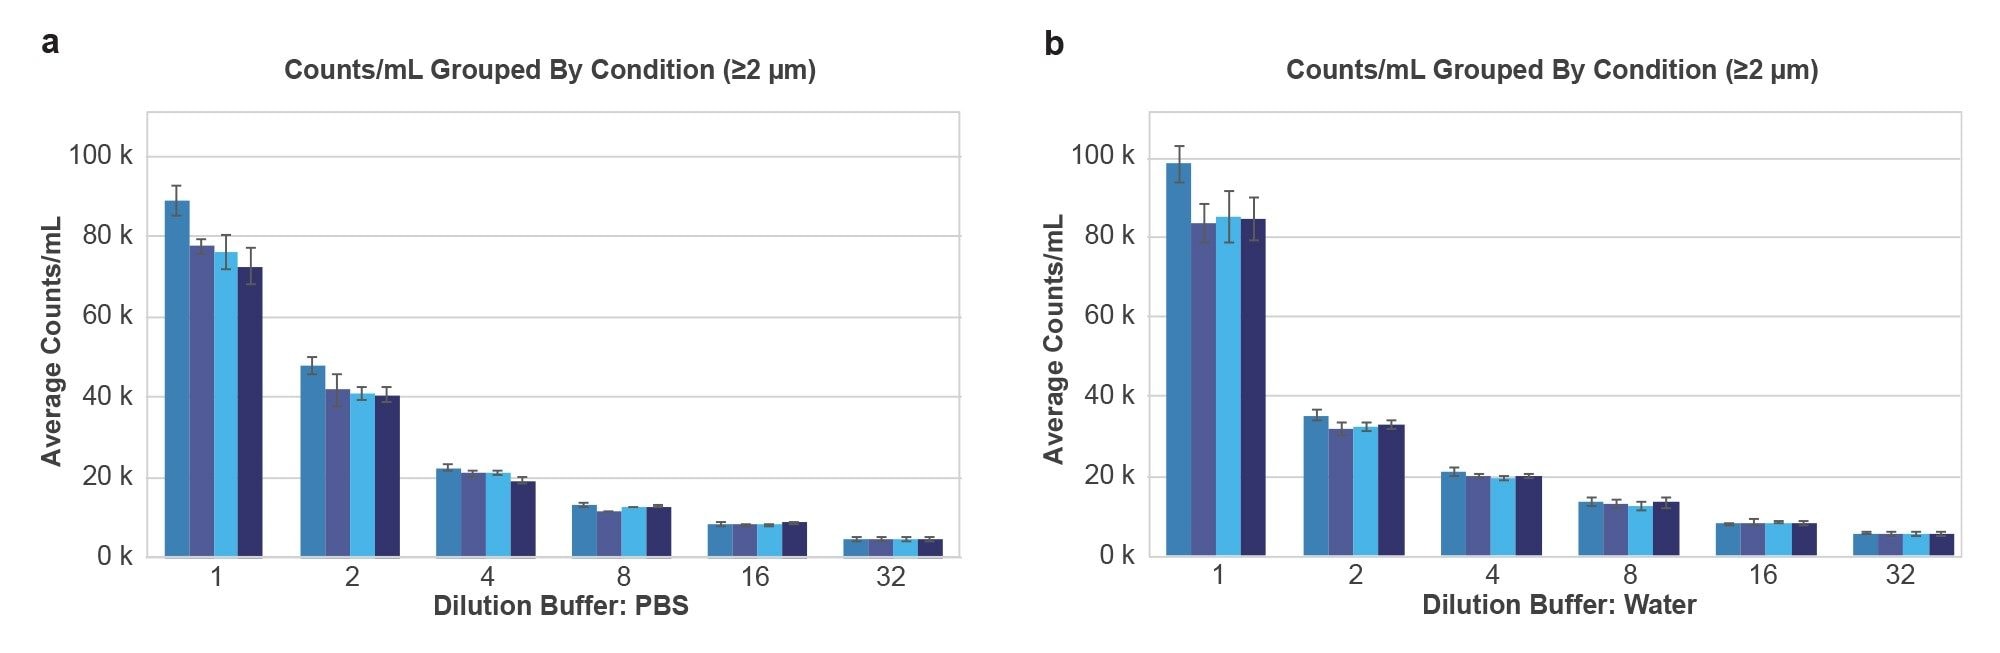
Serial dilutions of IgG aggregates in both buffers showed linear counts drop behavior (R2 > 0.99), and very similar counts with stock IgG concentrations hovering close to 1E5 particles/mL for both stock conditions (Figure 4). After the first wash, both buffer types saw at most 20% of the counts drop for concentrated samples, potentially from the dissolution of soluble aggregates. Additional washing resulted in no counts increase or decrease within measurement error.
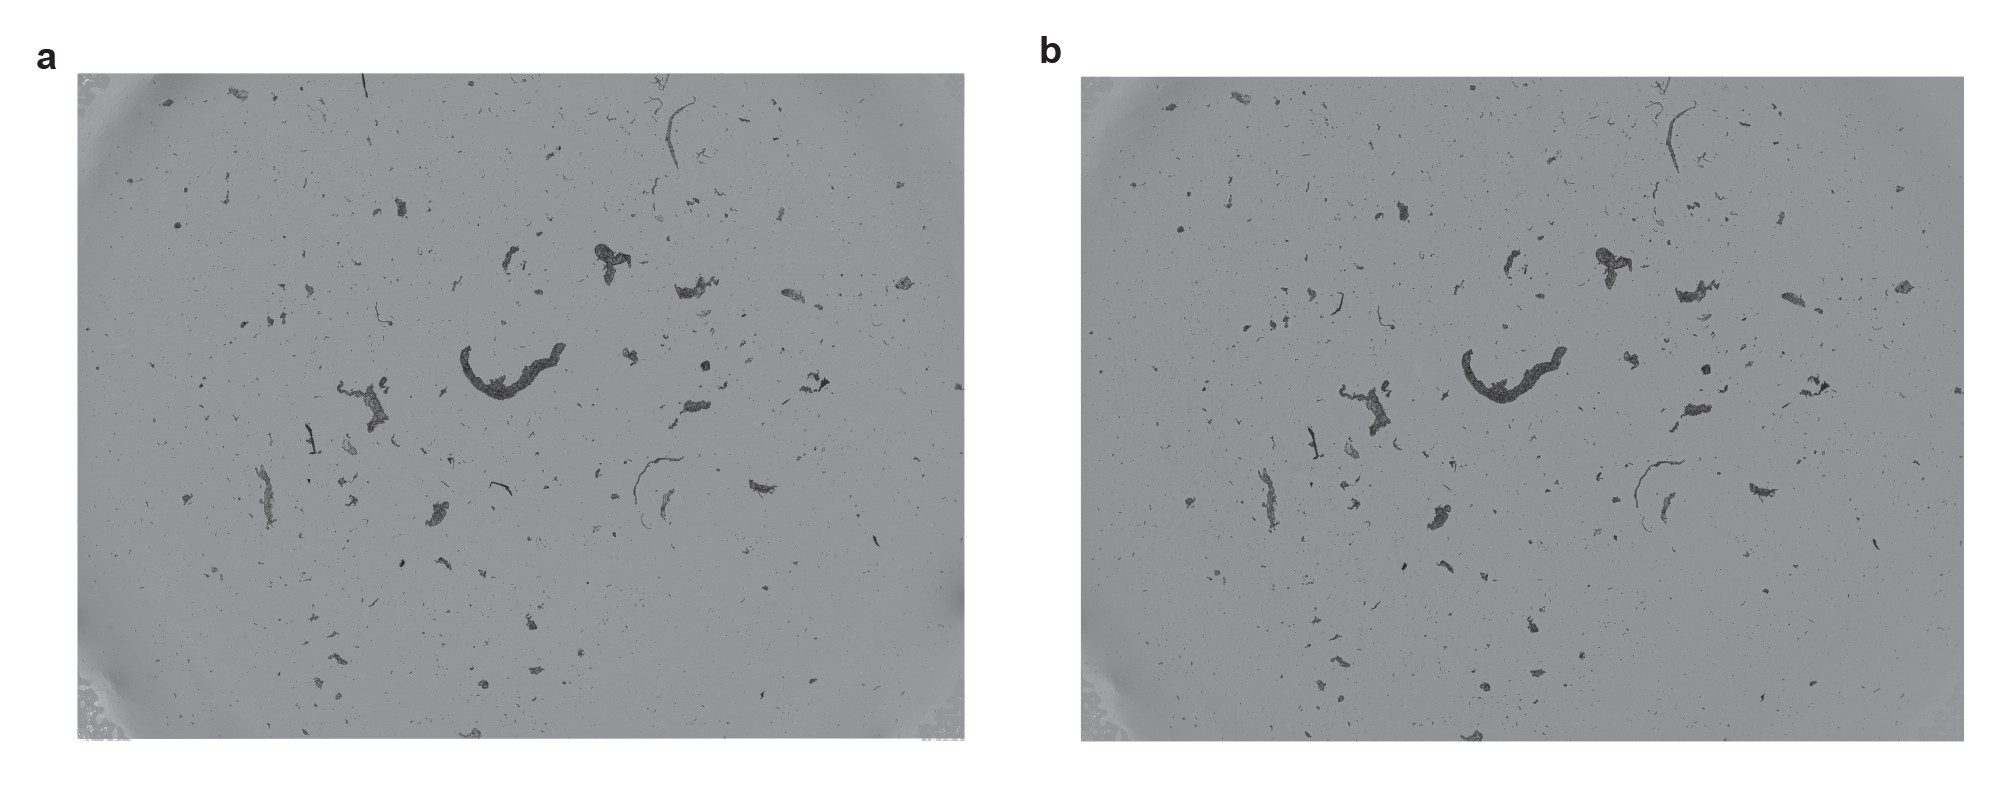
Figure 5 shows whole membrane images for a sample of stock IgG before washing (Figure 5a) and after 3 serials washes (Figure 5b) of 50 µL of filtered DI water. The dark protein aggregates remain bound to the membrane and do not move. The same results were observed for IgG aggregates diluted in DI water.
Study 3 — Protein Aggregates in Highly Concentrated Excipient Solutions
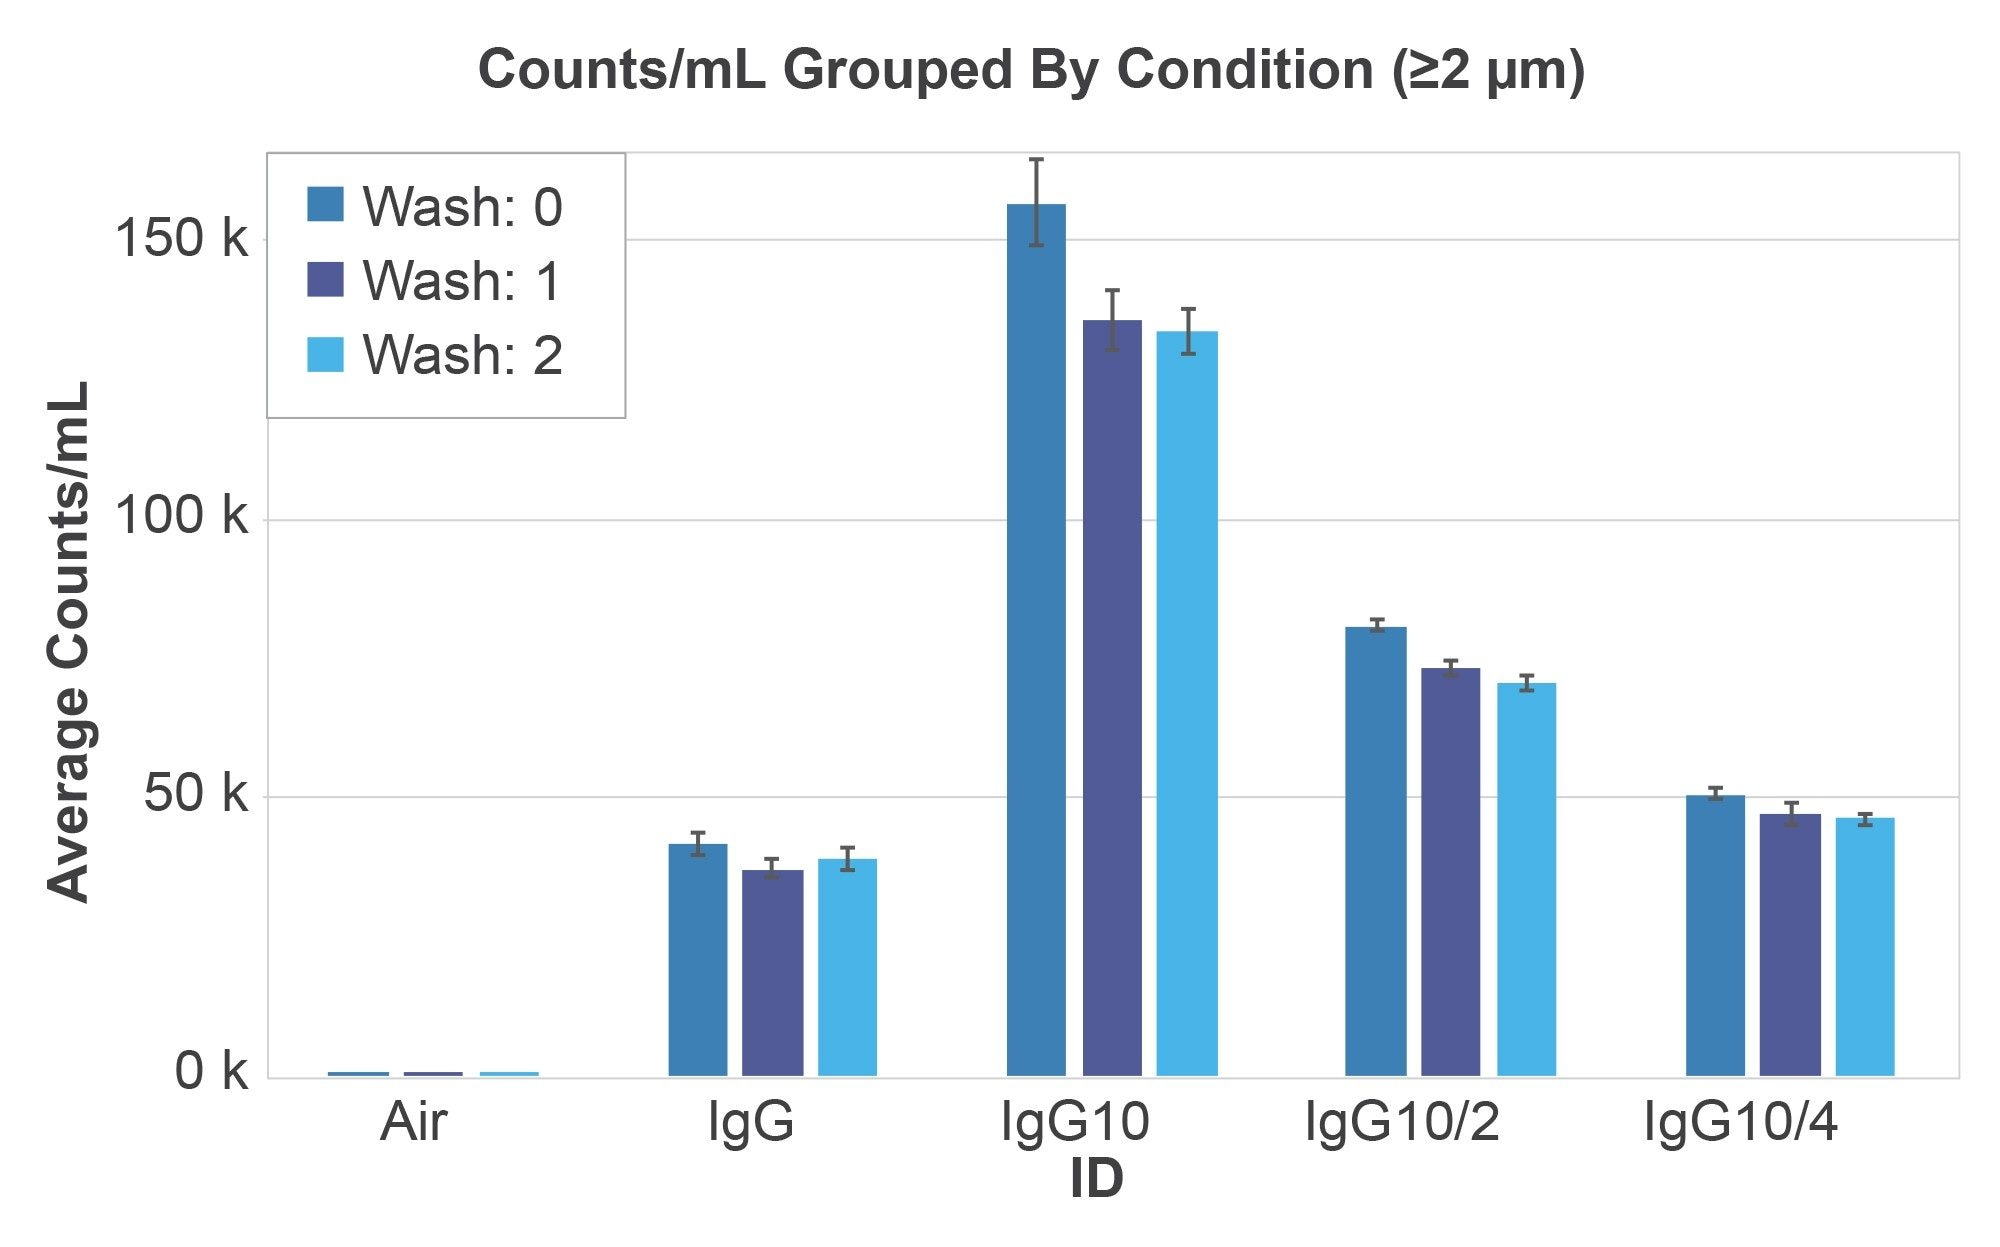
In our third case study we explore how high concentrations of excipients can impact particle measurements. We mixed protein aggregates with sucrose and polysorbate to make a concentrated IgG solution suspended in 10% sucrose (w/v) and 0.05% Tween 80 (w/v). This stock IgG:Sucrose:Polysorbate solution was subjected to 2X serial dilutions in PBS, followed by two rounds membrane washing using 50 µL of DI water as shown in Figure 6.
The excipient-less IgG solution was unaffected by the washing and measured 39,171 particles/mL with CVs of 9.5%. The protein solutions in high excipient concentration showed serial dilution behavior going from 156,933 particles/mL linearly down to 50,470 particles/mL (R2 > 0.94) and from 133,867 particles/mL linearly down to 46,073 particles/mL in the washed case (R2 >0.93) where the excipients were dissolved in the aqueous wash. A count drop of 17% was seen for the high excipient IgG solution upon the first 50 µL membrane wash, which is most likely from the dissolution of sucrose particles. Additional membrane washes did not result in a further significant drop in particle counts.
Conclusion
Serial membrane washing can help unveil critical details of a formulation. In the first two case studies, we explored how irreversible protein aggregates tend to be dense (dark in the image), amorphous, and do not disappear upon membrane washing as verified by visual microscopic membrane inspection and by counts analysis. Protein aggregates’ lack of solubility and their strong binding to the membrane surface allow one to count them reliably while uncovering the presence of other water-soluble excipients particles. This is important since the key objective of particle analysis in protein drug samples is to measure the insoluble protein aggregates since they tend to be immunogenic5.
With protein aggregates being insoluble, this helped us deduce in the first case study that the faint, directional and water-soluble particles were salt crystals. Their presence also coincided with the age of the buffer (30 days), potentially pointing to time-related buffer degradation. The second case study confirmed the insolubility of the aggregates, with virtually no change in counts even after 3 serial washes. The third case study uncovered that protein solutions formulated in concentrated excipient conditions can show elevated counts. However, the excipient particle counts, arising from sucrose or polysorbate particles, could be washed away with a single wash to enable counting of the true protein aggregates. Also of interest in the third case study is that the IgG solution that was formulated without concentrated excipients showed significantly lower particle counts (nearly half) than those that were formulated in 10% sucrose and 0.05% polysorbate. This is a reminder that a higher excipient concentration does not necessarily result in higher formulation stability.
The ability to get to the right formulation as quickly as possible requires one to obtain deep insights into all components of the formulation. The HORIZON system’s ability to clone original plate backgrounds to rapidly reanalyze the samples enables an unprecedented opportunity to learn more about the state of a proteindrug formulation. Key insights to your formulations are only a single 50 µL membrane wash away.
References
- Rosenberg AS. Effects of protein aggregates: An immunologic perspective. AAPS J. 2006 Aug 4;8(3):E501–7.
- Wang W. Advanced protein formulations. Protein Sci. 2015 Jul;24(7): 1031–1039.
- Zölls S, Weinbuch D, Wiggenhorn M, Winter G, Friess W, Jiskoot W, Hawe A. Flow imaging microscopy for protein particle analysis-a comparative evaluation of four different analytical instruments. AAPS J. 2013 Oct;15(4):1200–11.
- Mahler H-C, Müller R, Friess W, Delille A, Matheus S. Induction and analysis of aggregates in a liquid IgG1-antibody formulation. Eur J Pharm Biopharm. 2005 Apr;59(3):407–17
- Ratanji KD, Derrick JP, Dearman RJ, Kimber I. Immunogenicity of therapeutic proteins: Influence of aggregation. J Immunotoxicol. 2014 Apr;11(2):99–109.
Featured Products
720009131, November 2025