Sugars and sugar alcohols are classes of carbohydrates that are natural constituents of foods and provide important nutritional benefits. Some sugars are added to processed foods in order to enhance flavor or to mimic fresh food products. With the increasing incidence of obesity and diabetes across the developed world, the need to monitor sugar intake has grown in recent years. Consequently, there are now requirements to provide accurate information about sugar content on food product labels in order to comply with increasingly stringent regulatory demands.
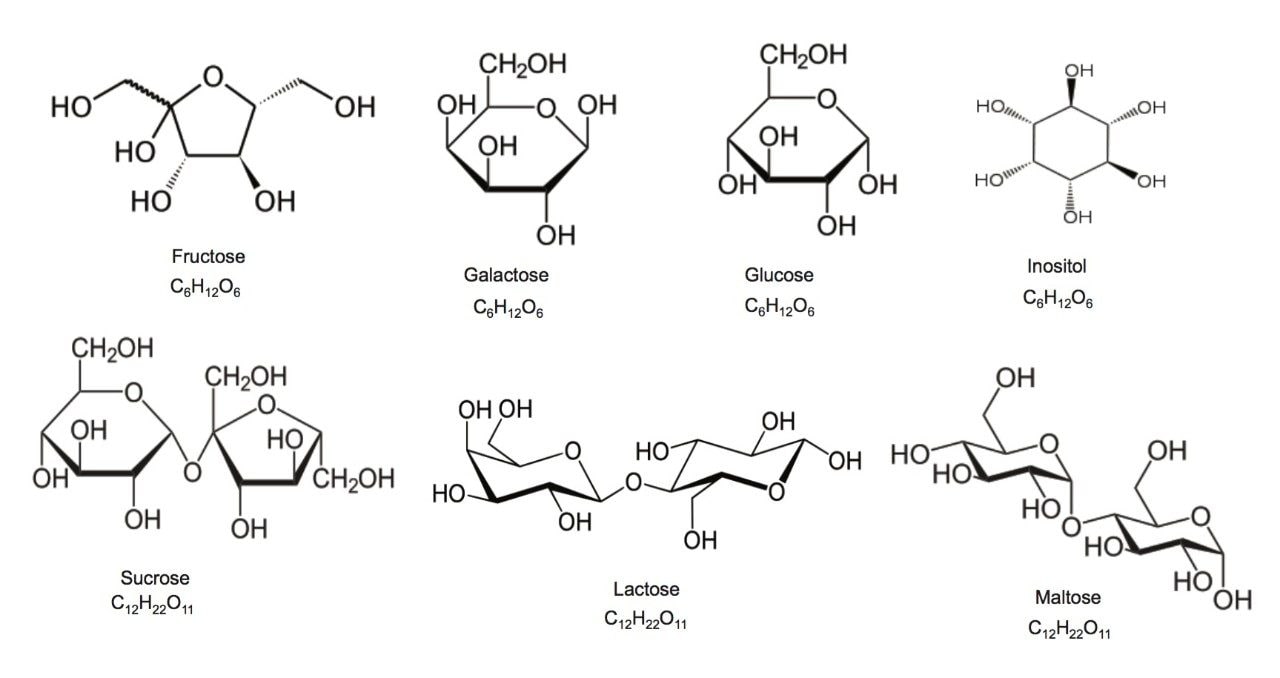
The analysis of these compounds is challenging because they lack chromophores within their compound structures, and because of the close similarity among the various molecules, many of which are simple isomers of one another. Structures and formulae are shown in Figure 1. Due to its separation power, accuracy and speed of analysis, HPLC has become the method of choice for the analysis of sugars.1 HPLC techniques typically employ RI or ELS detection. RI detection requires careful control of the mobile phase to avoid any changes during the analysis and therefore requires isocratic elution. With RI detection it is also difficult to change the mobile phase composition from one analysis to the next because the RI detector may require several hours to equilibrate when a different mobile phase composition is introduced. ELS detection is more robust for mobile phase composition changes, but ELS often does not meet the sensitivity demands for the detection of sugars in complex matrices.
An alternative gaining traction is the use of mass detection with electrospray ionization (ESI). Waters ACQUITY QDa Detector offers the opportunity to decrease detection limits as well as the ability to obtain mass spectral information on components in the sample. The combination of chromatographic retention time and mass information can provide improved selectivity for the profiling of sugars and sugar alcohols. The ACQUITY QDa Detector is the only mass detector that has been holistically designed to be incorporated with an LC system. It fits in the LC stack, occupying the same amount of space as a PDA detector. Extensive training is not required, so users already familiar with HPLC can quickly take advantage of the improved selectivity and sensitivity that mass detection affords. In this application note we describe the use of the ACQUITY QDa Detector coupled to the ACQUITY Arc System for the profiling of sugars in milk and infant formula.
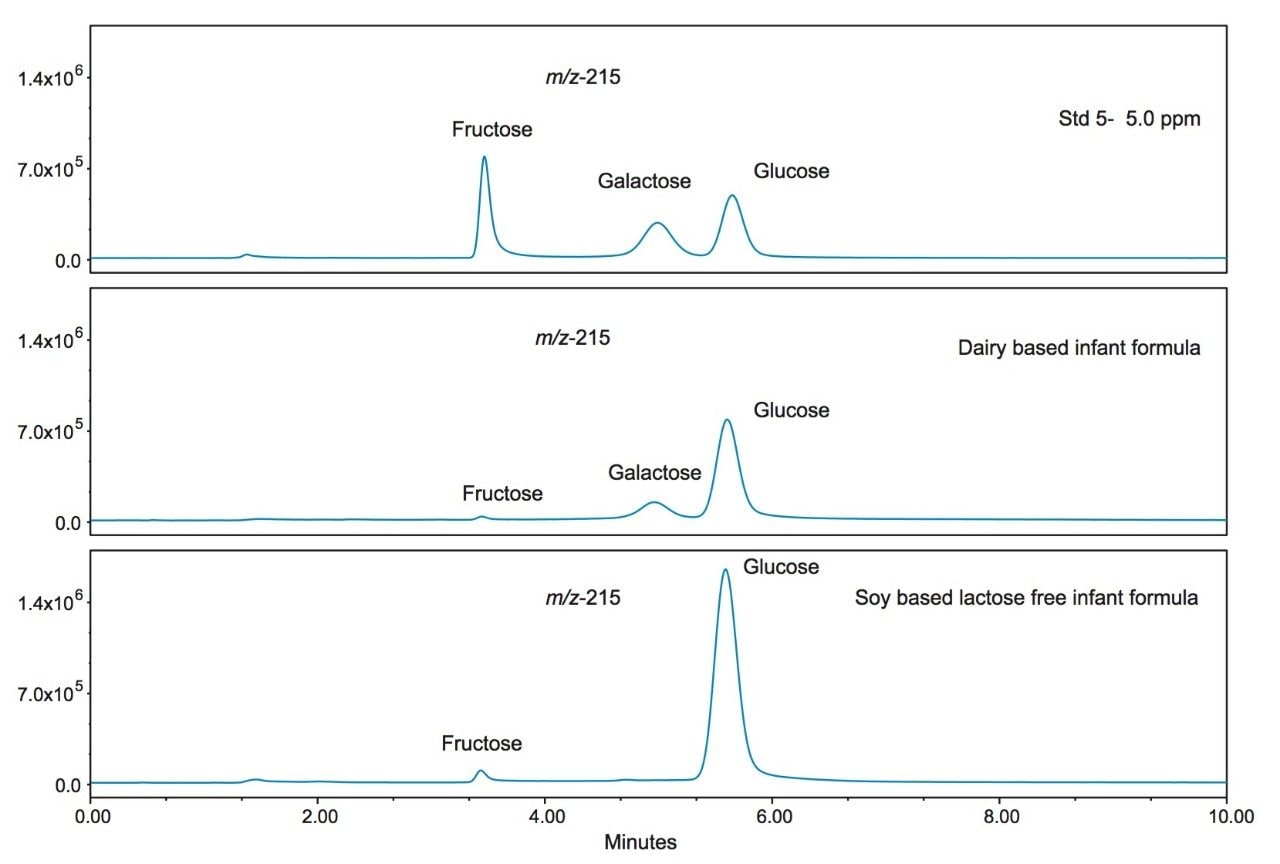
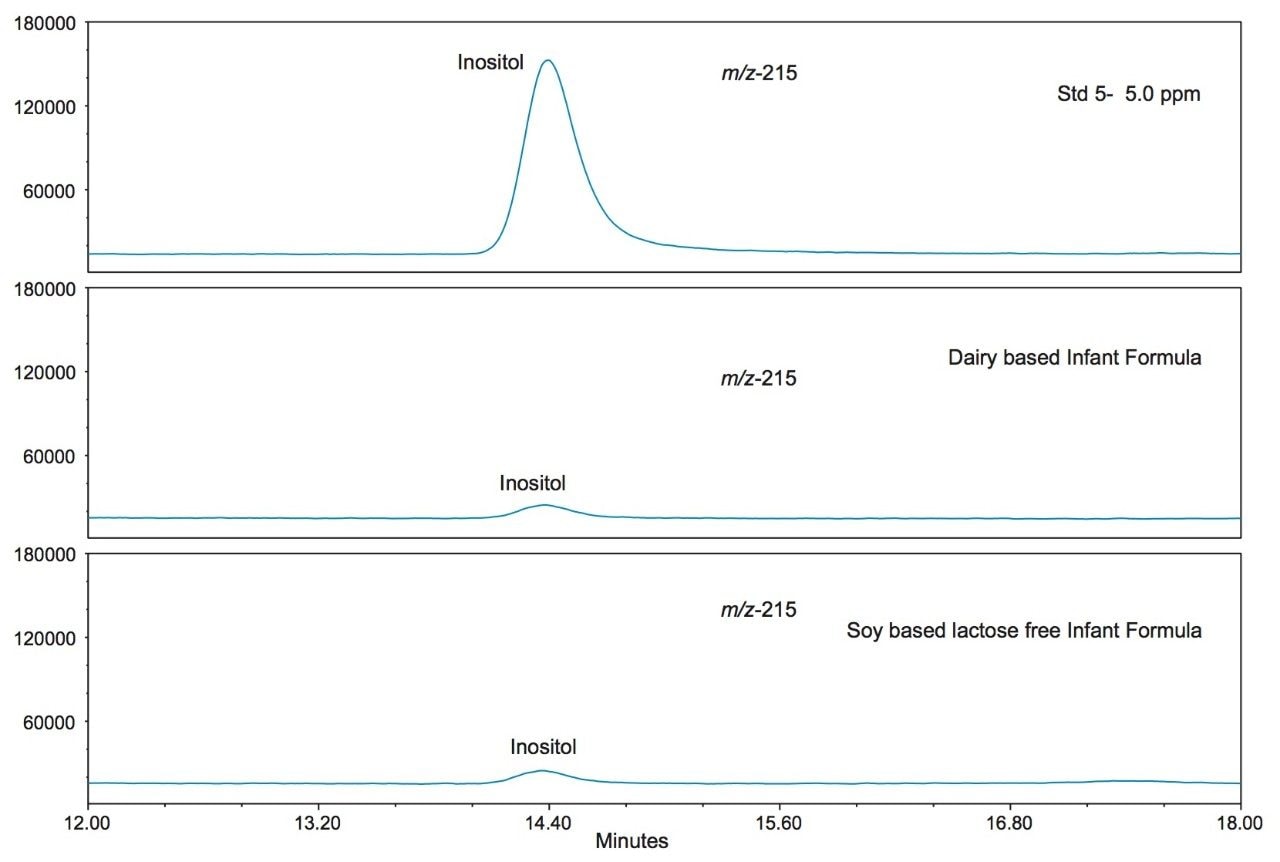
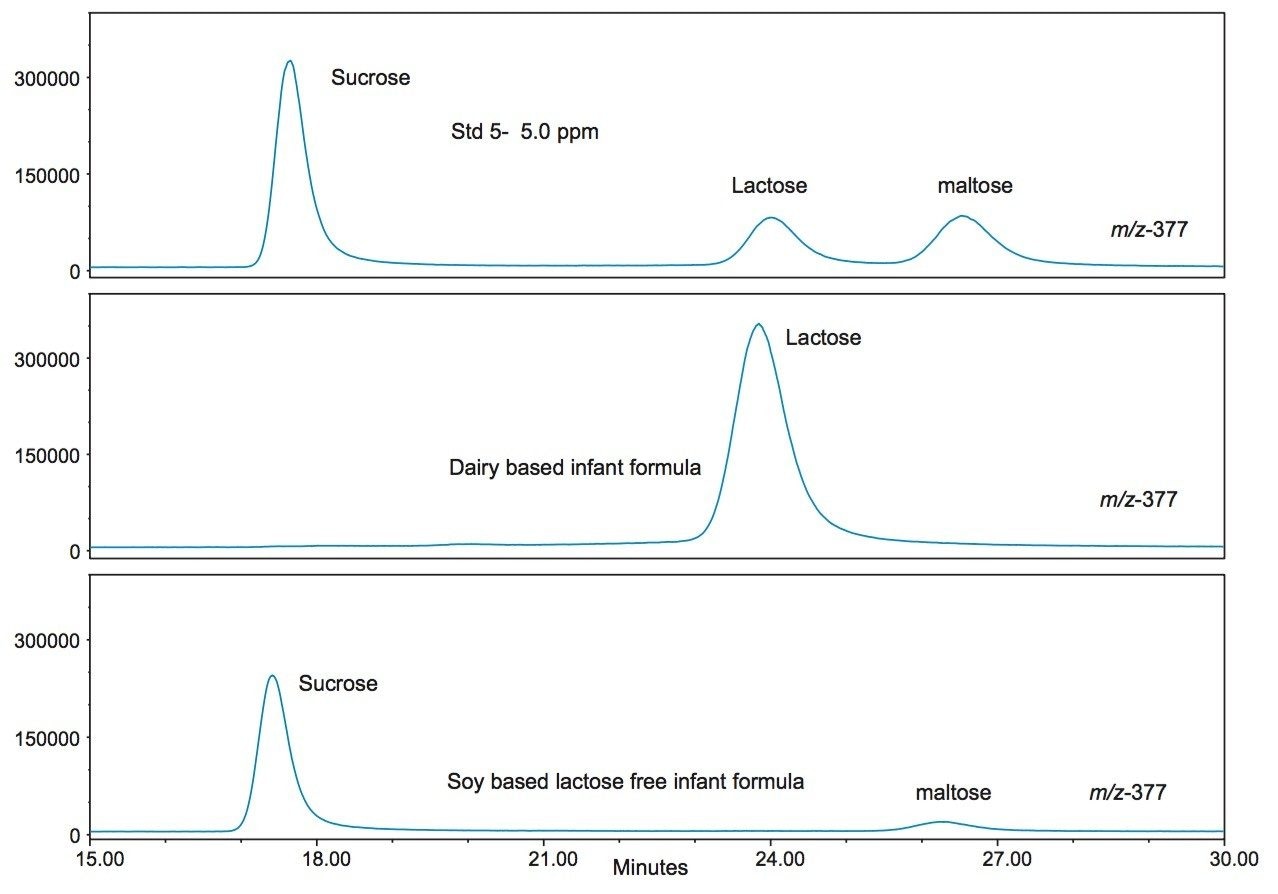
![SIR chromatograms of the seven saccharide standards used in the study, the annotated m/z represents the [m+ Cl]- adducts.](/content/dam/waters/en/app-notes/2016/720005767/720005767en-f3.jpg.82.resize/img.jpg)
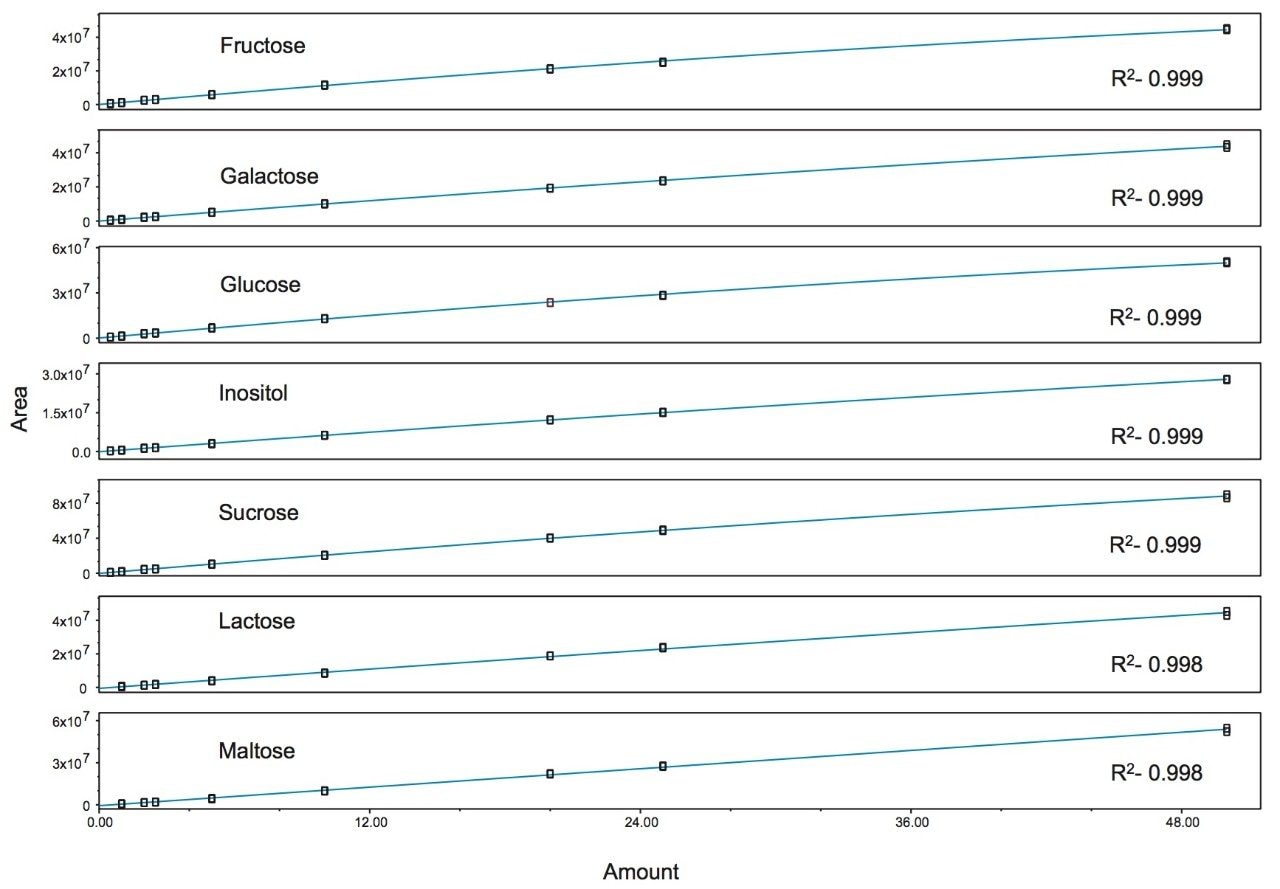
![Mass spectral information extracted from SIRs of the seven saccharide standards. The annotated m/z represents m/z the [m+ Cl]- adducts.](/content/dam/waters/en/app-notes/2016/720005767/720005767en-f4.jpg.82.resize/img.jpg)