• Application Note

An Exact Mass Metabolomic Study of Nitrogen Starvation in Arabidopsis thaliana using the GCT Premier 

An Exact Mass Metabolomic Study of Nitrogen Starvation in Arabidopsis thaliana using the GCT Premier 

  • Stephanie Boutet-Mercey
  • Hilary J. Major
  • Joanne Cardwell
  • Anne Krapp
  • Patrice Meinmoun
  • Delphine Hourcade
  • Institut National de la Recherche Agronomique (INRA)
  • Waters Corporation
  • Paris-Sud University
Thale cress flower blossoms and buds

Abstract

In this application note, we use GC-MS with the Waters GCT Premier mass spectrometer to study nitrogen starvation in Arabidopsis thaliana, focusing on the metabolic profiles of roots and leaves after moderate and severe nitrogen starvation.  

Introduction

Nitrogen is an essential element for plant growth and development. In natural soils, nitrogen is often a significant factor limiting plant growth. Nitrogen stress triggers various responses at the level of metabolism, gene expression and development allowing the sessile plant to adapt by short and long term mechanisms. Nitrogen assimilated in biomolecules can be released back to inorganic nitrogen (NH4), which can re-enter metabolism in various physiological processes such as photorespiration and biosynthesis of phenylpropanoids. Due to the coordination of nitrogen metabolism with other pathways, e.g. carbon metabolism, major changes in carbon and nitrogen metabolism have been described (Scheible et al. 1997),1 but more detailed analysis of metabolite profiles are needed to understand the dynamic response of the metabolic network to nitrogen stress. Recent studies on tomato plants (Urbanczyk-Wochniak and Fernie 2005)2 and Chlamydomonas (Bolling and Fiehn 2005)3 have demonstrated the immense changes in metabolite profiles after nitrogen starvation. 

In this application note, we use GC-MS with the Waters GCT Premier Mass Spectrometer to study nitrogen starvation in Arabidopsis thaliana, focusing on the metabolic profiles of roots and leaves after moderate and severe nitrogen starvation. Moderate starvation was studied two days after nitrogen withdrawal and severe starvation after 10 days. A detailed comparison of the metabolic profiles of these two organs over a time course of starvation will give further understanding of the adaptive behavior of plants to nitrogen stress. 

Waters GCT Premier
Figure 1. Waters GCT Premier. 

Experimental

Plant growth and sample preparation Arabidopsis thaliana plants were cultivated under hydroponic conditions using the method of Orsel et al.4 The plants were grown for five weeks on 6 mM nitrate in a hydroponic device using short days. Total nitrogen starvation was applied for either two days or 10 days and roots and leaves were sampled separately. 

40 mg of Arabidopsis leaves and roots (fresh material) were extracted with 1 mL extraction buffer (Gulberg et al)5. The extraction buffer (chloroform/methanol/water (1:3:1 V/V/V at -20 °C) allowed the extraction of lipophilic and hydrophilic metabolites in one phase. All samples were vortexed for 3 minutes and then centrifuged for 10 minutes at 3000 rpm and 4 °C. 300 μL of supernatant was dried under vacuum and the dried pellets were conserved under argon and stored at -80 °C prior to analysis. 

The dried extracts were derivatized using a two-stage process based on the method of Fiehn et al.6 20 μL of 40 mg/mL methoxyamine hydrochloride in pyridine was added to the dried extracts and held at 28 °C for 90 minutes. This was followed by the addition of 180 μL of MSTFA for 30 minutes at 37 °C. The samples were analyzed by GC-MS as follows:

GC Conditions

GC system:

Agilent 6890N

Column:

J&W Scientific DB-5MS 30 m x 0.25 mm i.d. x 0.25 μm film

Flow rate:

1.0 mL/min helium

Transfer line:

280 °C

Solvent delay:

4.3 min

Gradient

Temperature(°C)

Time(min)

Rate(°C/min)

85

2

15

320

5

-

MS Conditions

MS system:

Waters GCT Premier

Ionization mode:

EI and CI+

Source temperature:

200 °C

Electron energy:

70 eV

Trap current (EI):

200 μA

Emission current (CI+):

200 μA

Mass range:

m/z 50 to 1000

Acquisition rate:

0.19 sec

CI Reagent gas:

90:10 methane/ammonia

Lock reference EI:

Chloropentafluorobenzene

Exact mass:

201.9609

Lock reference CI:

2,4,6-Tris(trifluoro methyl)-1,3,5-triazine

Exact mass:

286.0027

Results and Discussion

Acquired data was processed through the Waters MarkerLynx Application Manager for MassLynx software and the resulting PCA scores plot from all of the EI data is shown in Figure 2. This shows clear separation of leaves and roots and the samples from each stage of the nitrogen starvation experiment. 

MarkerLynx PCA scores plot of EI data
Figure 2. MarkerLynx PCA scores plot of EI data. 

Representative total ion chromatograms (TIC) from the EI analysis of the derivatized leaf extracts are shown in Figure 3, and from the root extracts in Figure 4. 

Representative EI TIC chromatograms
Figure 3. Representative EI TIC chromatograms from leaf extracts from (a) unstarved, (b) after two days and (c) after 10 days nitrogen starvation. 
Representative EI TIC chromatograms
Figure 4. Representative EI TIC chromatograms from root extracts from (a) unstarved, (b) after two days and (c) after 10 days nitrogen starvation. 

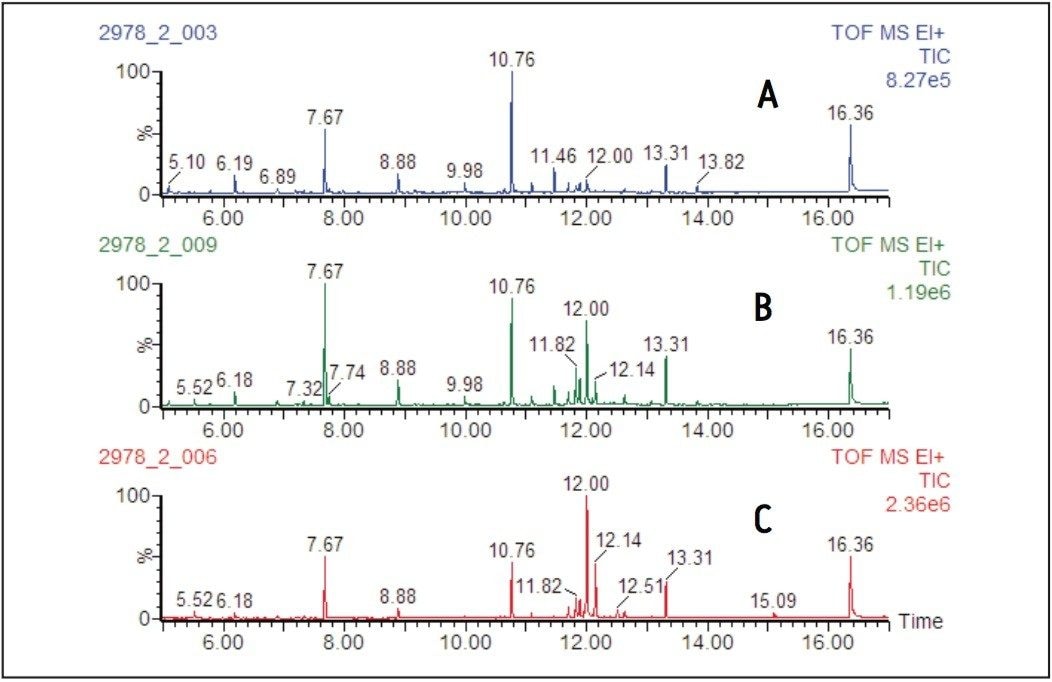
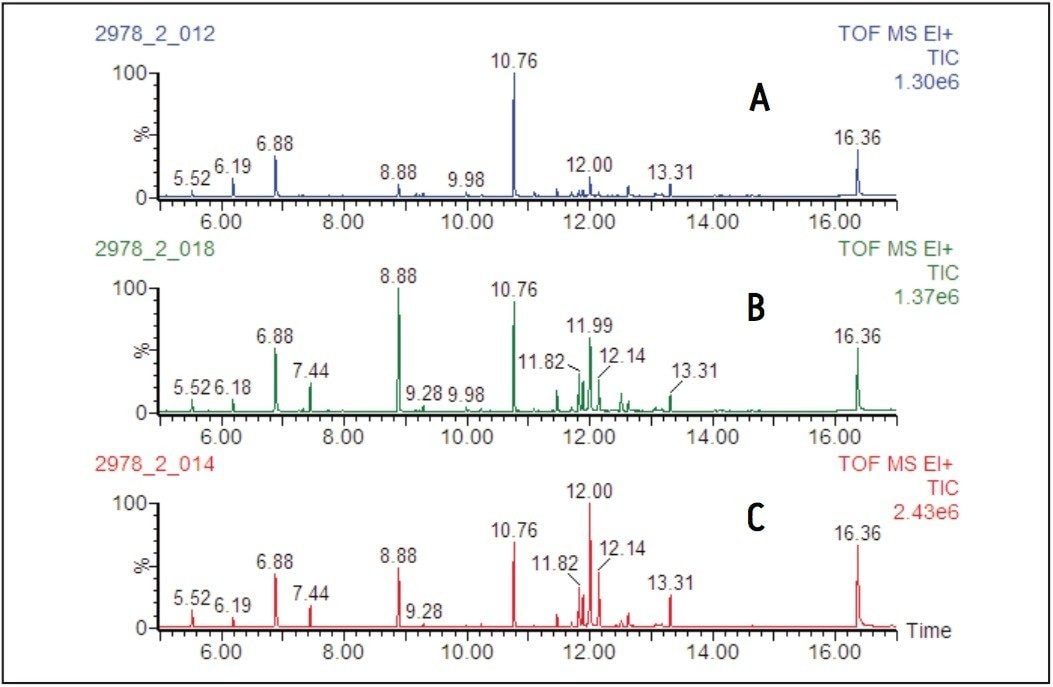
Examination of the chromatograms shows distinct differences between the metabolic profiles of the leaves and roots, with the major peak at 7.67 minutes in the leaf samples, assigned as fumaric acid, only being present at trace levels in the root samples. 

Conversely, in the root samples the peak at 6.88 minutes, mainly composed of tris(trimethylsilyl) phosphate, is only present at a low level in the leaf samples. 

The major changes observed as a result of the nitrogen starvation, however, were an increase in intensity of the peaks in the retention time range of 11.75 to 12.25 minutes, corresponding to an increase in carbohydrates. 

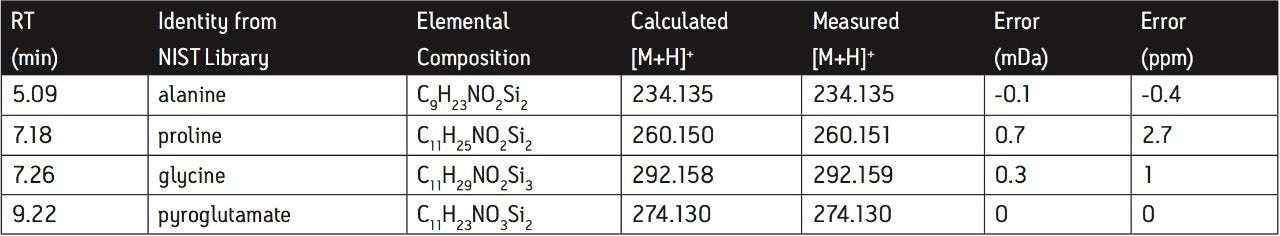
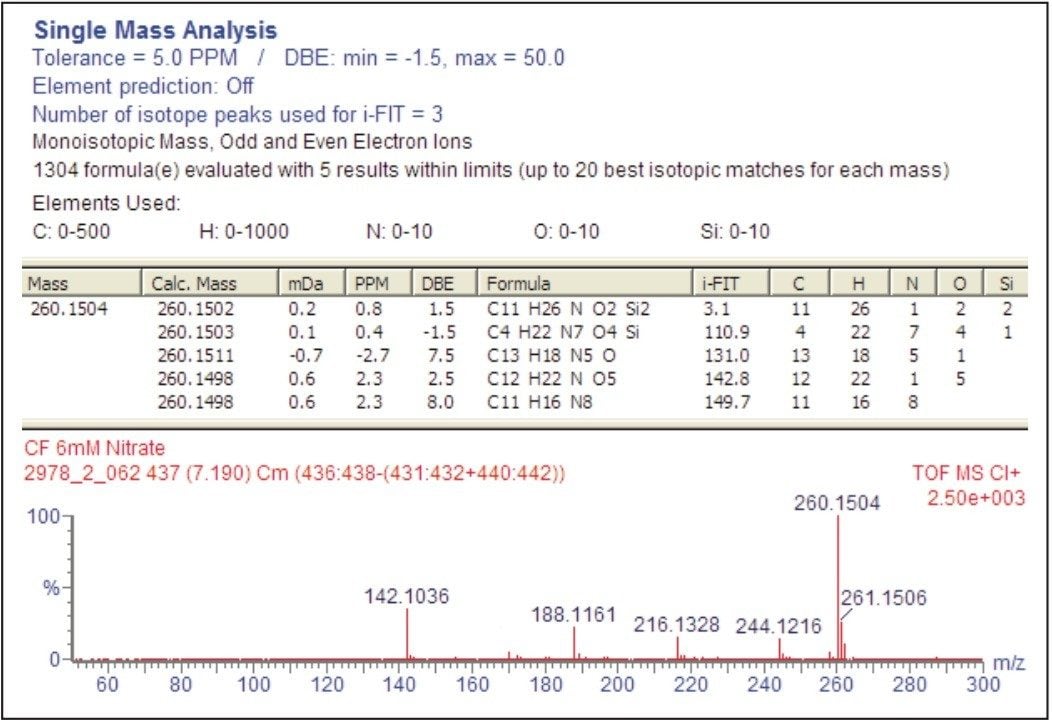
The levels of amino acids were observed to decrease during the time course of the nitrogen starvation, consistent with the results reported by Urbanczyk-Wochniak and Fernie.2 The amino acids were identified using the NIST library of EI spectra and their molecular masses confirmed by exact mass CI analysis. 

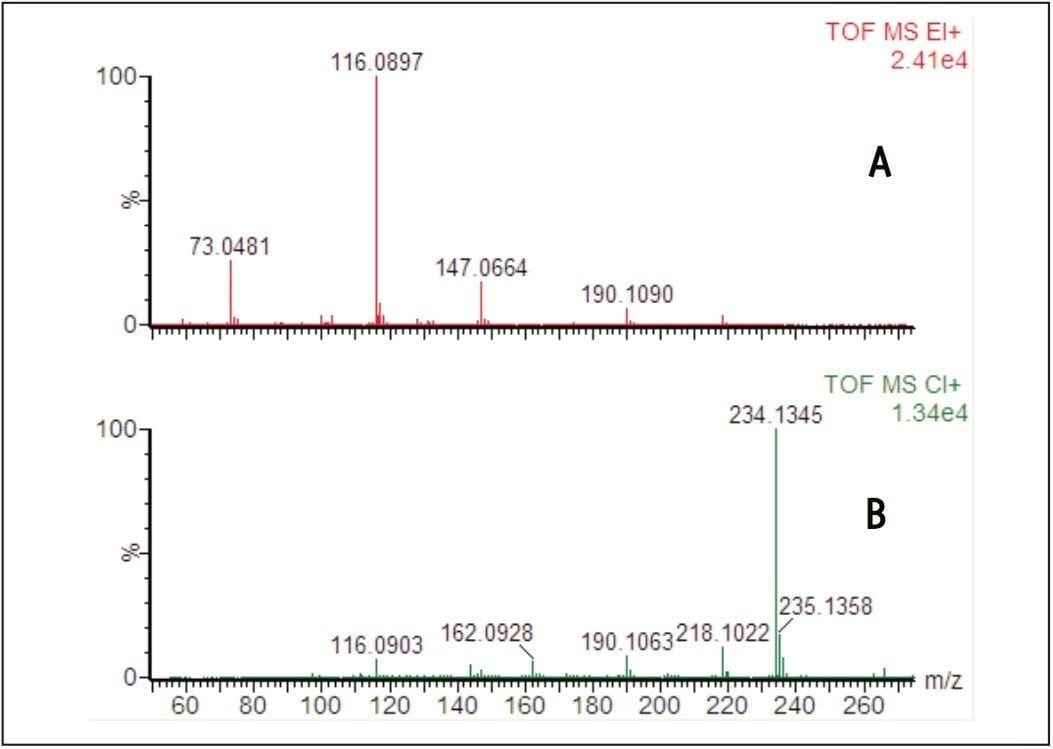
Representative EI and CI spectra obtained from a leaf sample grown under conditions of adequate nitrogen for plant growth are shown in Figure 5. The EI spectrum gave a good match for the bis-trimethylsilyl derivative of alanine and the molecular mass was confirmed by exact mass CI with a measured mass of 234.1345 (error -0.1 mDa, -0.4 ppm) for the protonated molecule.

EI and CI spectra
Figure 5. (a) EI and (b) CI spectra from peak eluting at 5.09 minutes from leaf extract, grown under adequate nitrogen, identified as N,O-Bis-(trimethylsilyl) alanine. 

Metabolite identification by GC-MS is routinely carried out by comparing acquired EI spectra to spectral libraries such as NIST. However, many plant metabolites are either not in the library or the EI spectra are dominated by the derivatized groups, making de novo identification of unknown peaks difficult. CI is a less energetic process and often results in the formation of molecular ion species with reduced fragmentation, allowing access to molecular ion information. 

Table 1 lists the calculated masses of the protonated molecules of some of the amino acids showing a significant reduction in both roots and leaves after nitrogen starvation and the masses reported after processing all the CI data through MarkerLynx. It can be seen that exact mass measurements of <5 ppm can be obtained routinely giving confidence in the identification of the elemental compositions of any unknown metabolites. T his confidence is further enhanced by the use of i-FIT for isotope matching.

Table of results for amino acids showing a significant decrease in roots and leaves after nitrogen starvation, identified by searching against the NIST EI Database
Table 1. Table of results for amino acids showing a significant decrease in roots and leaves after nitrogen starvation, identified by searching against the NIST EI Database. 

An example of the use of i-FIT can be seen in Figure 6 where five potential elemental compositions are reported for m/z 260, within the 5 ppm limit set. However, closer examination of the results shows that the smallest i-FIT (3.1) corresponds to the correct elemental composition for the trimethylsilyl derivative of proline, C11H26NO2Si2

Elemental composition report with i-FIT for the protonated molecule of derivatized proline
Figure 6. Elemental composition report with i-FIT for the protonated molecule of derivatized proline. 

Conclusion

The combination of exact mass EI and CI analysis with processing through the MarkerLynx Application Manager has been shown to be an ideal method to detect and identify the changes in metabolite profiles in response to an environmental stimuli, in this case nitrogen starvation. 

GCT Premier operation in CI mode provides useful data by the generation of pseudo-molecular ions. Exact mass measurements of <5 ppm and the use of i-FIT for matching isotope patterns means that the elemental compositions of the intact derivatized compounds can be readily derived. Therefore the use of CI in conjunction with EI library matching can be a powerful tool in the identification of plant metabolites of unknown structure. 

The results presented suggest that nitrate nutrition has wide-ranging effects on plant metabolism, with nitrogen starvation resulting in a decrease in many amino acids with a concurrent increase in the levels of several carbohydrates. 

References

  1. Scheible et al. Plant Cell. 1997 9: 783–798. 
  2. Urbanczyk-Wochniak and Fernie. Journal of Experimental Botany. 2005 56: 309–321. 
  3. Bölling and Fiehn. Plant Physiology. 2005 139: 1995–2005. 
  4. Orsel et al. Planta. 2004 219: 714–721. 
  5. Gullberg et al. Anal. Biochem. 2004 331: 283–295. 
  6. Fiehn et al. Anal. Chem. 2000 72: 3573–3580. 

720002147, April 2007

Back To Top Back To Top