• Application Note

On-Line Sample Cleanup and Peak Focusing

On-Line Sample Cleanup and Peak Focusing

  • Jeanne B. Li
  • Waters Corporation
Woman holding pill and glass of water in hands taking emergency medicine, supplements or antibiotic antidepressant painkiller medication to relieve pain, meds side effects concept, close up view

Abstract

This application brief highlights the analysis of on-line sample clean up and peak focusing using Alliance LC-MS System.

Introduction

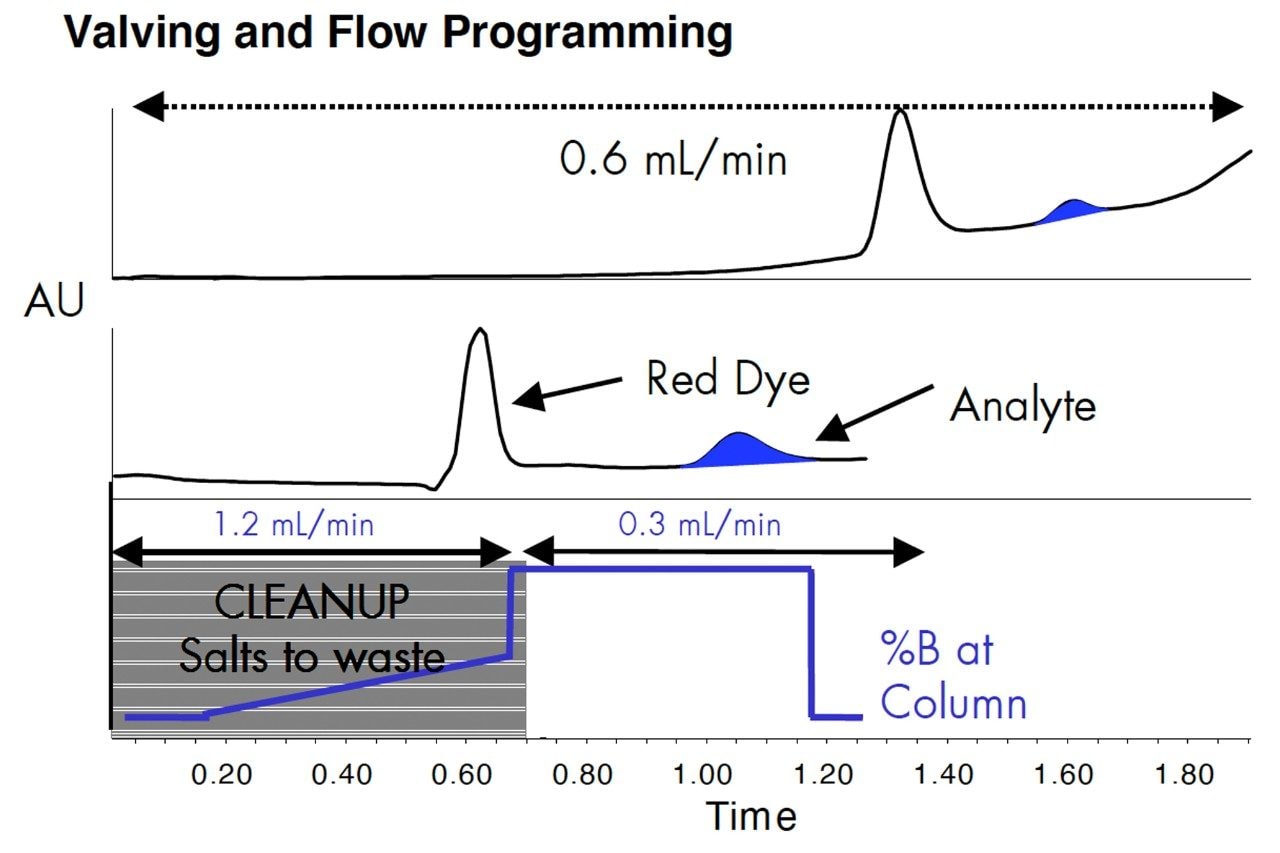
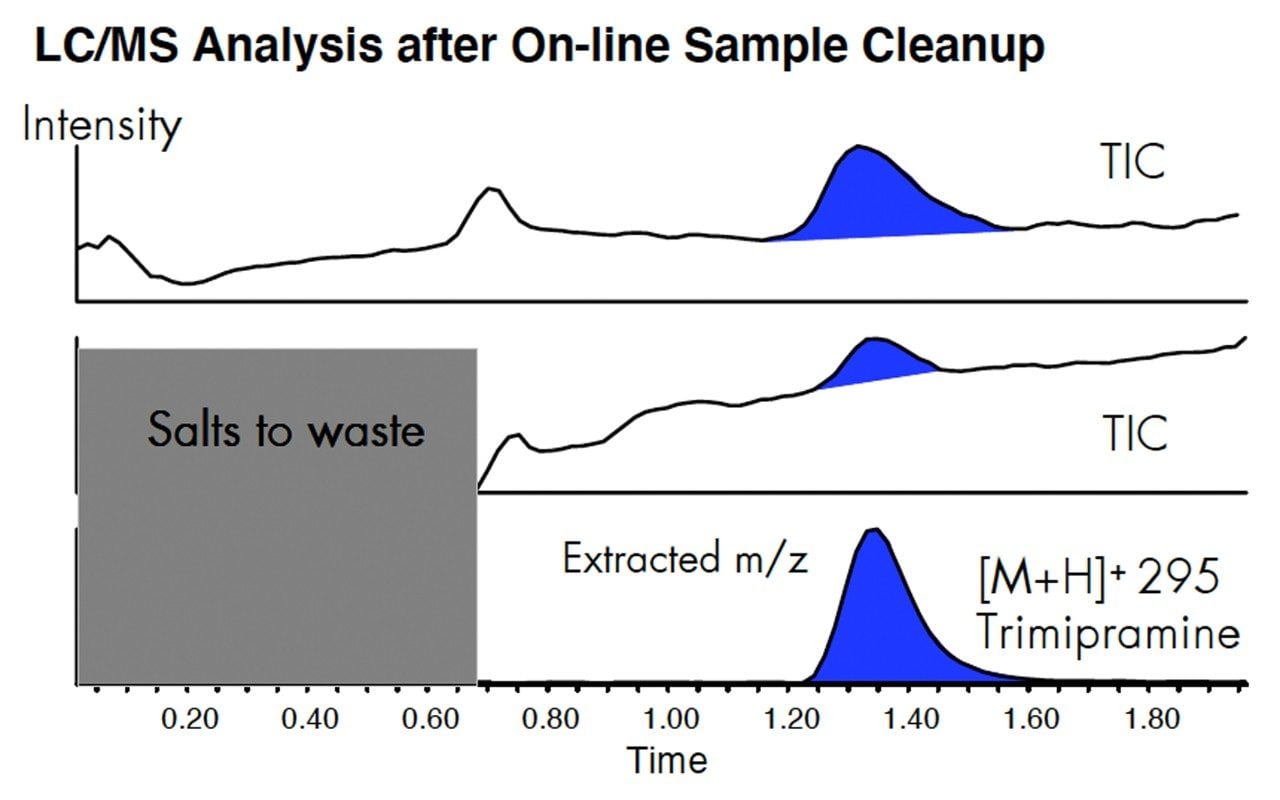
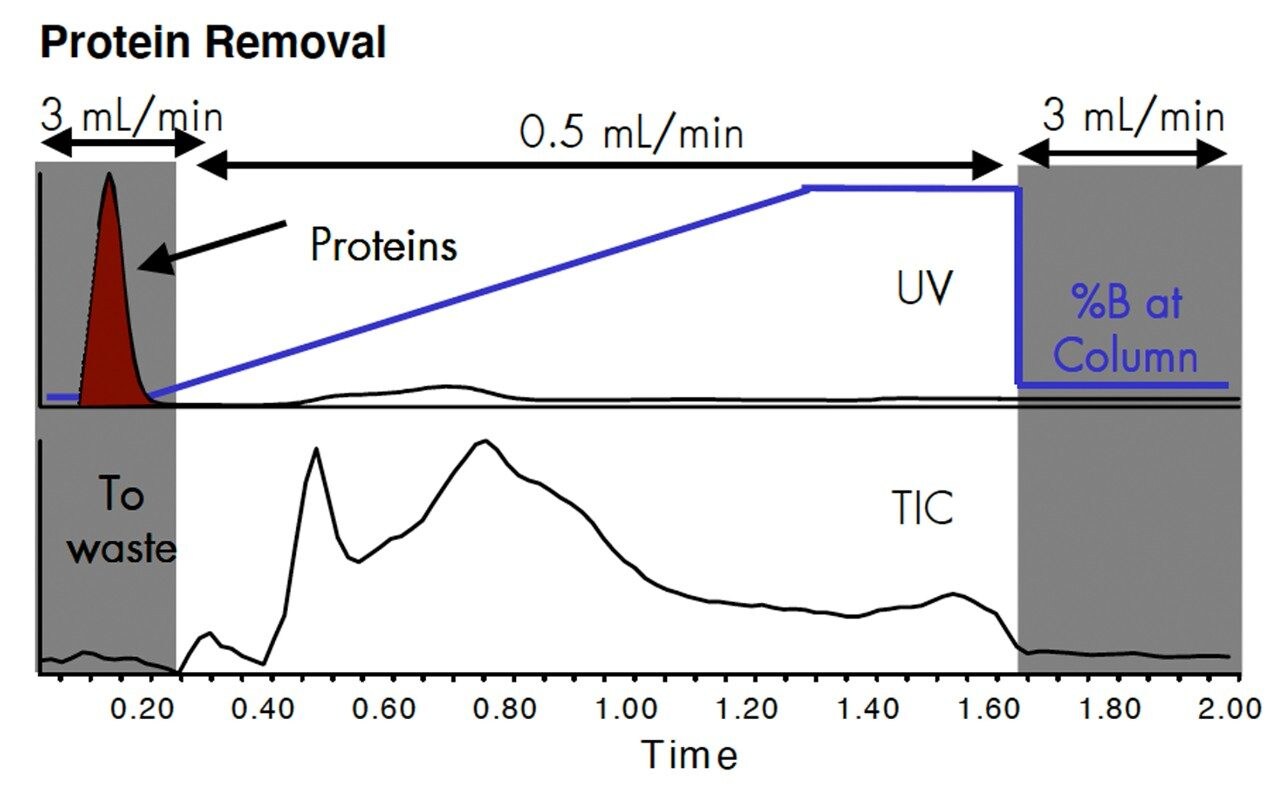
More LC-MS samples need to be analyzed per day. Many samples contain complex matrices. Removing the matrix can 1) reduce ion suppression from salts, 2) keep the MS sample cone clean longer, 3) reduce background ions. This can lead to greater detection sensitivity. With column switching valves and flow programming, it is possible to perform rapid on-line sample cleanup. 

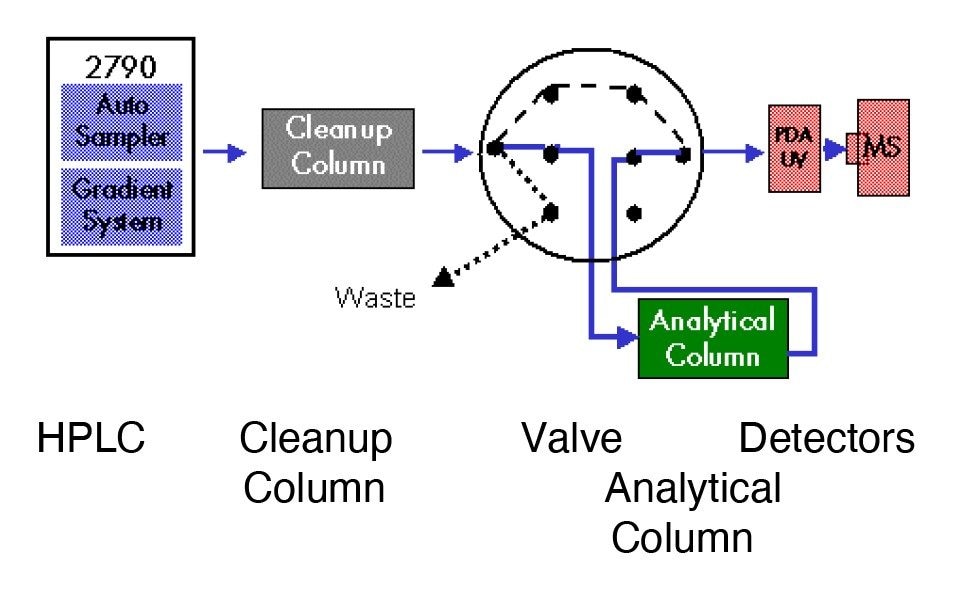
On-line sample cleanup in LC-MS analyses can be a routine procedure. Solid phase extraction columns and small reverse phase columns have been designed to be rugged. Software and hardware integration of the HPLC component parts, autosampler, solvent delivery and column switching valves, has improved the ease-of-use aspect. Some methods development is still required to optimize online sample cleanup. Examples illustrate approaches that can be taken. 

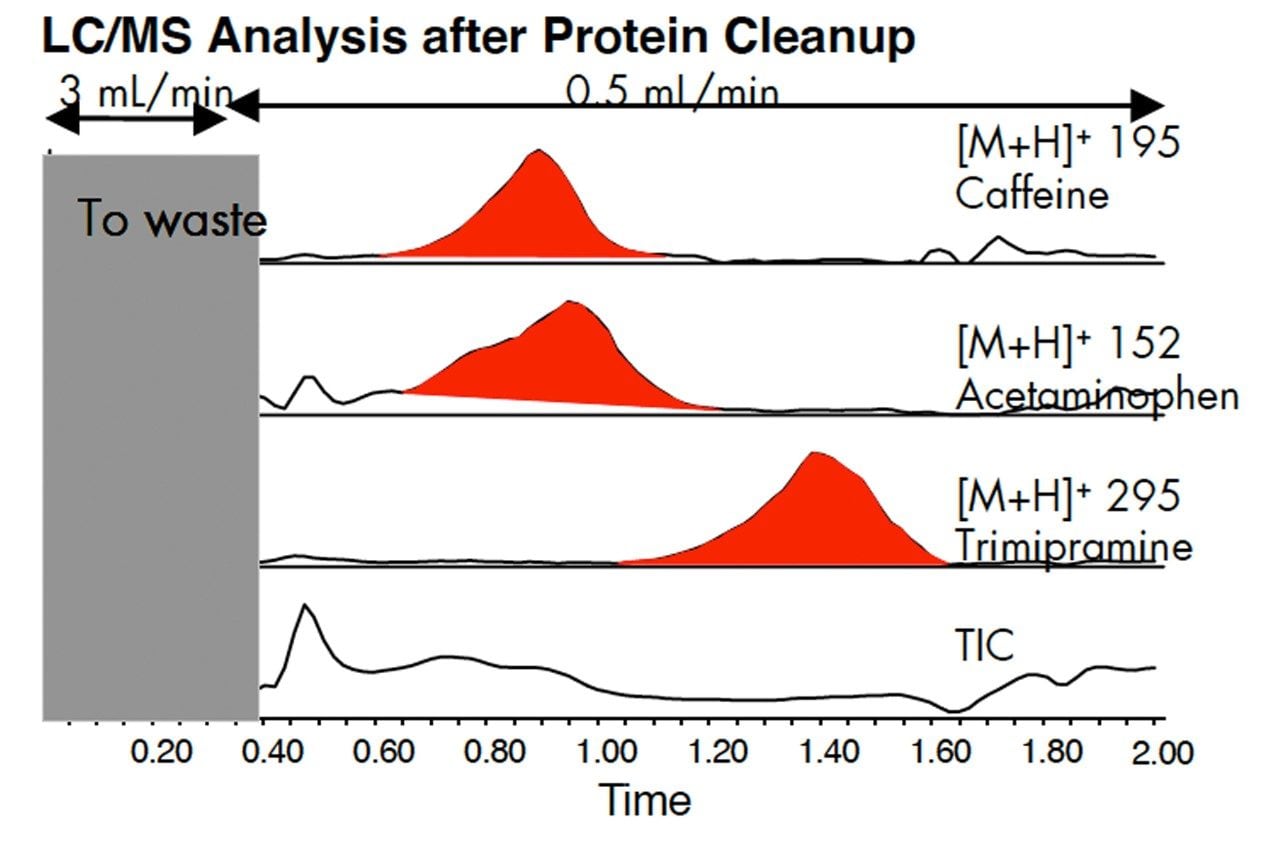
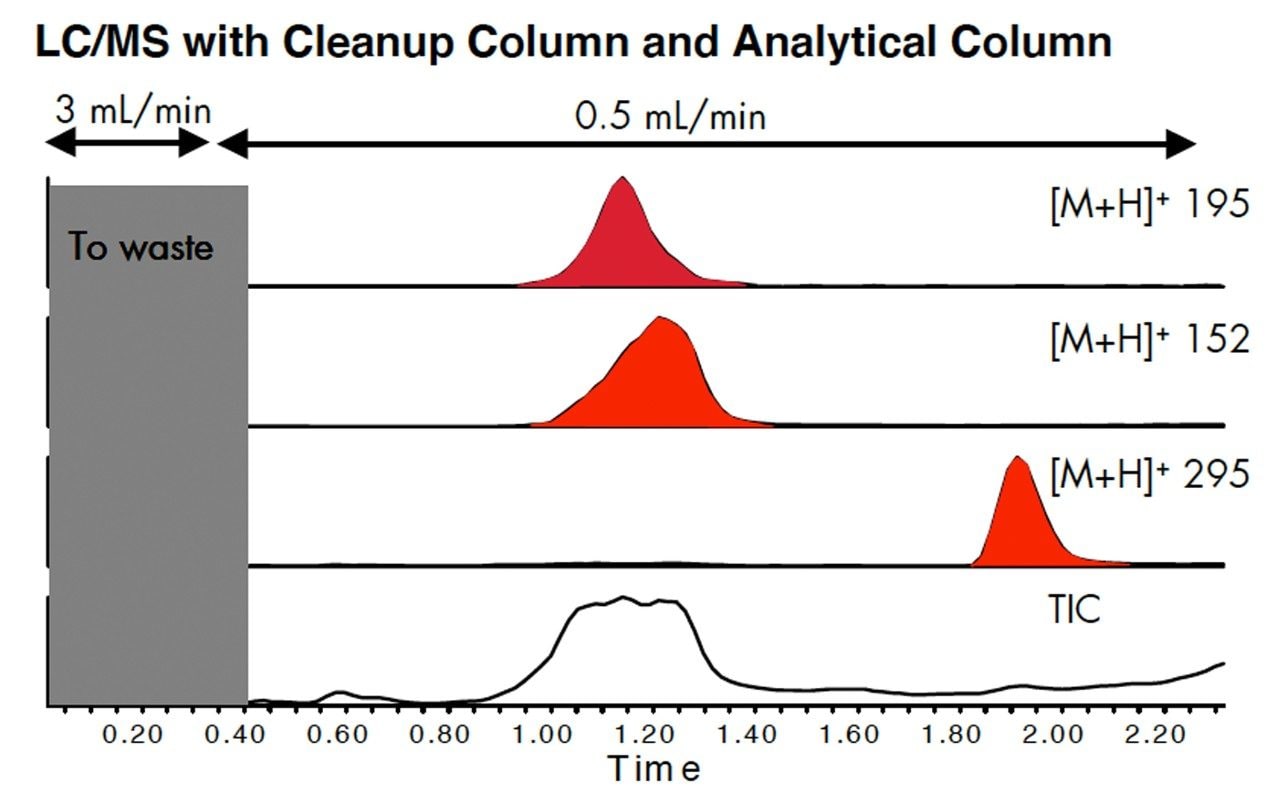
On-line sample cleanup automates a time consuming process. The use of an additional analytical column after the sample cleanup column focuses the analyte peaks, increasing the peak height, decrease the peak width and tailing. This results in an increase in sensitivity (signal-to-noise ratio). 

With column switching valves and flow programming, cleanup and analytical columns, it is possible to perform on-line sample cleanup and fast gradient separations with cycle times of 3 to 5 minutes. This can make a LC-MS laboratory more productive by increase the sample throughput per day.

Experimental

LC Conditions

LC syetem:

Waters Alliance HT LC-MS system consisting of a 2790 Separations Module with 3-column selection valve, 996 photodiode array and Z Spray mass detector (ZMD)

Columns:

Waters Oasis HLB, 2.1 x 20 mm, 30 μm and Waters XTerra MS C18, 2.1 x 10 mm or 2.1 x 30 mm, 3.5 μm

Mobile phases and solvents:

Acetonitrile and water gradients containing 0.1% formic acid

Samples:

Small drug molecule s spiked into the matrices

Sample matrix:

Hanks balanced salt solution (280 mosm/L salts) or calf serum

ZMD MS Conditions

Source:

Electrosppray positive mode ionization optimized for the analytes

Full scan:

100–6000 m/z

Photodiode array:

Wavelength range = 210 to 500 nm,

resolution = 1.2 nm, acquisition rate 2 points per sec

Results and Discussion

Valving and Flow Programming

The drug trimipramine was spiked into Hanks Balanced Salts Solution (280 mosm/L) tissue culture medium. 10 μL was injected onto the XTerra MS C18 Column, 2.1 x 10 mm. The gradient was 90% water-10% methanol to 10% water-90% methanol, both containing 0.1% formic acid.

The upper panel is the separation at 0.6 mL/min. The analyte peak is colored in blue. The red dye is a pH indicator in the Hanks solution. The middle panel is the chromatogram after optimization of the flow rate for rapid sample cleanup (1.2 mL/min) and a mass spectrometer compatible flow rate of 0.3 mL/min during the detection phase. The lower panel shows the flow and solvent programming and the time the valve was open to waste for the middle panel. The run was completed in less than 1.4 minutes, with a cycle time of less than 2.5 minutes. UV detection was used for the methods development.

Removal of salts for the matrix
Figure 1. Removal of salts for the matrix .The drug trimipramine was spiked into Hanks Balanced Salts Solution (280 mosm/L) tissue culture medium. 10 μL was injected onto the XTerra MS C18 Column, 2.1 x 10 mm. The gradient was 90% water-10% methanol to 10% water-90% methanol, both containing 0.1% formic acid.

LC-MS Analysis after On-line Sample Cleanup

Using the optimized method, LC-MS analysis was conducted on the same sample and matrix. The upper panel is the TIC baseline when no valving is used. The middle panel is the TIC and the lower panel is the extracted [M+H]+ of trimipramine.

Removal of the salts from the sample matrix will increase the robustness of the method, reducing the need to clean the mass spectrometer.

Example of analysis after salt removal
Figure 2. Example of analysis after salt removal.

Protein Removal

Calf serum or the drugs, caffeine, acetaminophen and trimipramine were spiked into calf serum. 10 μL was injected onto an Oasis HLB cartridge, 2.1 x 20 mm. The gradient was 90% water-10% methanol to 10% water-90% methanol, containing 0.1% formicacid.

When calf serum was injected onto an Oasis column and the UV monitored at from 200–500 nm, the protein eluted very quickly. Other components in serum were retained by Oasis and eluted during the methanol gradient. Flow programming allows rapid sample cleanup and reequilibration of the column. The unwanted components were sent to waste via the switching valve.

Removal matrix proteins
Figure 3. Removal matrix proteins.

LC-MS Analysis after Protein Cleanup

After sample cleanup, the flow rate was decreased to 0.5 mL/min to be more compatible with electrospray ionization and then the flow was switched to the mass spectrometer. In this example, the analytes were eluted from the Oasis column by the gradient. There was minimal separation of the hydrophilic from the hydrophobic compounds.

By removing the protein, several types of interferences were reduced: coelution of matrix with the analytes, contamination of the reverse phase column, possible suppression of ionization of the analytes. The result is a more robust method when many samples are run.

Analysis after removal of proteins
Figure 4. Analysis after removal of proteins.

LC-MS with Cleanup Column and Analytical Column

The separation on an Oasis HLB 2.1 x 20 mm column was shown above. Although the run time was short, the peak shapes were poor. Sensitivity of detection is reduced by having broad, tailing peaks.

Peaks can be focused by eluting the analytes from the Oasis column onto a short analytical column, XTerra MS C18. In this example, better peak shape increased peak height by 2.5 times. To achieve this the run time was increased by 0.5 minute. Each method must be evaluated for the requirements of speed versus sensitivity.

Peak focusing for improved peak shape and sensitivity
Figure 5. Peak focusing for improved peak shape and sensitivity.

Featured Products

WA00299, June 2000

Back To Top Back To Top