Rapid Analysis of Titer and Media Components Using Bioprocess Monitor Application Software
Mark D. Wronaa, Elizabeth Embreyb, Yun W. Alelyunasc, Jurgen Sanesa, Caitlyn Da Costab, Patrick Boyceb
a Waters Corporation Milford, MA, USA
b Waters Corporation Wilmslow, UK
c Waters Immerse Lab, Delaware, USA
Published on November 24, 2025
Abstract
LC-MS offers unparalleled analytical depth for bioprocessing, yet its adoption in real-time process analytical technology (PAT) has been slow due to analytical complexity and lengthy data review, leading to the delay of data availability. The new Bioprocess Monitor Application Software enables timely insights into protein attribute and media monitoring assays performed by LC-MS. Simplifying software, as well as enhancing integration with automation and third-party platforms, makes LC-MS more accessible and PAT-ready for bioprocess teams.
Benefits
- Routine analysis of media and titer: Software designed to generate and analyze amino acid, vitamin, metabolite, and titer results with minimal setup. Can be configured for other assays.
- Near real-time results: Deliver rapid quantification with walk-up system accessibility.
- Real-time trending: Immediately view results by bioreactor or DOE factor/conditions.
- Automation-friendly : Compatible with automation such as the Andrew+™ Pipetting Robot and the ACQUITY™ Automation Portal.3
- Third party software integration: Dedicated software integrations to seamlessly connect with Ambr 15/250 HT control software and JMP® data analysis tools.
Introduction
PAT, LC and LC-MS
LC-MS is one of the most powerful analytical tools available for bioprocessing, offering unmatched precision and depth of insight into complex biological systems. Historically, its use for real-time applications has been limited for routine and fast operations that are hallmarks of PAT technologies. Despite being data-rich and enabling critical insights, LC and especially LC-MS assays are often relegated to post-hoc analysis rather than real-time or right-time process guidance. This creates a disconnect between when critical decisions must be made and when the necessary data becomes available, often the disparity is weeks or longer.
LC and MS technologies offer deep insights into critical quality attributes of therapeutics and are also increasingly used to monitor complex feed and spent media dynamics. Enhancing the speed, usability, and integration of these advanced analyzers would be transformative for PAT and remains a major focus across the industry.1 Accelerating LC-MS data delivery allows process development teams to immediately inform study design, shorten development cycles, and unlock opportunities for direct process control and true PAT implementation.
To enable broader adoption of LC-MS as a PAT tool, a shift is needed to emphasize usability and rapid sample-to-result workflows capable of near real-time monitoring of bioproduction. Simply put, LC-MS should be made to work and behave more like other commonly implemented analyzers.
Making Technology Fit for Purpose
The BioAccord™ LC-MS System combines high-quality UPLC™ separations, enabling UV and/or MS-based assays with a powerful, easy-to-use mass spectrometer that can analyze large biological molecules like monoclonal antibodies (mAbs).2
To make this technology even more accessible for bioprocessing teams, the next step is simplifying the software—making setup, data processing, data visualization and review easier. At the same time, the software also needs to address challenges around transferring data (metadata and results) efficiently between systems.
Making LC-MS Software PAT Ready
The new Bioprocess Monitor Application, part of the waters_connect™ Informatics Platform, addresses the software gap by offering simplified software that streamlines setup, data processing, and review—while also being purposefully designed to enable data transfer with 3rd party systems.
Experimental
Detailed analytical protocols and methodology (LC, MS, and sample preparative protocols) compatible with this application and used to produce this application note have been independently published or published at onelab.andrewalliance.com/library.4,5 Bioprocess Monitor Application can be installed independently on a BioAccord/waters_connect installation, but has been designed and tested to be used with Andrew+ family of automation products if automation/sample preparation is required.
System Details
BioAccord System with ACQUITY Premier System:
ACQUITY Premier UPLC BSM, ACQUITY Premier UPLC FTN, ACQUITY Column Manager (CM-A), ACQUITY RDa™ Mass Detector, ACQUITY Premier TUV Optical Detector, ACQUITY Automation Portal
Andrew+ Platform Key Components:
Andrew+ Pipetting Robot, Andrew Benchhub, Andrew Automation Portal Integration Kit
Software/Workstation:
Acquisition and Processing: Bioprocess Monitor 1.1 running on waters_connect 4.0 or newer
Automation Software: OneLab™ 1.23 Enterprise or newer
PC: P5 Tof workstation (176006017), compatible with Windows® 10 or 11
Results and Discussion
Figure 1 provides a basic overview of the capabilities of the Bioprocess Monitor Application. These include routine setup, running, and reporting of the assays. The software is designed to work in highly connected environments and was designed to work with other software packages to enable end-to-end workflows implemented by bioprocess groups and bioprocess analytical support functions.

Figure 2 shows the welcome screen in Bioprocess Monitor Application. There are 3 functions of the principal landing page. Analyses (routine running or processing of samples), is where daily activities will largely occur. A previous analysis (for example daily campaign monitoring) may be continued or a new campaign/analysis can be started. Instrument methods may be calibrated or updated using the calibration set panel. The final panel manages the processing methods themselves, such as titer assay or cell culture metabolite method.
Bioprocess Monitor Application can be applied to any method (UV or MS-based) and is simple to set up and use. For this application, all data collected were run with methods previously published.4,5

Components of Bioprocess Monitor Software
1. Processing Methods
Processing methods contain all the information required to process the LC-MS data quickly and efficiently. Methods for analytes are stored in a simple, shareable, editable table format, shown in Figures 3 (MS type data) and 4 (UV type data).
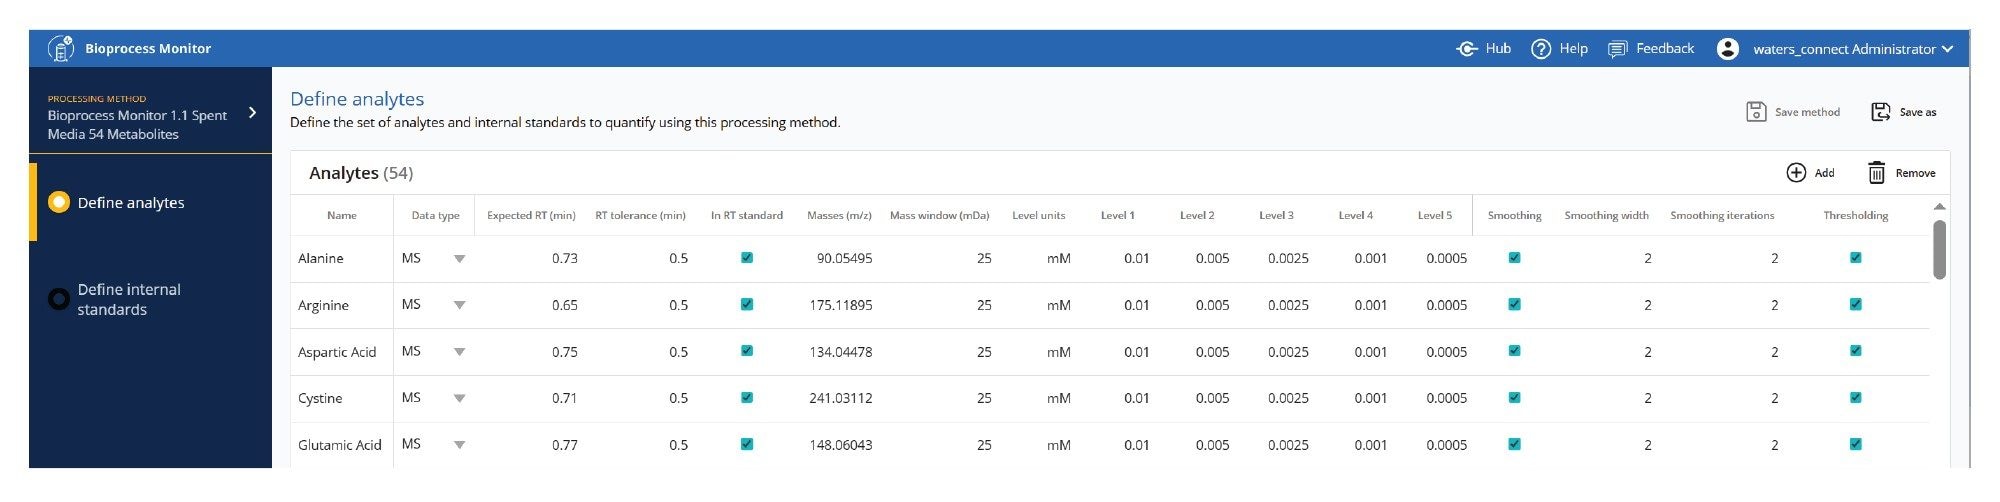
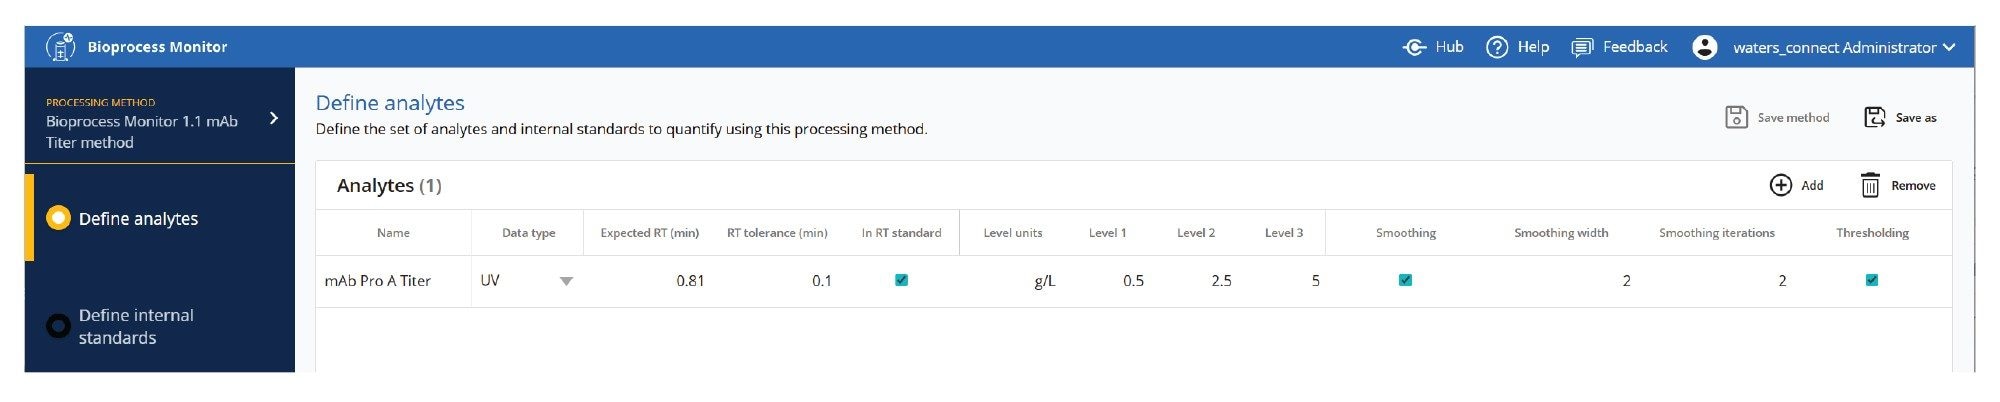
Standard amino acid, standard metabolite, or protein monitoring methods are shown, but are also fully customizable to monitor additional observed, proprietary metabolites or protein attributes or isoforms. Analytes with standards are processed quantitatively, analytes without standards may also be collected for review by response (or relative response using an internal standard). Figures 3 and 4 respectively show methods for amino acid analysis and protein based (titer or attribute) analyses. Expected RT, RT tolerance, and masses and mass window are used to define the peak to be detected in the dataset. Level units and levels specify the reporting units and standard levels to quantify components. Additional parameters for internal standards, peak picking, smoothing as well as thresholding, all used to control the quality of the processing method, are also available.
2. Calibration Set – Calibration of the Methods to Run Samples Routinely
In the Bioprocess Monitor Application, the processing methods that are defined are then used for calibration. This allows the user to calibrate methods as part of the routine system setup/startup. This ensures the system is system-ready in advance of running daily bioreactor samples.
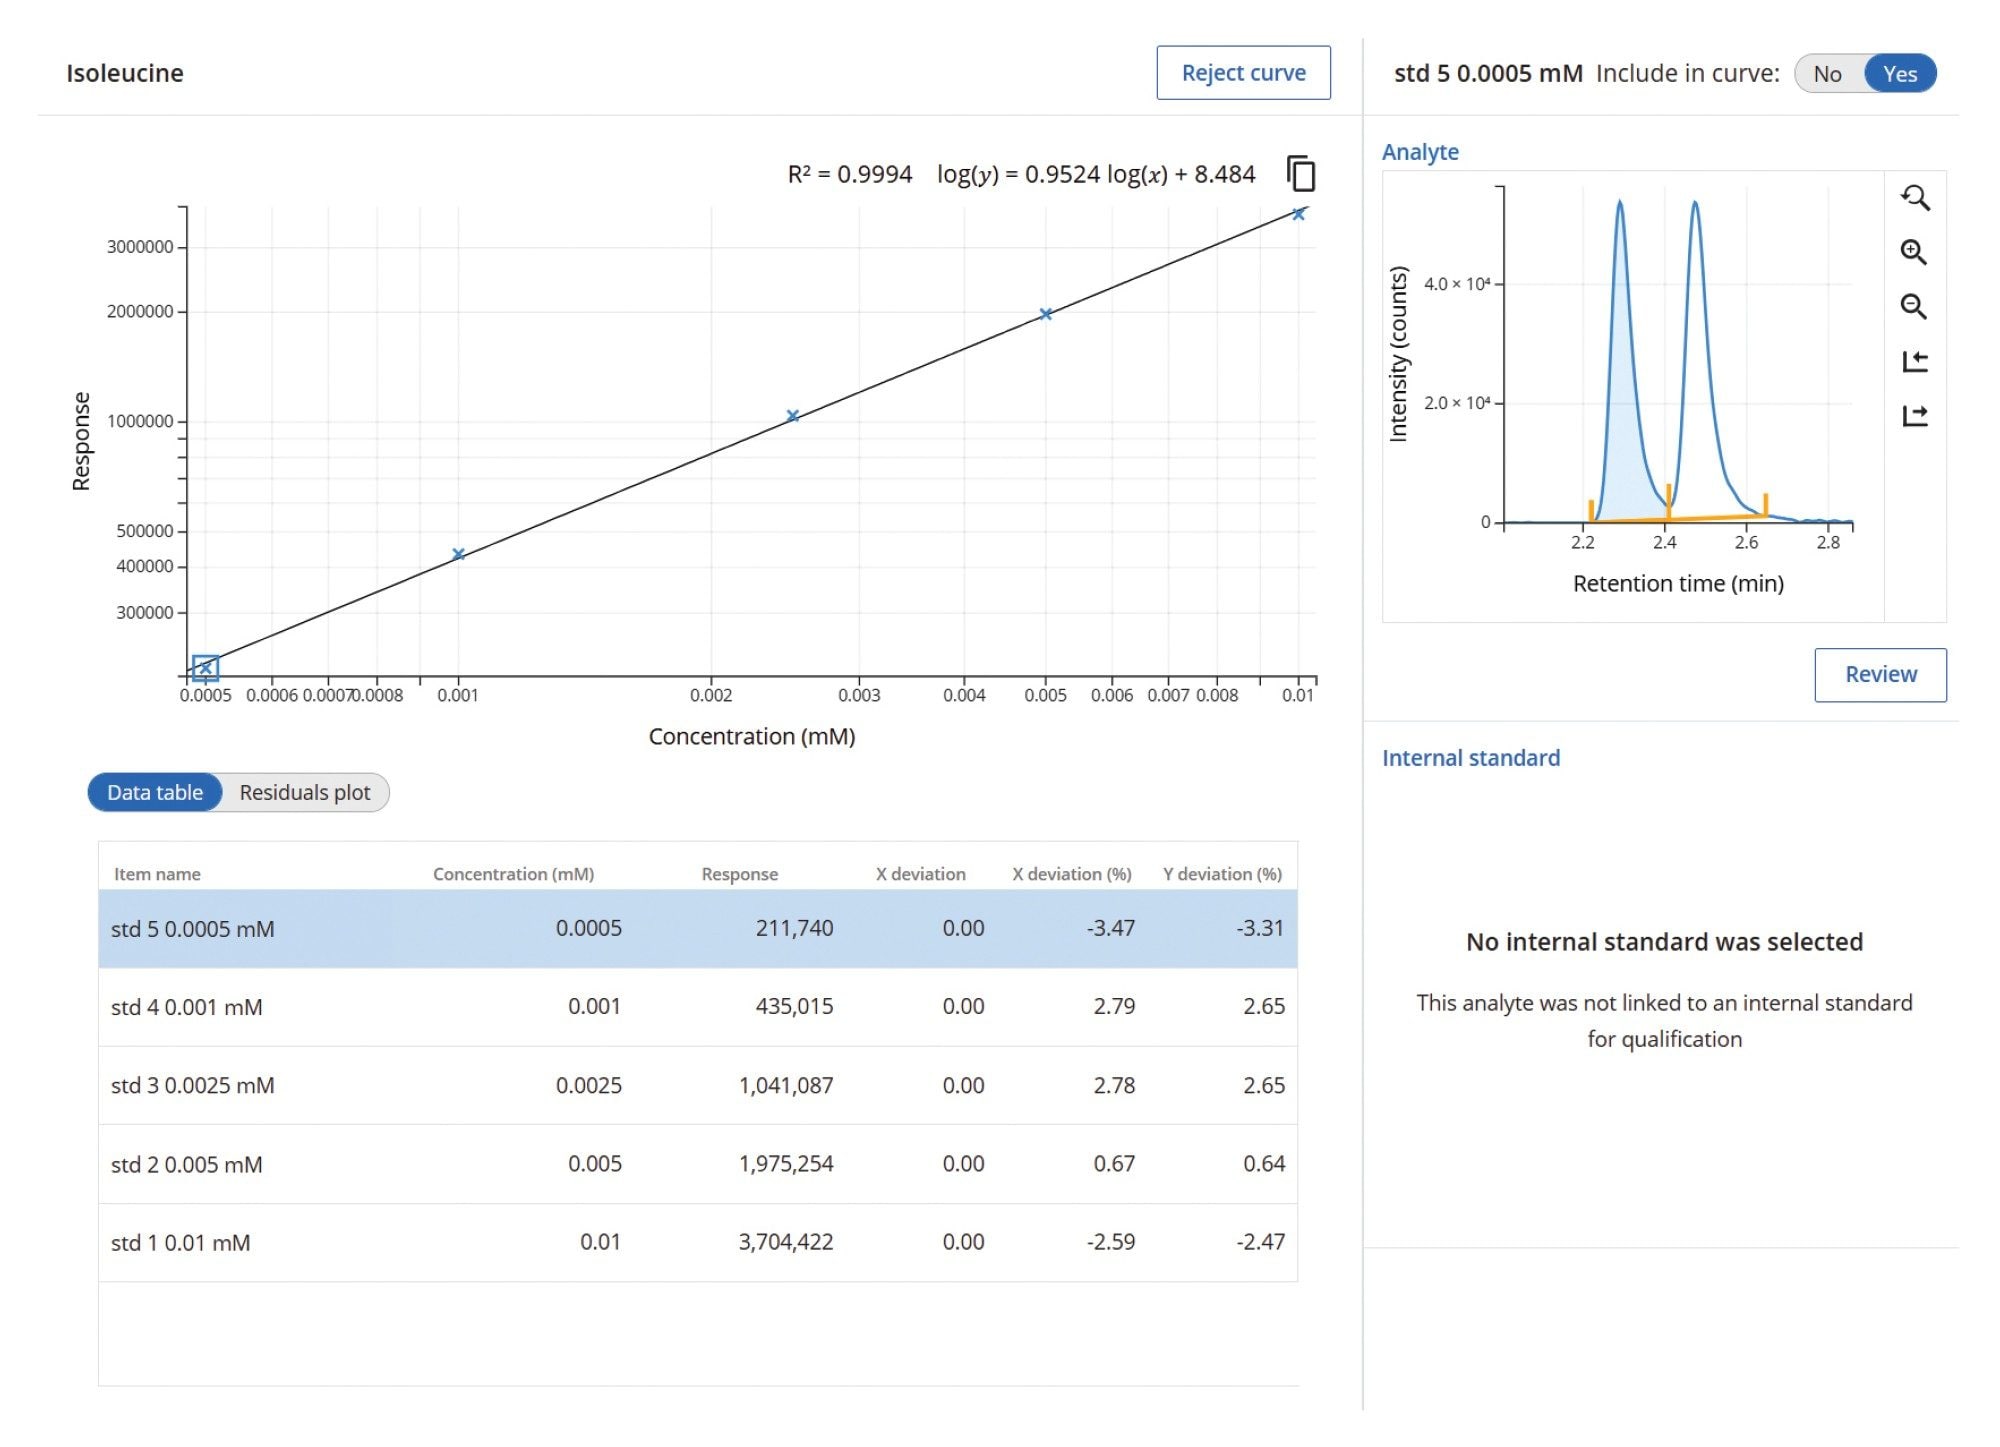
After running calibrants, the user processes and reviews the calibration data. The methods are calibrated using a single page, enabling simple review of the data. All samples that meet the basic criteria for processing will pass, standards that require reviewing will be flagged for review (exception-based review). Figure 5 shows the calibration for isoleucine. Once the calibrations have been reviewed, the data is ready to be collected. All subsequent data collected referencing this calibration data set will be automatically processed to generate fast quantitative results when samples are run.
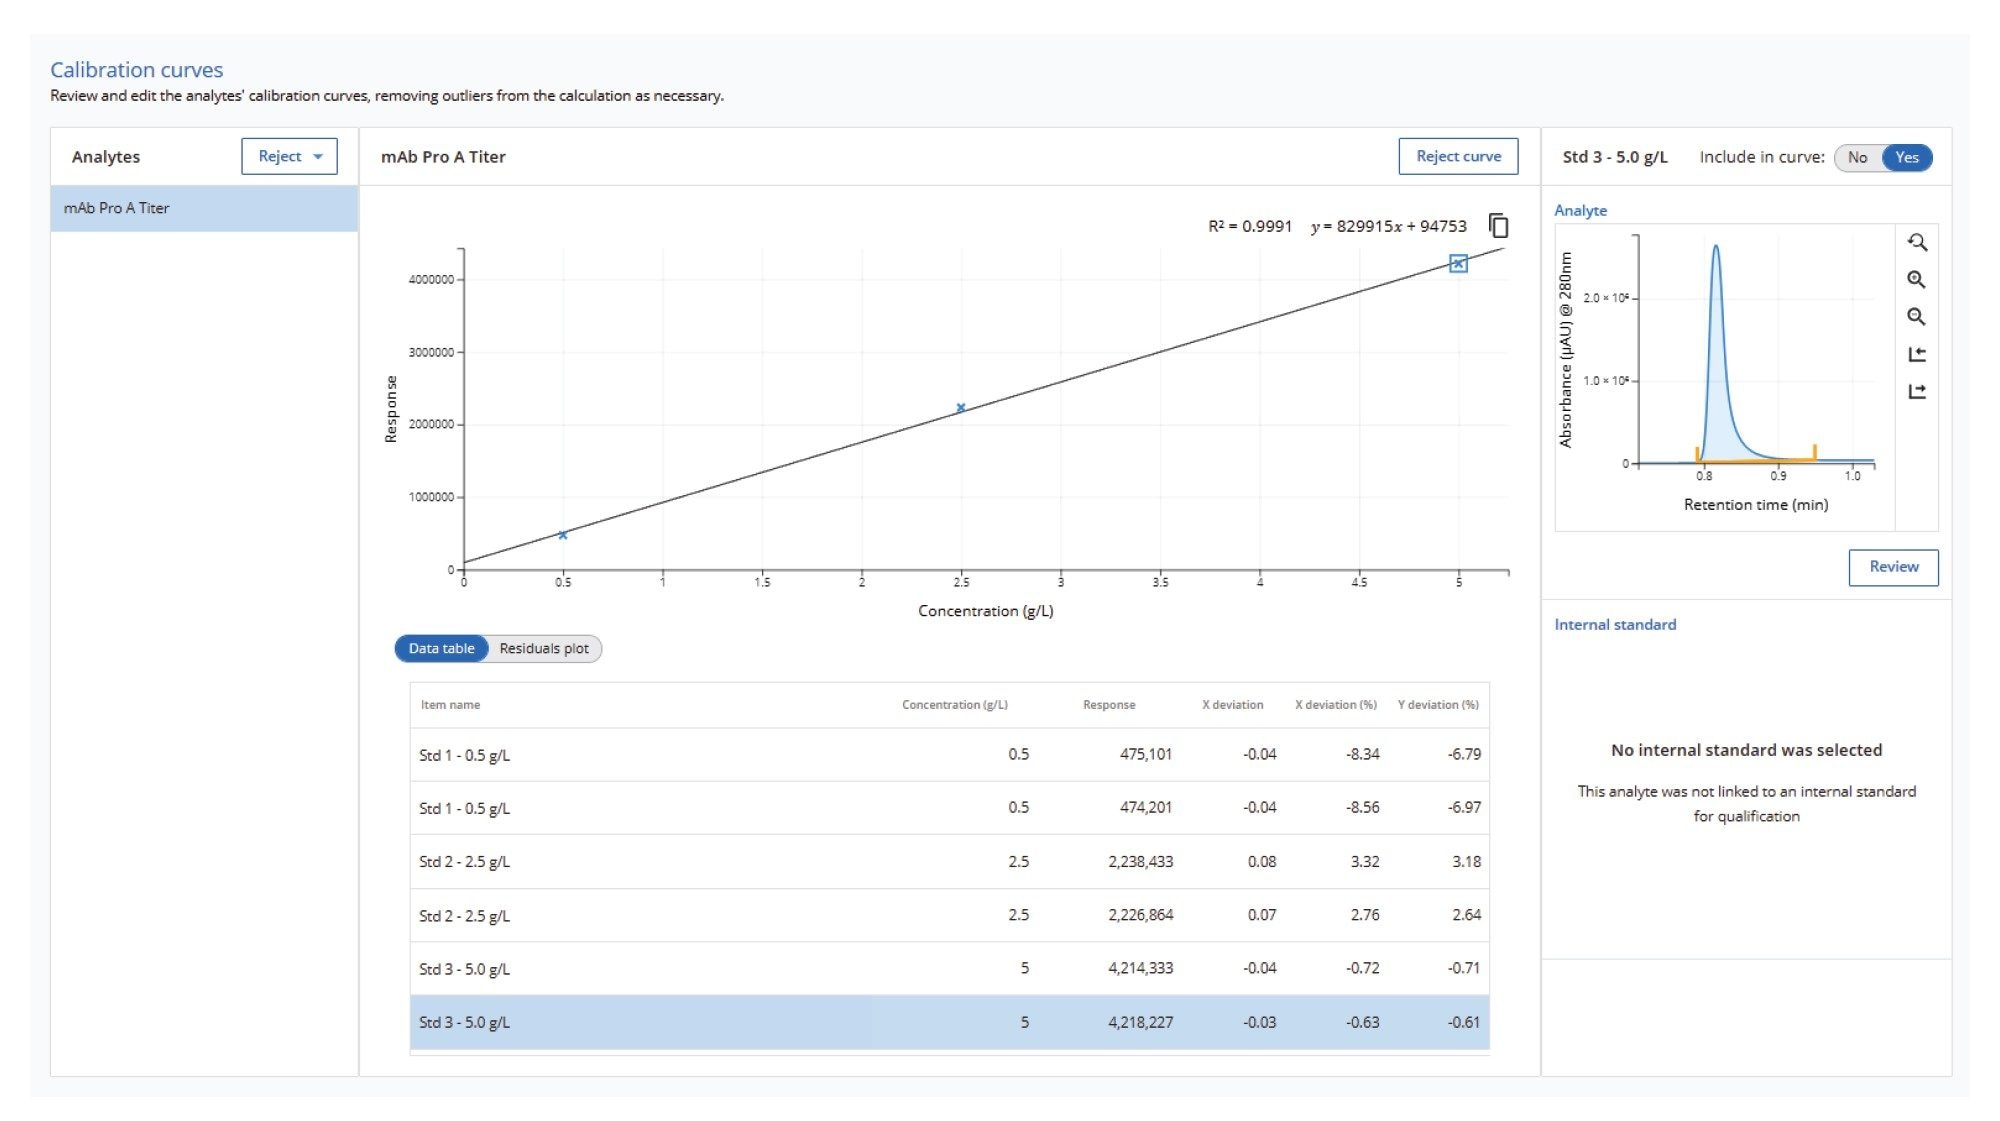
Another method is provided for analyzing protein titer. Figure 6 shows an example of a simple protein standard curve calibration used to run samples for a protein A titer assay. Highly sensitive and fast Protein A assays are performed using the BioResolve™ Protein A Affinity Column.5
Ensuring High Data Quality and Instrument Uptime During Sampling of Campaigns
Typical batch or perfusion process development campaigns can be >= 2 weeks. In-process routine monitoring of bioreactors during this time needs to be quick and robust. The Bioprocess Monitor Application has been designed to facilitate this using several features.
A summary of the features of the calibration set includes:
- The system and method can be fully calibrated in advance, so that once samples are collected during campaigns, they can be run with minimal interruptions.
- Automated retention time (RT) correction quickly identifies peaks at startup and updates the instrument methods.
- User-friendly review features include clean layouts and review-by-exception workflows.
3. Analysis – Creating Analyses, Processing and Reviewing Data
Setting up the Analysis
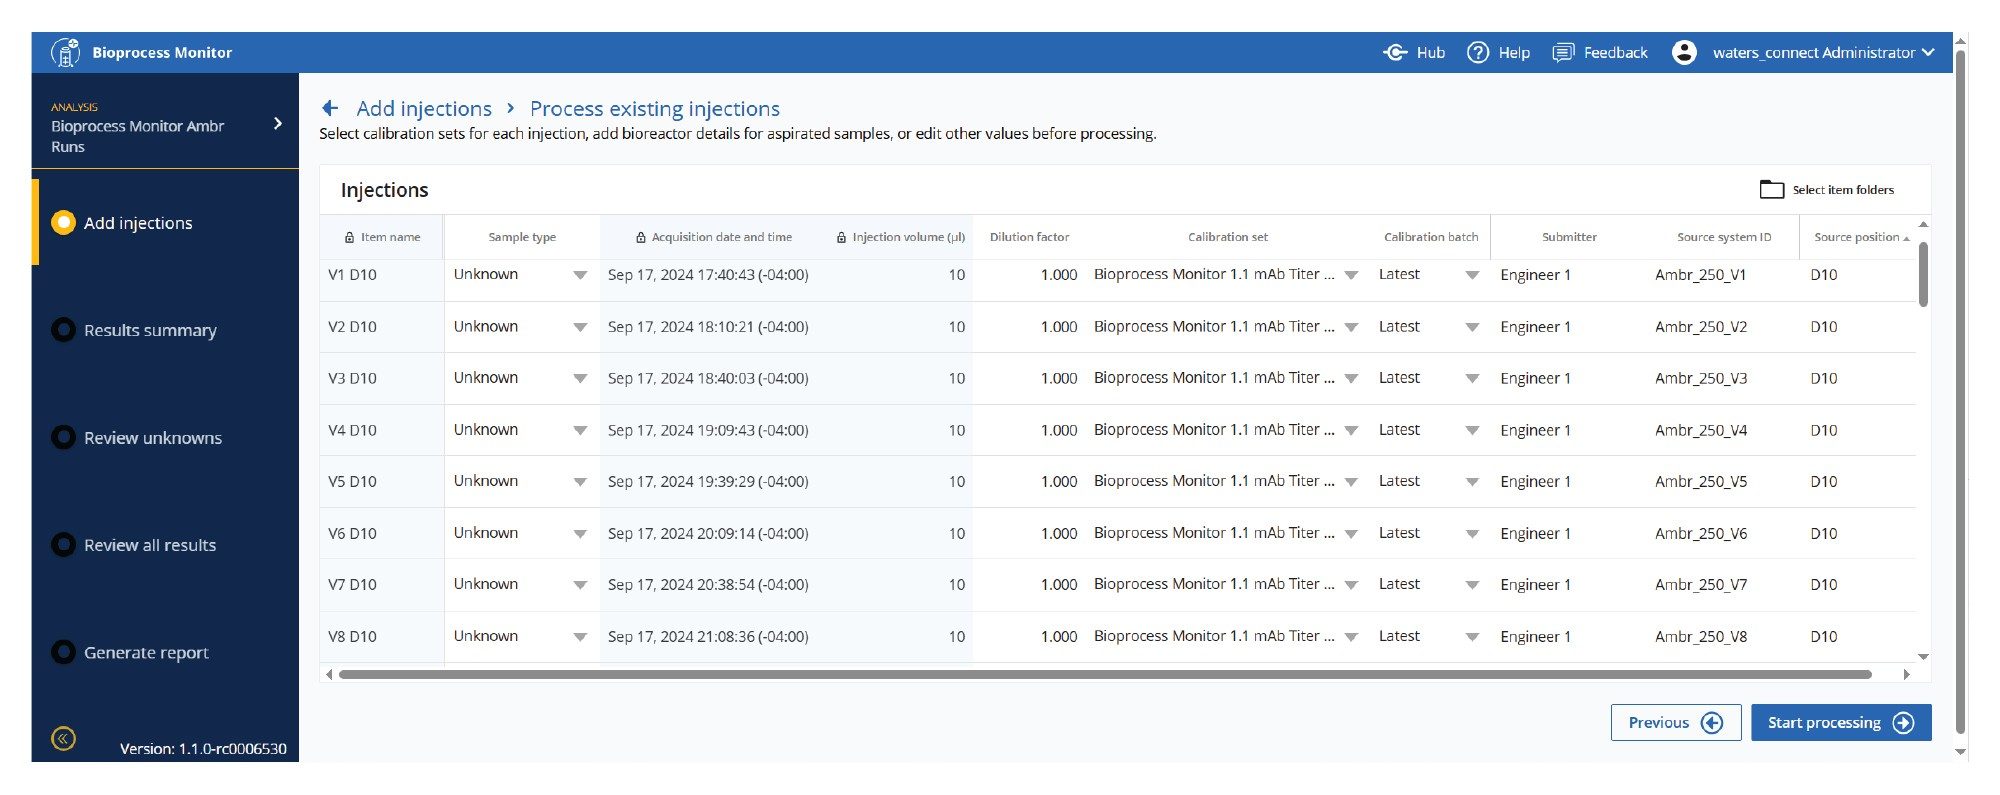
Data can be acquired and processed directly or reprocessed using the Bioprocess Monitor Application. In Figure 7, an Ambr 250 run with 8 vessels run with a DOE investigation of media, pH, and gas variables was processed using Bioprocess Monitor Application. There are 5 steps/views to help users run, view, and report data, which are accessed along the left panel of the analysis.
Add Injections
Injections may be added either through reprocessing or via acquisition through sample submission. If metadata is provided from integrations (Ambr or OneLab), many of the fields will be prepopulated. Alternatively, key fields and information about the samples may be edited prior to analysis.
Results Summary
Simple injection-by-injection view of data. This lets the user quickly see if the system is performing well and enables trend analysis as each injection is processed.

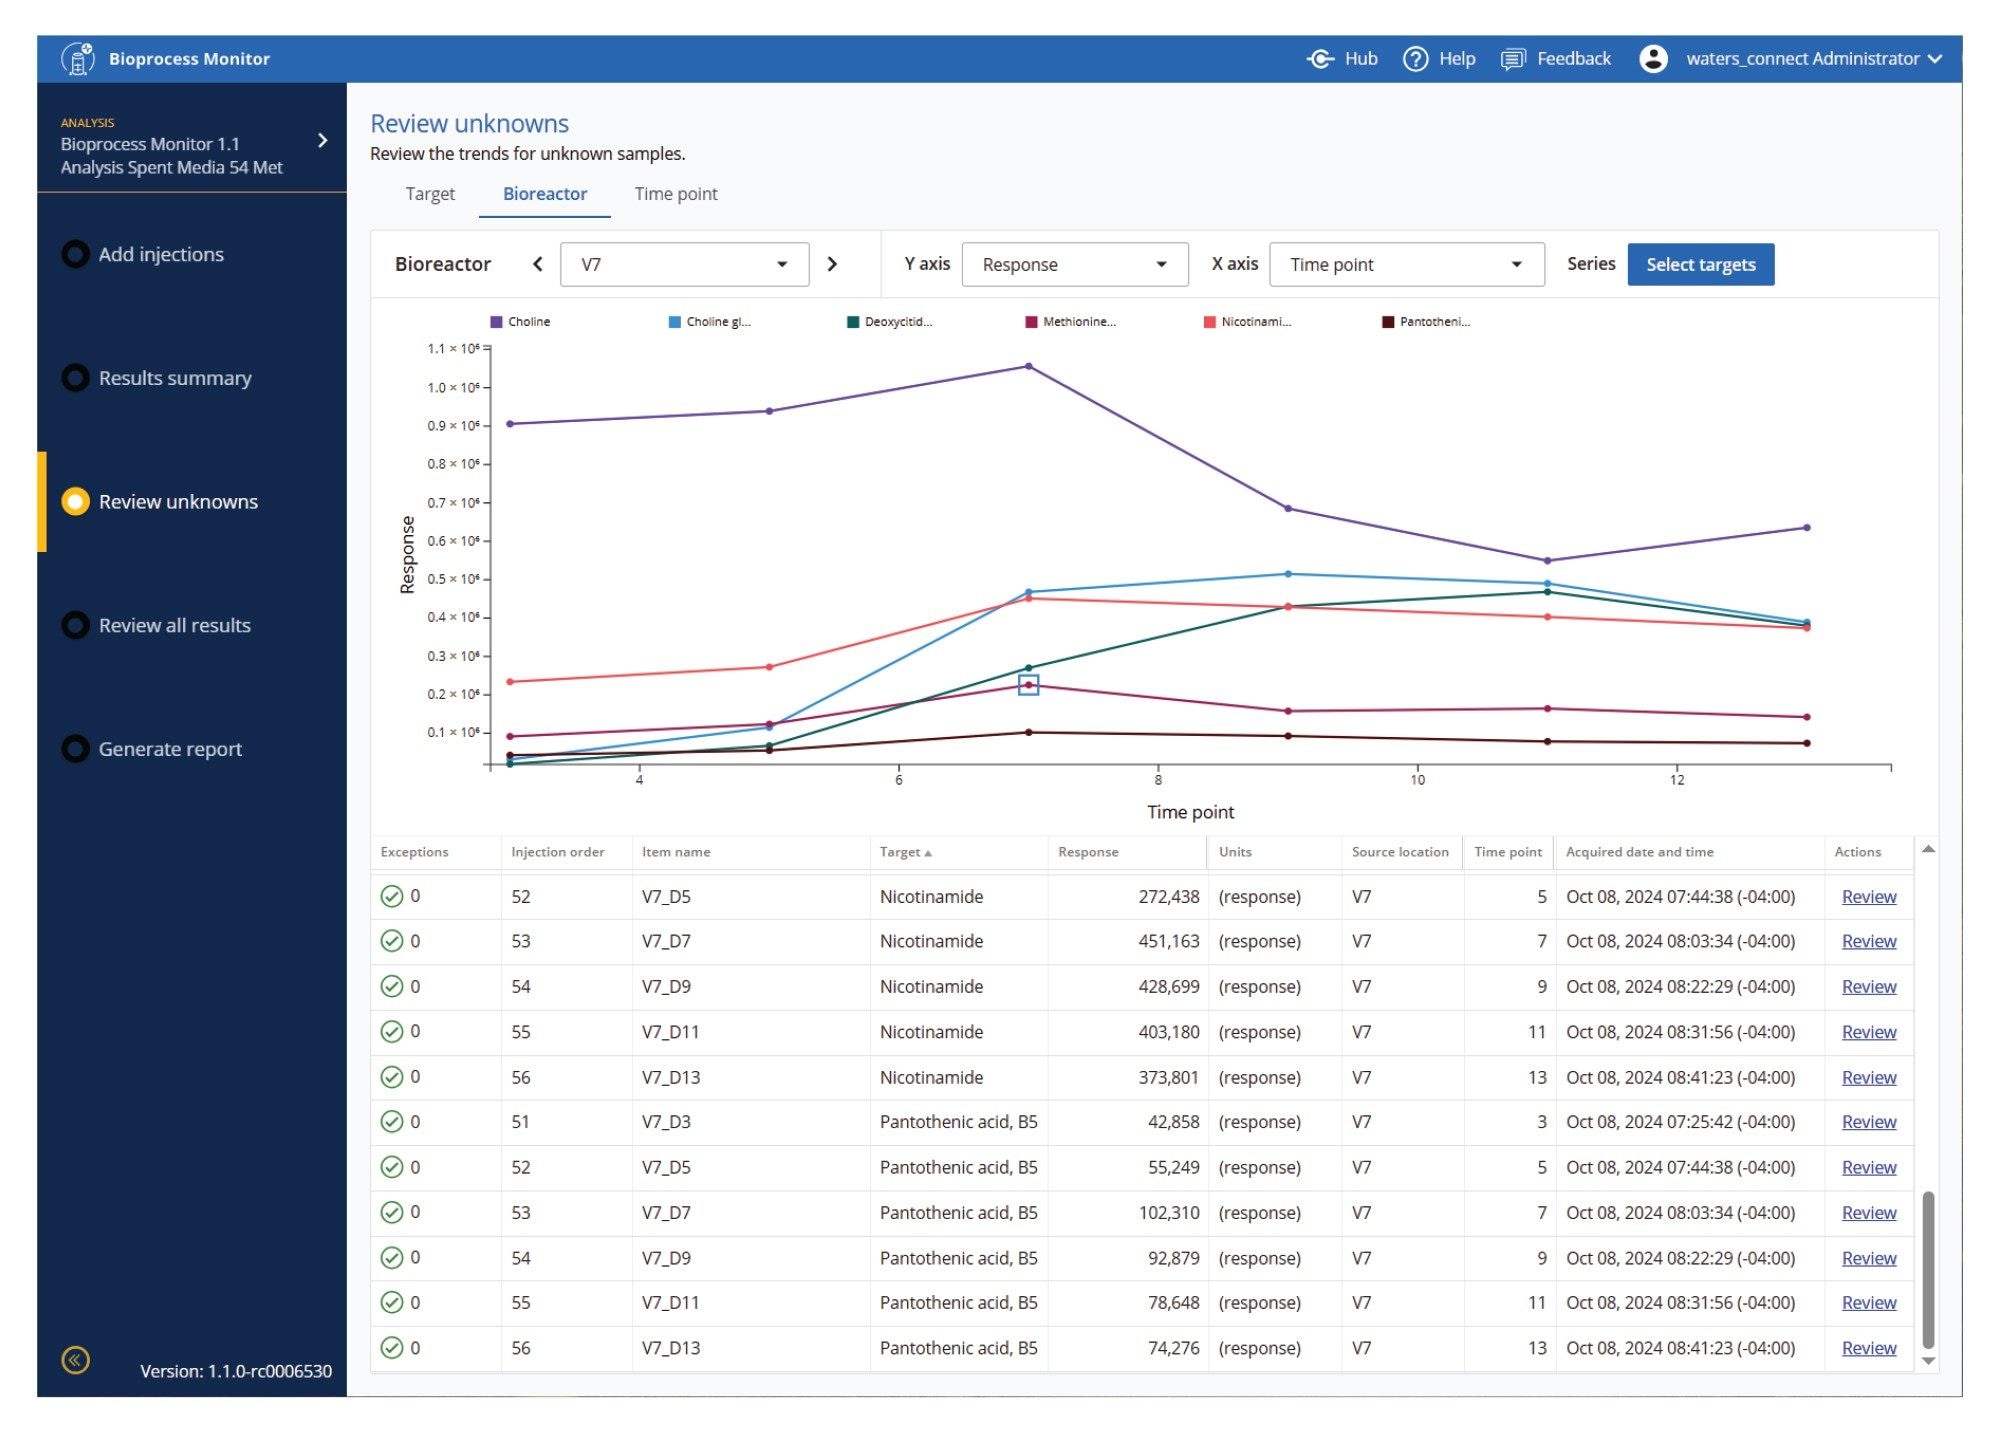
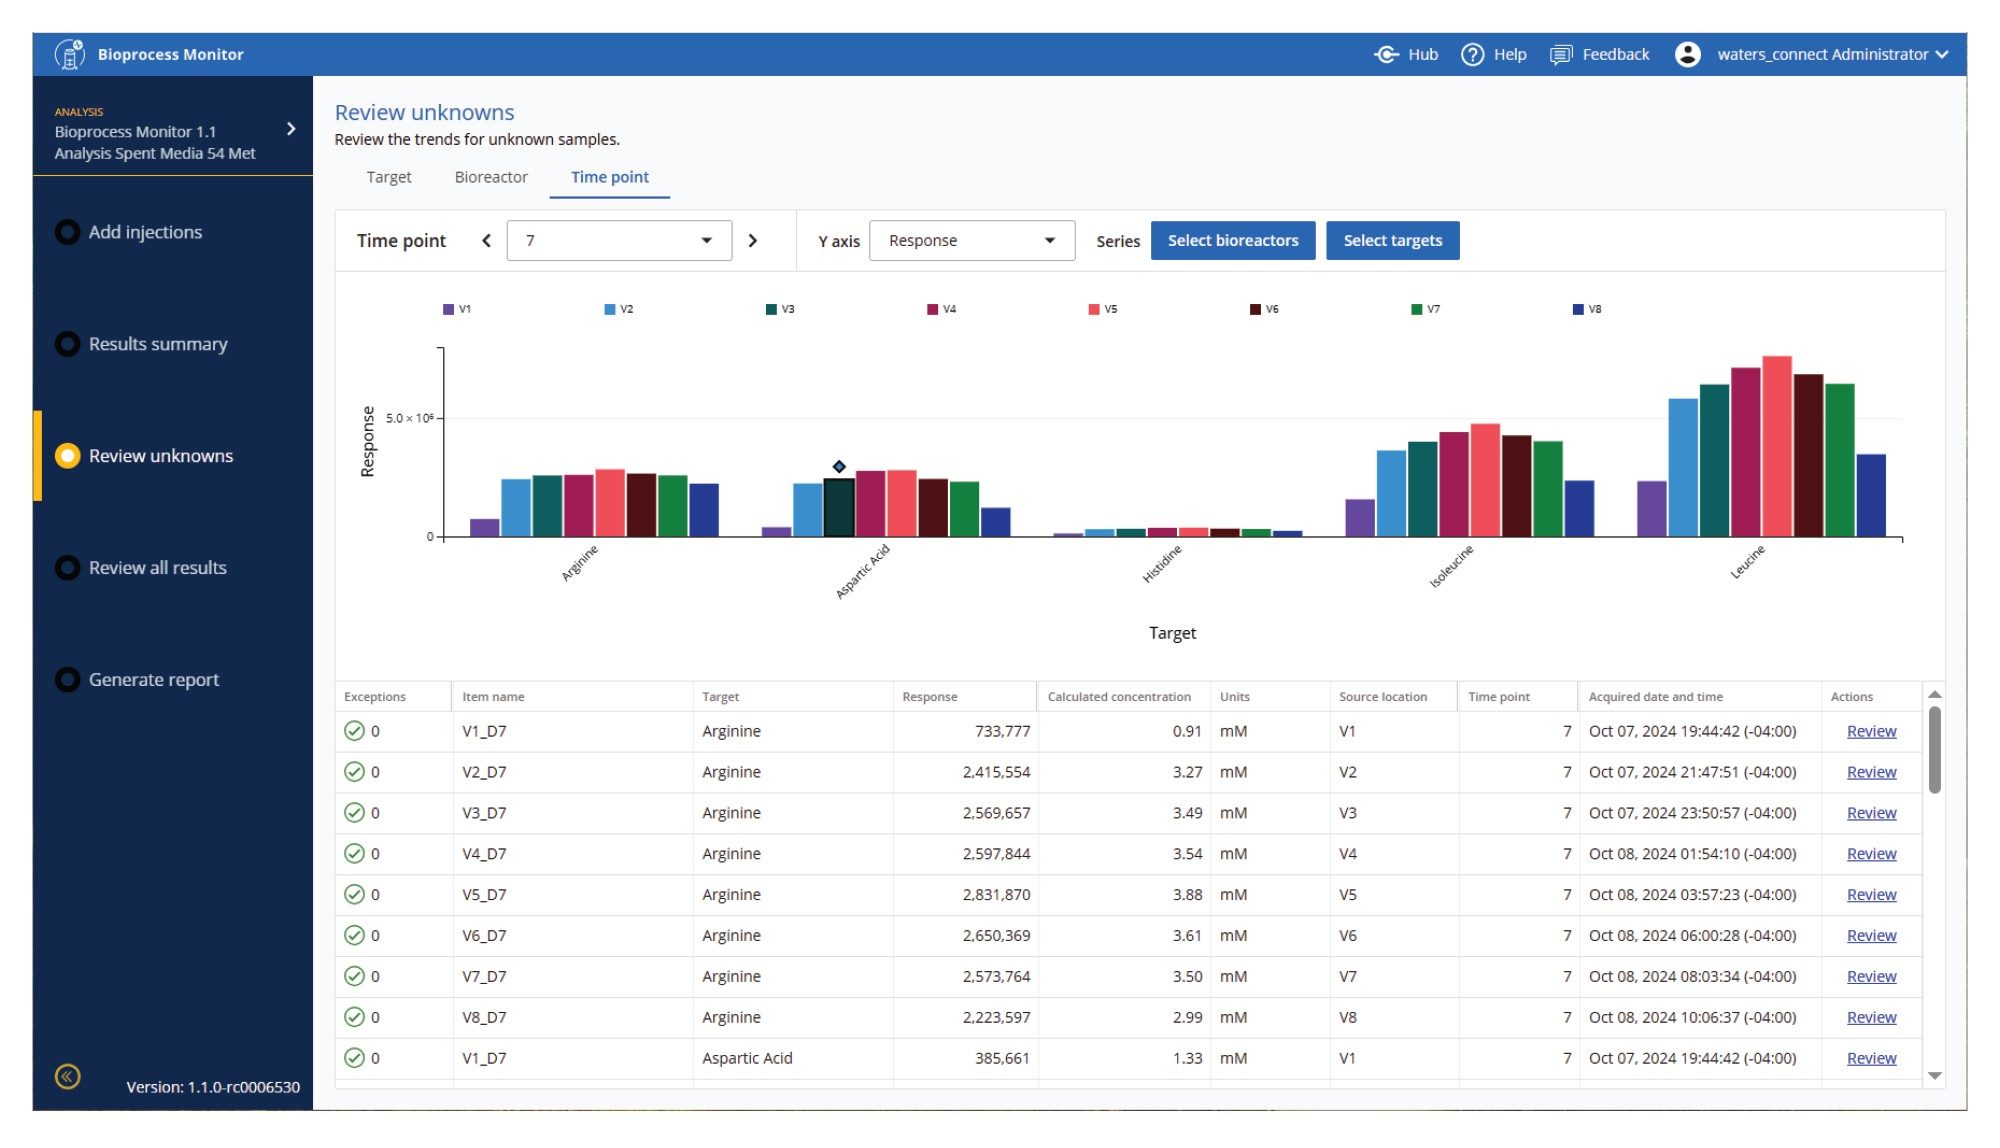
Review Unknowns – By Target, Bioreactor, or Time Point
One of the challenges of large amounts of data, especially for high-throughput upstream studies, is how to view large amounts of comparative and time course data. Figures 9-11 show several of the ways data may be visualized to facilitate holistic review of the data. Figure 9 shows isoleucine levels across all 8 bioreactors, with changes in concentration easily observed over time and across DOE factors. Figure 10 shows several metabolites in a single bioreactor over time, enabling views of vitamins or other metabolic pathways which produce similar expected or unexpected patterns. Figure 11 allows users to further drill down to a specific time point, and view multiple targets and multiple bioreactors simultaneously.

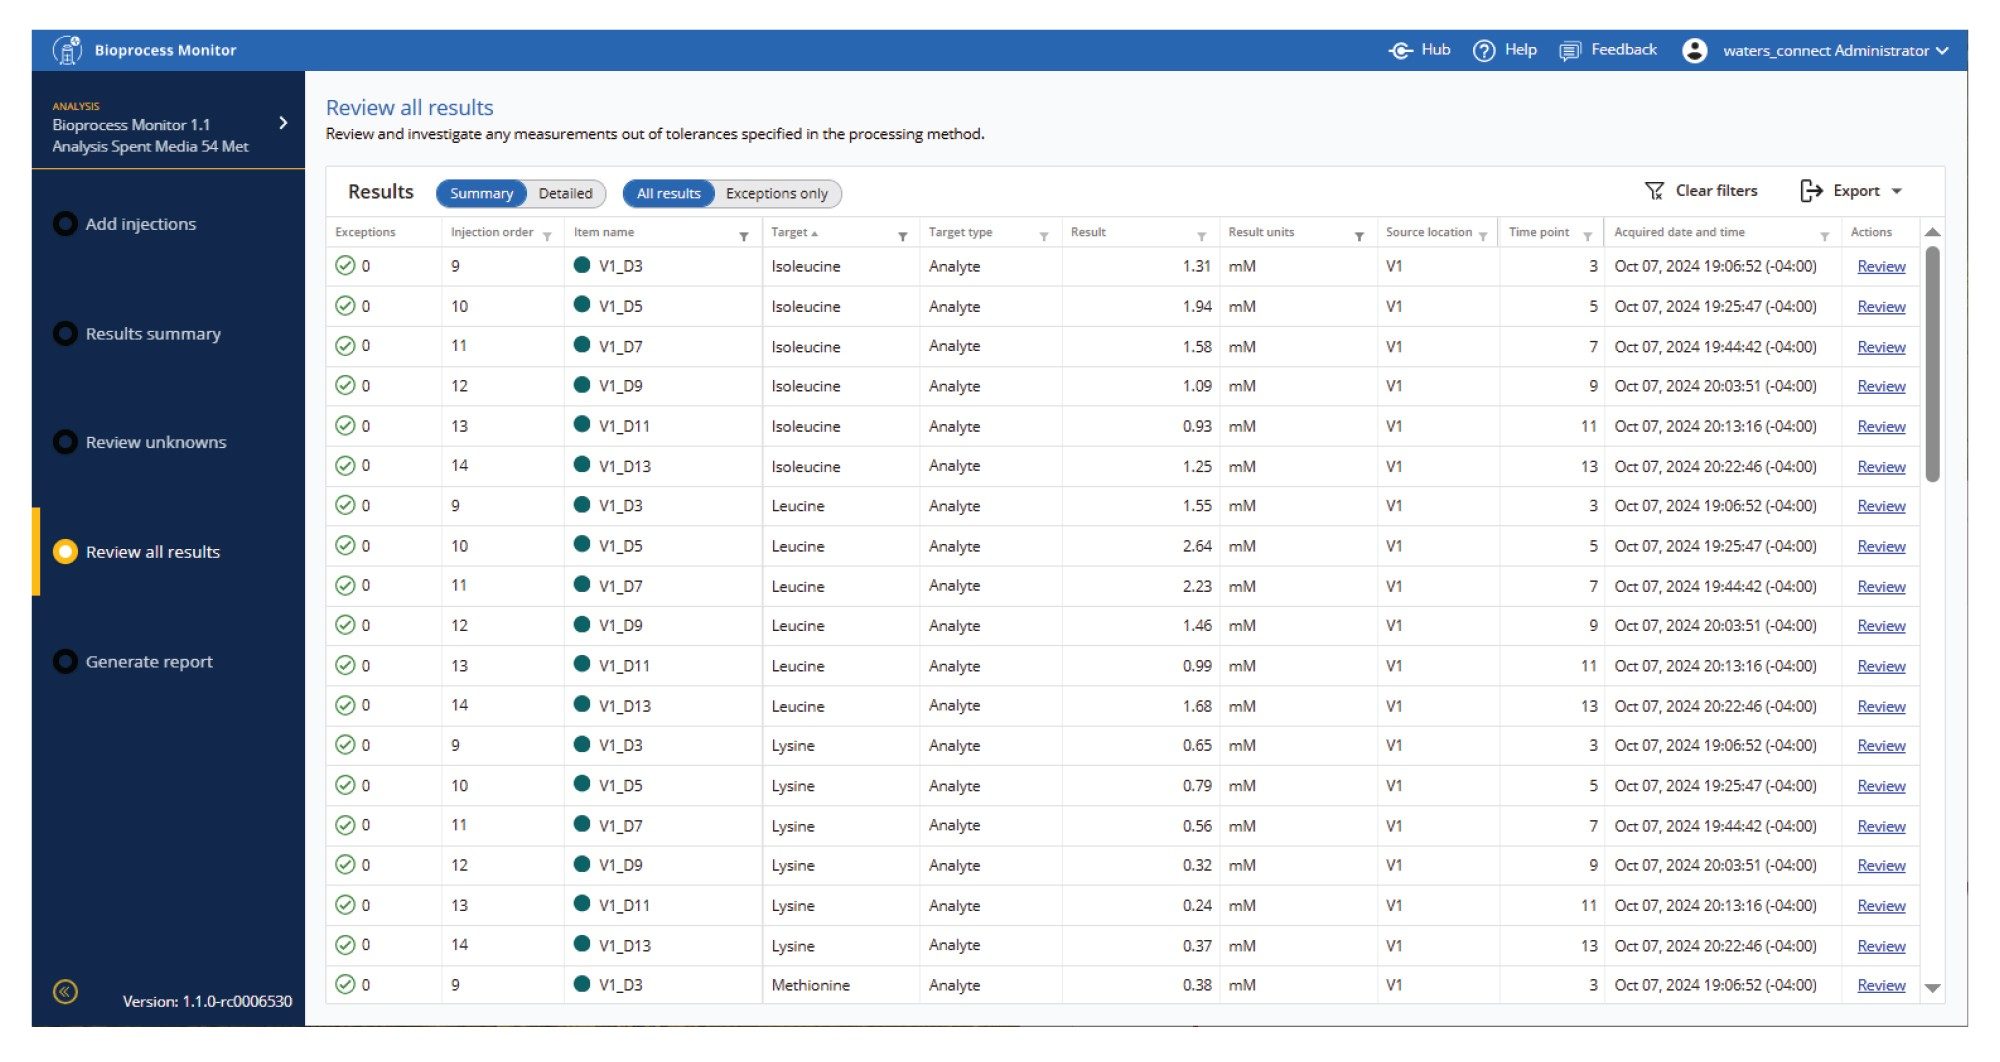
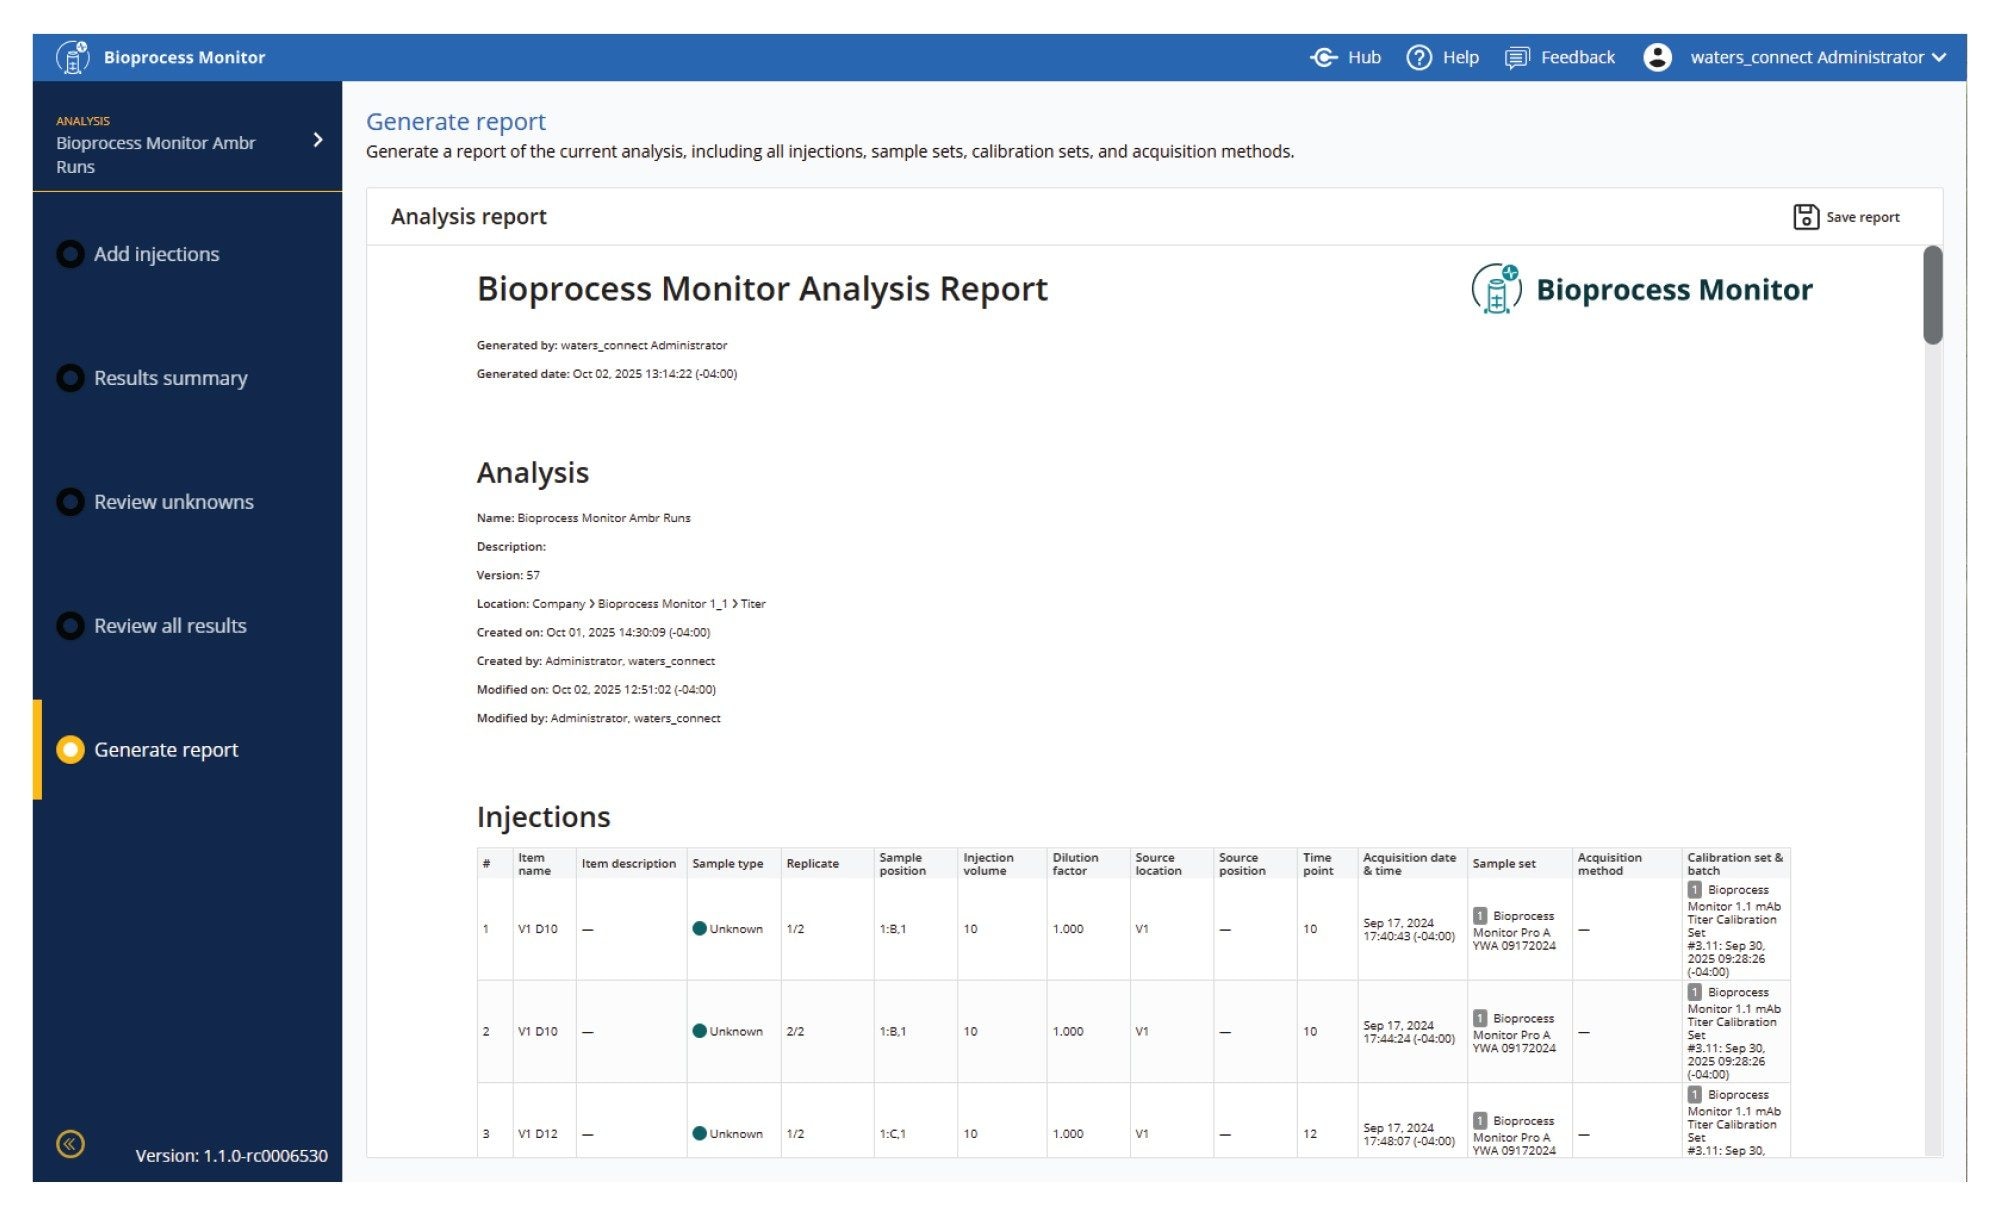
Results for Exporting and Reporting
Results are presented in a simple summary table. Figure 12 shows the quantitative concentration results from the protein A LC titer measurement assay. Results can be both expanded to a detailed view and also filtered down to simpler reports using any of the header filters. This allows specific times, bioreactors, analytes or other variables/descriptors to be viewed separately in detail. Waters ApexTrack Software, combined with automatic RT updating, expertly detects peaks to provide the most comprehensive automatic processing system possible. Comprehensive report flagging and review by exception tools are provided to alert the user when integrations or results may warrant their attention and require manual review, investigation, or reintegration.
Data is also ready for reporting or exporting to other data analytics packages, or for your own reports. Export tables for Sartorius® Ambr 15 and Ambr 250 are provided, as are csv exports for JMP® software.
4. Analytics/Connectivity - Integration with Bioreactor and Data Analytics Software Packages
The Bioprocess Monitor Application has been designed and developed not only to provide simple processing of LC-MS and LC-UV data, but also purposefully built to have the flexibility to integrate with various workflows and software packages.
Automation enhancements include:
- Seamless integration with OneLab and the Andrew Alliance™ Pipetting Robot enables end-to-end sample processing and analysis.
- Compatibility with Ambr 15 and Ambr 250 HT systems, supporting two-way communication: sample lists can be imported into the BioAccord System and Bioprocess Monitor Application, while processed data can be exported back for visualization in Ambr control software.6
- Generation of JMP-ready data, with an available extension from the JMP Marketplace for enhanced analysis.7
- API to support future customization and connectivity with other platforms.
Conclusion
The Bioprocess Monitor Application enables efficient processing of LC-MS and LC-UV data, supporting both UV and MS workflows in a customizable and shareable format. It facilitates rapid method calibration, allowing for robust quantitative or relative analysis of bioreactor samples. Real-time data acquisition and visualization capabilities help users monitor bioreactor performance and detect deviations promptly.
The application is designed to deliver clear, actionable results with minimal review effort. Additionally, Bioprocess Monitor Application integrates seamlessly with automated workflows and third-party software platforms, with flexible export connectivity which further extends its analytical capabilities.
References
- Gabriella Gerzon, Yi Sheng, Marina Kirkitadze. Process Analytical Technologies – Advances in bioprocess integration and future perspectives. Journal of Pharmaceutical and Biomedical Analysis, 207, 2022, https://doi.org/10.1016/j.jpba.2021.114379.
- BioAccord LC-MS System with ACQUITY Premier. Waters Product Brochure, 720007339.
- Wrona et al. LC-MS Analytics in Bioprocessing: Automation-Driven Analysis of Product Quality Attributes and Nutrient Monitoring. Waters application note, 720008487. 2024.
- Yun Alelyunas, Josh Gray, Mark Wrona, Patrick Boyce. Introducing a Rapid Throughput LC-MS Method for Cell Culture Media Nutrient and Metabolite Analysis Supporting Upstream Bioprocessing. Waters application note. 720008170. 2024.
- Stephan M. Koza, Steve Shiner, Matthew A. Lauber. Lowering Quantitation Limits for mAb Titer Measurements Using Small Volume 3.5 µm Particle-Size Protein-A Affinity Columns. Waters application note. 720008775., 2025.
- Yun Alelyunas, Charles Prochaska, Clint Kukla, Caitlin Hanna, Mark Wrona. Monitoring Intact Glycoprofiles and Spent Media Metabolites in Samples from Sartorius Ambr 250 High Throughput Bioreactor System to Support Upstream Process Development. Waters application note. 720008042. 2023.
- Bioprocess Monitor JMP Add-in - https://marketplace.jmp.com/appdetails/Bioprocess+Monitor
720009087, November 2025