Quantification of Semaglutide in Human Plasma Using a Benchtop Multi-reflecting Time-of-Flight Mass Spectrometer
Hania Khoury-Hollins, Jonathan Fox, Jayne Kirk, Richard Lock
Waters Corporation, United Kingdom
Published on December 22, 2025
Abstract
Glucagon-like peptide-1 receptor agonists (GLP-1RA) are an important class of drugs widely used for the treatment of diabetes and obesity.1 In the last decade, the number of approved GLP-1RA therapies has increased significantly, driving a growing need for robust analytical methods to ensure drug safety through accurate quantification and impurity identification. To meet these demands, high-throughput quantitative approaches are essential for supporting rapid development and quality control.
This application note describes a ballistic analytical method with a total runtime of less than 3 minutes for the quantitative analysis of semaglutide using the Xevo™ MRT Mass Spectrometer. The method demonstrates excellent sensitivity, selectivity, and linearity. The short total runtime per injection increases the productivity by 4-folds and halves the amount of solvent needed compared to a classical 10-minute gradient.2 Furthermore, sample integrity in solvent at 4 °C remained stable for at least 96 hours, confirming the reliability of this approach for routine high-throughput applications.
Benefits
- Confidence in detection of trace levels with exceptional sensitivity and wide dynamic range: Linearity from 0.05 ng/mL to 500 ng/mL (12 amol/µL – 121.5 fmol/µL, 0.5 to 5000 pg on column) and dynamic range spanning over 4 decades.
- Reliable results, less down time: Selective method with negligible carry-over.
- Increased productivity and reduced operating costs per sample: High-throughput workflow that boosts laboratory productivity by up to 4 times while cutting organic solvent consumption by 50%.
Introduction
Glucagon-like peptide-1 (GLP-1) is an endogenous peptide hormone that plays a critical role in regulating blood glucose, lipid metabolism, appetite, and other key physiological processes.1 While GLP-1 serves an essential physiological function, its circulatory half-life is extremely short—only 1 to 2 minutes3, 4 which makes synthetic GLP-1 analogs an attractive therapeutic option for glycemic control. To overcome the short half-life limitation, synthetic peptides mimicking GLP-1 activity have been developed using different strategies aimed at improving stability and half-life, such as amino acid substitution, PEGylation, lipid conjugation, and N- or C-terminal modifications.5, 6, 7 Exenatide became the first GLP1-RA approved for type 2 diabetes treatment in 2005. Since then, more than a dozen compounds have been introduced for managing diabetes and obesity, with several additional candidates currently in development.5 These synthetic GLP-1RA are now central to the treatment of type 2 diabetes and obesity, making their characterization and analysis crucial to ensure their safety and efficacy.
Xevo MRT Mass Spectrometer delivers high mass accuracy, sensitivity, and resolution over a broad m/z range at fast acquisition rates. This capability enables data acquisition with faster chromatographic methods without compromising instrument performance or data quality. Here, a high-throughput liquid chromatography high-resolution mass spectrometry method is developed for the quantification of semaglutide in human plasma. The method includes a rapid gradient and stepped wash phases to reduce the carryover, within a 2.5-minute total runtime. Compared to the conventional 10 minutes method,2 this method improves the throughput by 4-folds and reduces the solvent and energy consumption, halving the instrument's energy score.8
Experimental
Sample Preparation
Semaglutide and liraglutide (p/n: T19850L-1MG and SML3925-25MG, respectively, purchased from Merck). A stock solution of semaglutide at 1 mg/mL methanol containing 5% formic acid was prepared and kept at -20 °C. A working solution of 50 µg/mL in methanol containing 5% formic acid was prepared and subsequently used to generate working solutions ranging from 0.5 ng/mL to 5000 ng/mL through serial dilutions. Due to the unavailability of isotopically labeled semaglutide, liraglutide was selected as the internal standard. A stock solution of liraglutide (1 mg/mL) was prepared by dissolving the compound in dimethyl sulfoxide (DMSO).
For matrix-based quantification studies, human plasma was employed. Protein precipitation was performed using a 1:3 plasma-to-solvent ratio with a mixture of acetonitrile and methanol (1:1, v/v). The mixture was vortexed for 20 seconds, then centrifuged at 14,000 rpm for 15 minutes. To the resulting supernatant, formic acid was added to a final 5% final concentration.
For solvent-based standards, methanol:water containing 0.4% formic acid was used, while the acidified plasma extract served as the matrix for matrix-based standards. Liraglutide was spiked to either solvent or plasma extract to make a concentration 0.5 µg/mL.
Calibration standards in either solvent or plasma matrix were prepared by combining 180 µL of the liraglutide (in solvent or plasma) with 20 µL of semaglutide working solutions. The resulting calibration standards covered concentrations from 0.050 ng/mL to 500 ng/mL, with liraglutide 0.45 µg/mL.
LC-MS Conditions
|
LC system: |
Waters ACQUITY™ Premier System |
|
Vials: |
QuanRecovery™ with MaxPeak™ HPS vial (p/n: 186009186) |
|
Analytical column: |
ACQUITY Premier Peptide CSH C18 Column, 130 Å, 1.7 µm, 2.1 x 50 mm (p/n 186009487) |
|
Column temperature: |
65 °C |
|
Sample temperature: |
6 °C |
|
Injection volume: |
2 µL |
|
Flow rate: |
0.8 mL/min |
|
Mobile phase A: |
water +0.1% HCOOH |
|
Mobile phase B: |
Acetonitrile + 0.1% HCOOH |
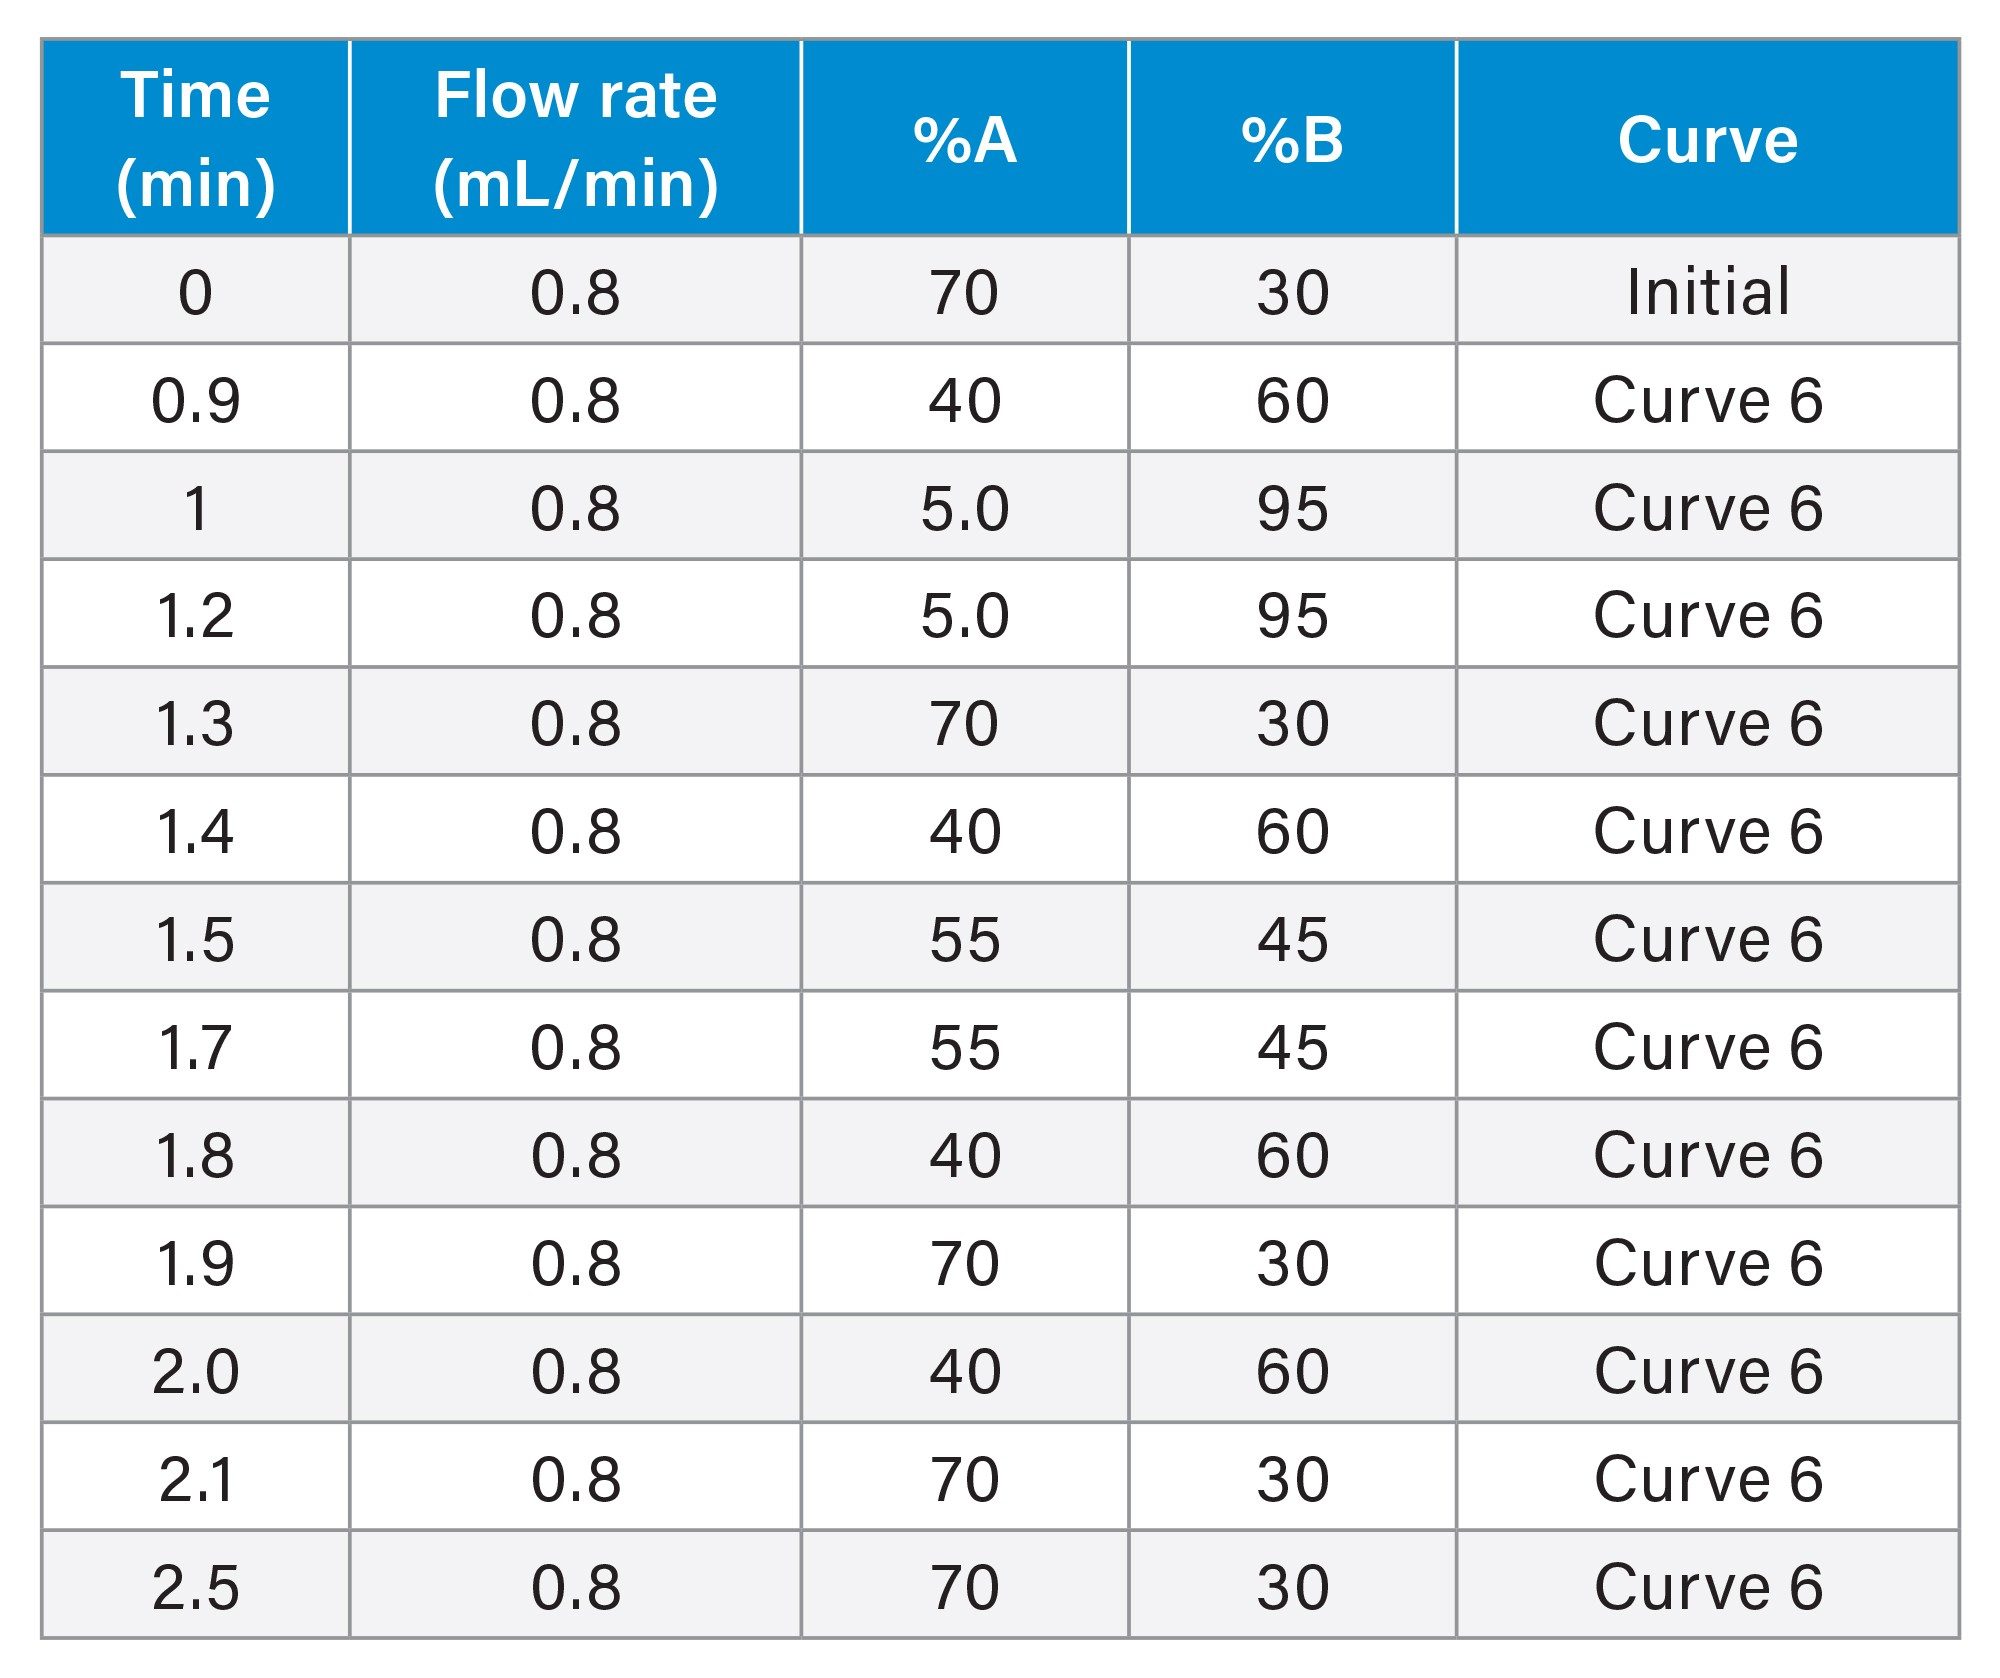
LC Gradient Table
MS Conditions
|
MS system: |
Xevo MRT Mass Spectrometry |
|
Ionization mode: |
ESI+ |
|
Mass range: |
m/z 50–1200 |
|
Acquisition rate: |
20 Hz |
|
Lock mass: |
Single point lock mass using Leucine enkephalin (m/z 556.27658) |
|
Acquisition mode: |
MS full scan |
|
Capillary voltage: |
0.9 kV |
|
Cone voltage: |
40 V |
|
Source temperature: |
120 °C |
|
Desolvation temperature: |
550 °C |
|
Cone gas: |
50 L/h |
|
Desolvation gas: |
1000 L/h |
Software Tools
Data acquisition and processing were performed using the waters_connect™ Software Platform and UNIFI Application.
Results and Discussion
Method Sensitivity, Selectivity and Dynamic Range
The sensitivity and dynamic range of the Xevo MRT Mass Spectrometer were evaluated for the quantification of semaglutide in both solvent and human plasma. Calibration standards were prepared as described in the method section, with liraglutide as an internal standard. Semaglutide was quantified by monitoring the ion at m/z 1029.0357, corresponding to the [M+4H]⁴⁺ species, and normalizing its response against the ion at m/z 938.2428 ([M+4H]⁴⁺) for liraglutide. Using this chromatographic method, semaglutide eluted at 0.6 minutes (Figure 1 bottom) and liraglutide at 0.7 minutes (data not shown). Extracted ion chromatograms (XIC) for m/z 1029.0357 are shown for the solvent blank (Figure 1A, top), plasma (Figure 1B, top), 0.05 ng/mL of semaglutide in solvent (Figure 1A, bottom), and plasma extracts spiked with 5 ng/mL of semaglutide (Figure 1B, bottom). The signal-to-noise ratios (S/N), calculated using the peak-to-peak method, are approximately 4.9 for semaglutide in solvent and 6.6 for spiked plasma extracts.
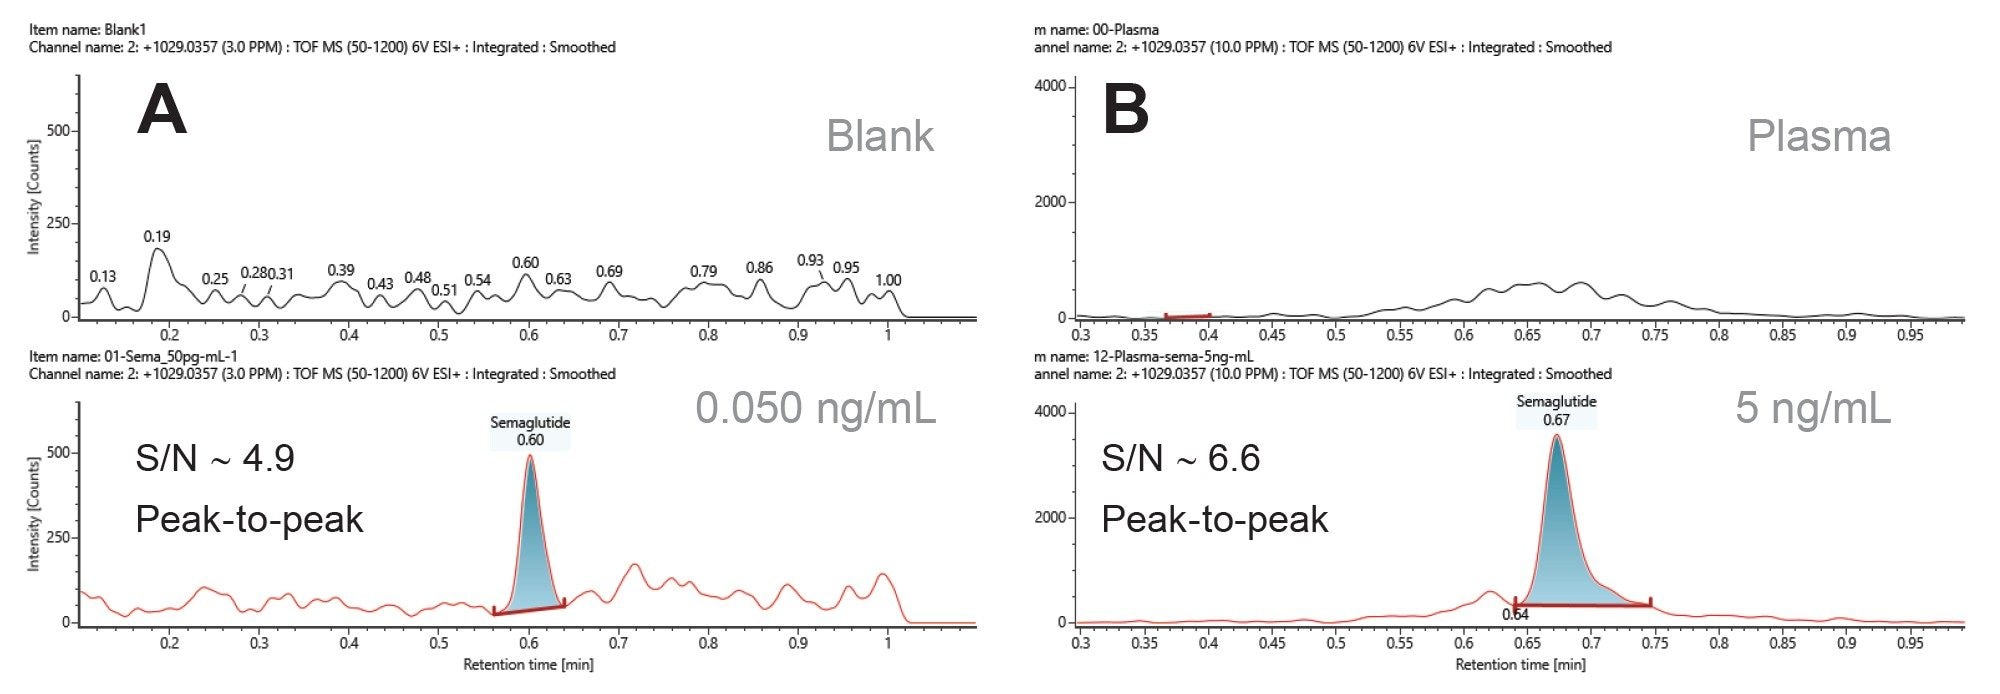
Method selectivity was evaluated by comparing XIC of the ion at m/z 1029.0357 in solvent and plasma extracts against their respective limits of detection (LOD) in both solvent and matrix. As shown in Figure 1, no (or negligible) interferences were observed from either the solvent used for standard preparation or the plasma extracts. Therefore, the method used for the quantification of semaglutide using its [M+4H]⁴⁺charge state is selective. Furthermore, linearity was assessed in both solvent and plasma extracts. The corrected response of the [M+4H]⁴⁺ ion is shown as a function of concentration (Figure 2).
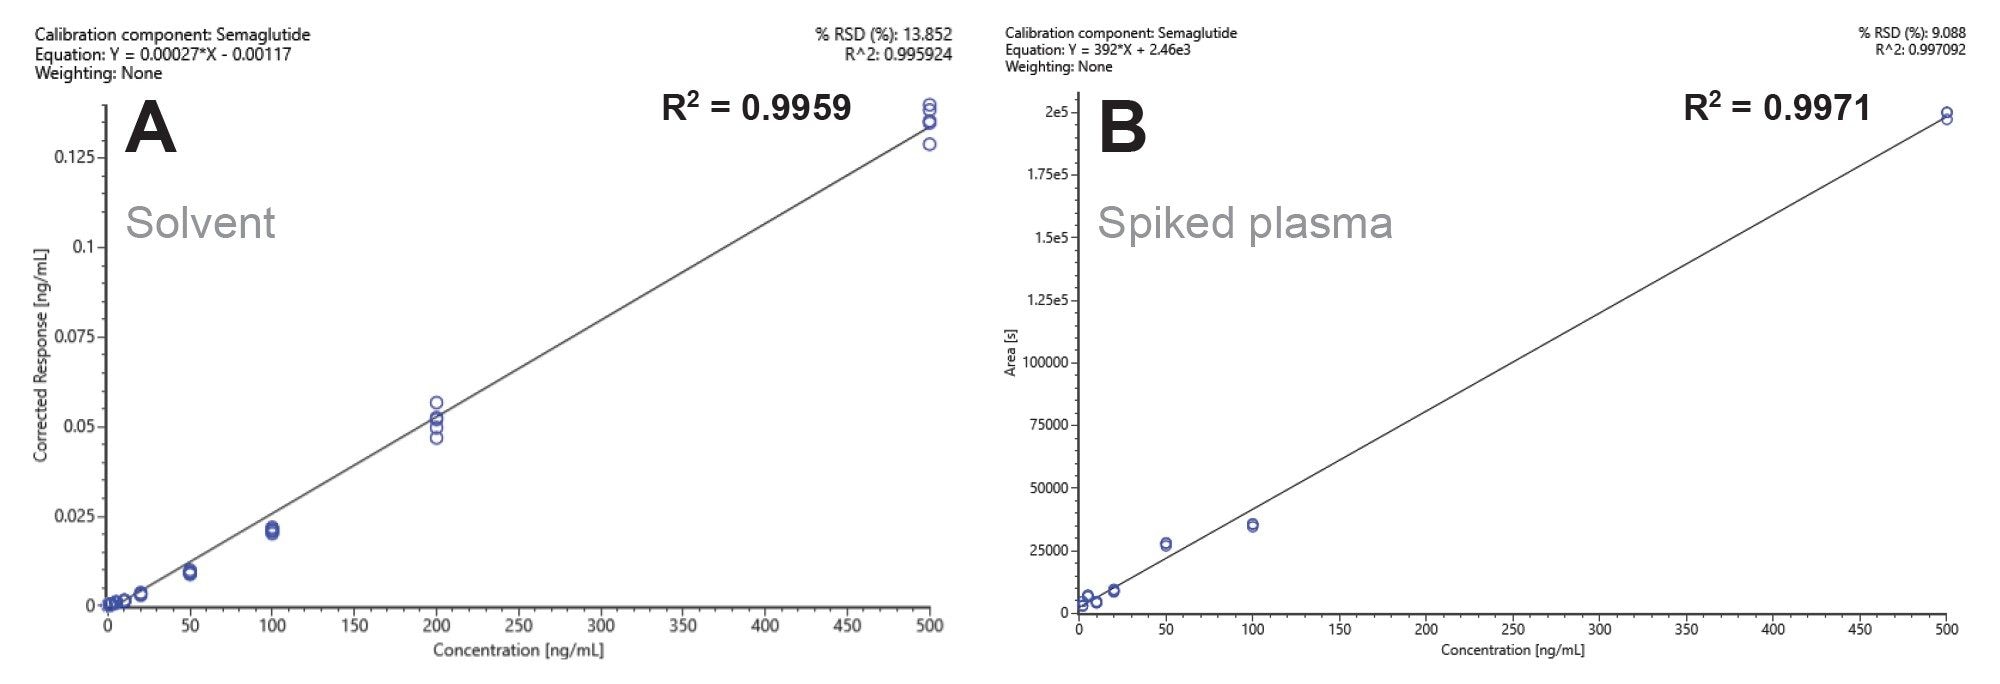
Semaglutide demonstrates a linear response across the range of 0.05 ng/mL to 500 ng/mL, covering 4 orders of magnitude. Matrix effects from human plasma extracts increase the LOD compared to solvent. For this analysis, 2 µL of samples were injected onto the column with the detection limits of semaglutide at 0.05 ng/mL in solvent and 5 ng/mL in plasma extracts, corresponding to 12 amol/µL and 1.2 fmol/µL, or 0.1 pg and 10 pg on-column, respectively. Overall, the instrument maintains linearity over 4 orders of magnitude (Figure 2A). The linearity of semaglutide was demonstrated over 4 orders of magnitude with a minimum of 6 points on the calibration curves and a % deviation for the triplicate injections of < 10% and R2 value of >0.99. In addition, the LLOD can be further improved by increasing the injection volume from 2 µL to 10 µL.
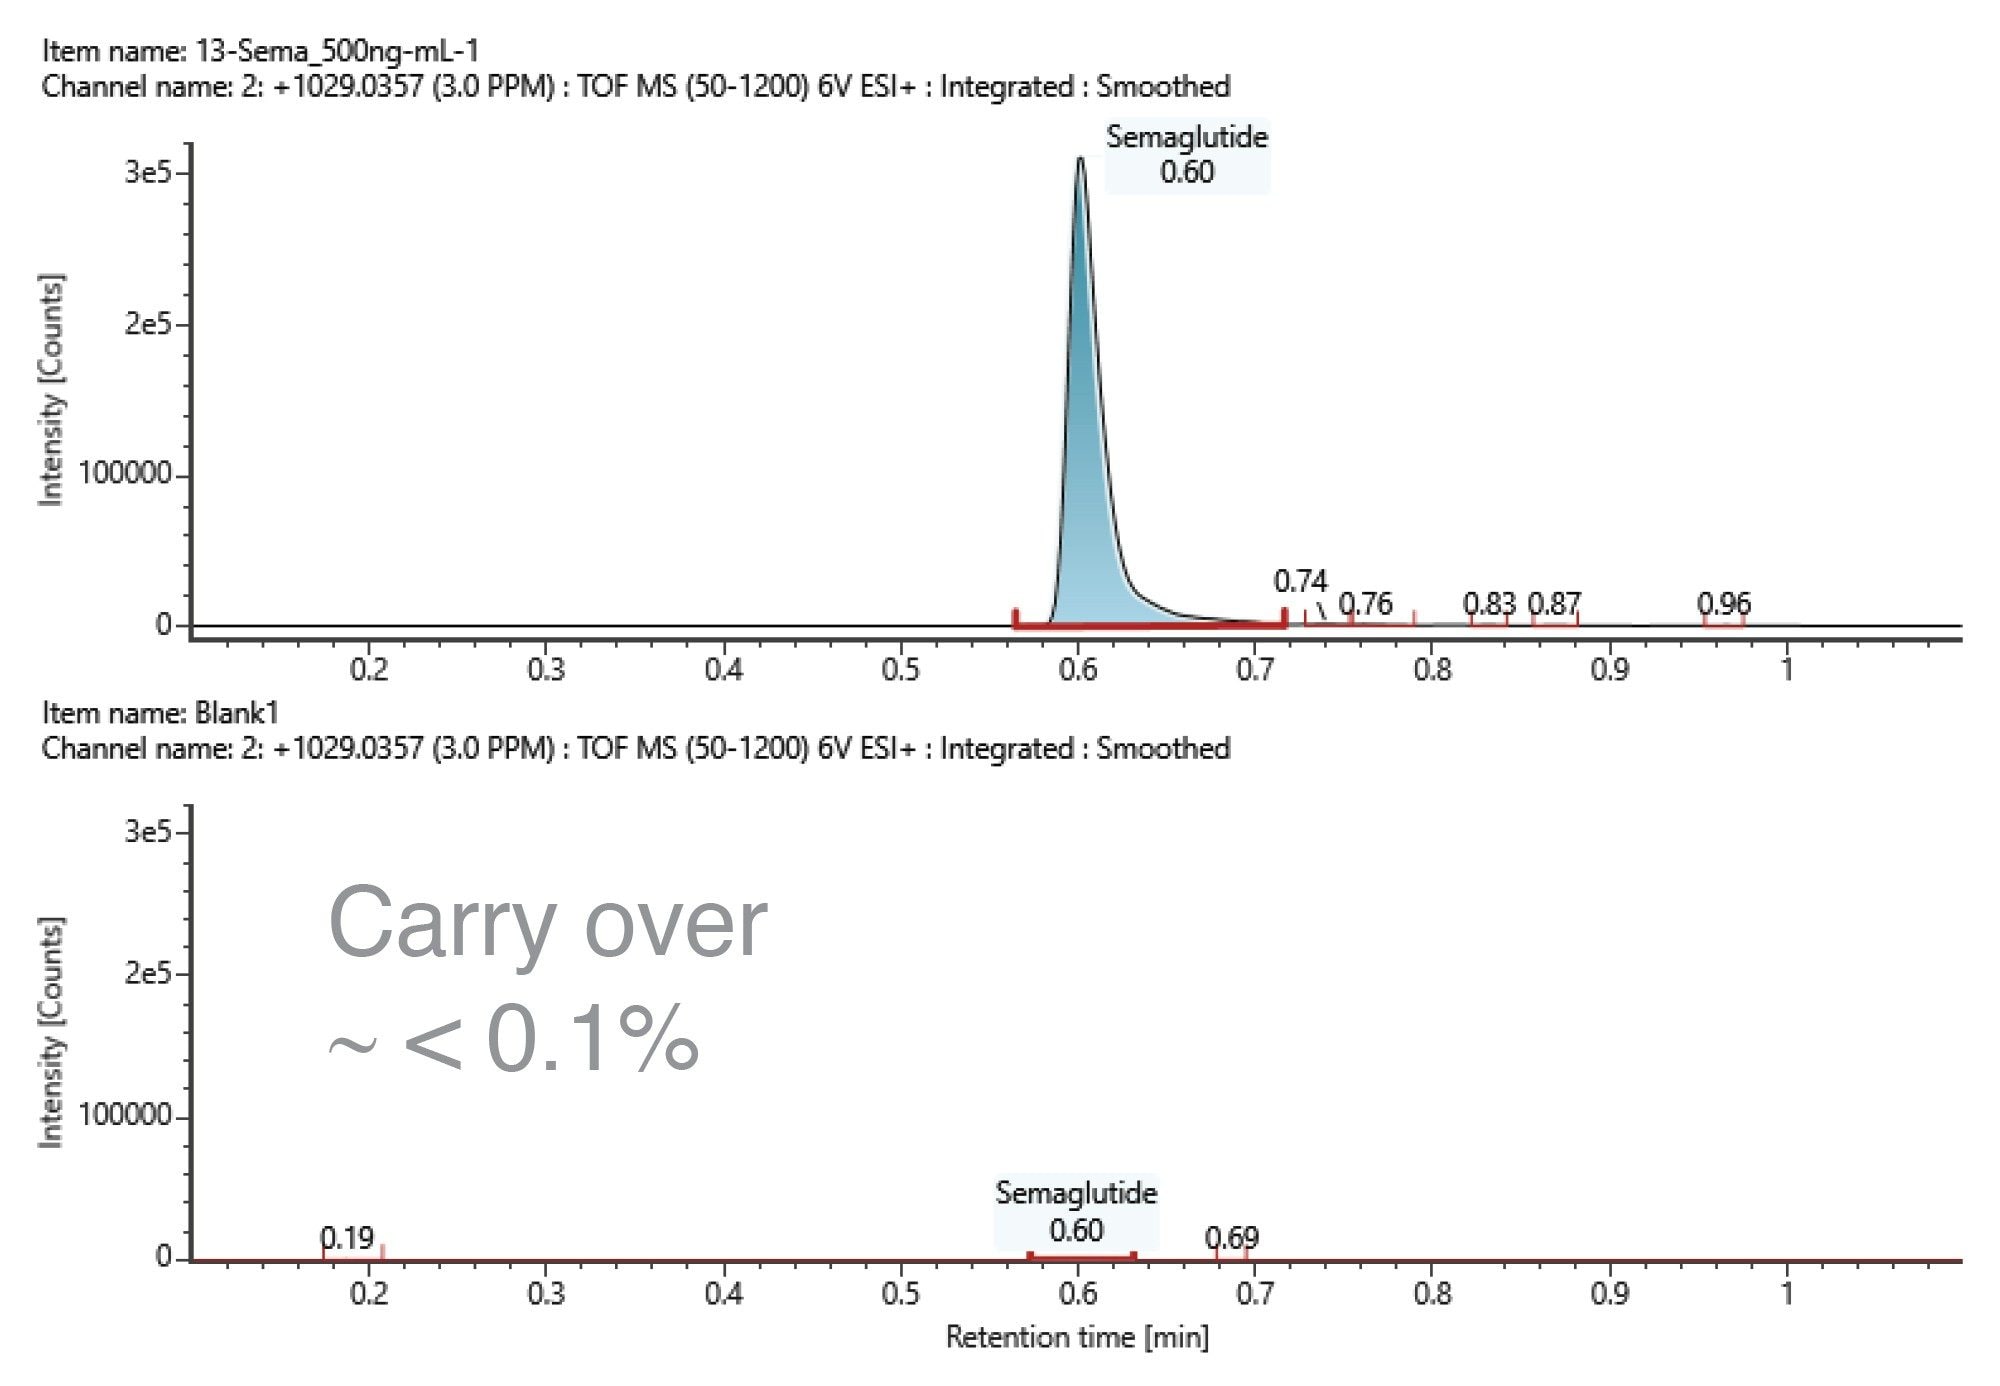
Given the use of a short gradient, method carryover was evaluated by injecting a solvent blank immediately after the highest concentration standard (500 ng/mL). The blank injection was processed using the same processing method, and carryover was estimated as the ratio of the residual semaglutide response to the response of the 500 ng/mL standard (Figure 3). The response of semaglutide in the blank injection and the 500 ng/mL standard were 273 and 401979, with S/N 1.8 and 3056.2, respectively. From the response observed in the solvent blank injection,and thus the estimated carryover of the analytical method, was less than 0.1%.
Method stability was assessed using calibration standards prepared in methanol:water containing 0.4% formic acid. These standards were analyzed over a 96-hour period following preparation, and the responses for semaglutide and liraglutide were monitored across multiple days. At the end of the sequence, the instrument was kept in standby mode, and the samples were kept in the sample manager at 4 °C during the whole assay.
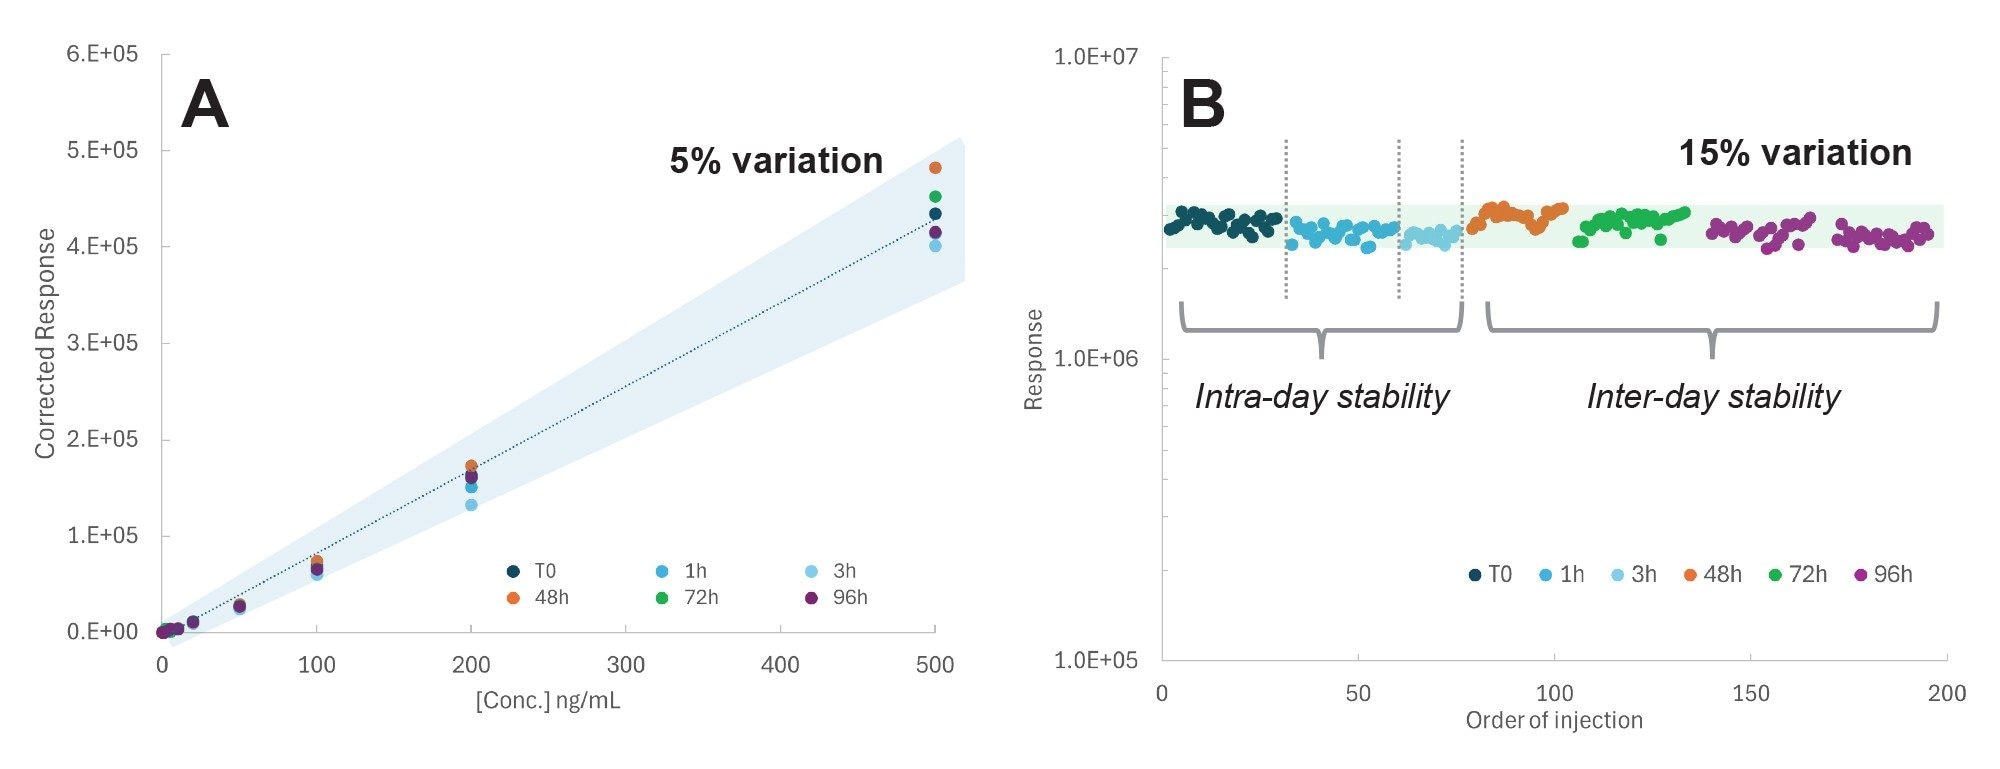
Calibration curves for semaglutide, using liraglutide as the internal standard, were evaluated in solvent (Figure 4A), along with liraglutide response over 96 hours post sample preparation (Figure 4B). Semaglutide response at all the levels of concentrations remained within 5% variation up to 96 hours after preparation, while the liraglutide response was stable over the same period, staying within 15%.
Conclusion
The developed analytical method on the Xevo MRT Mass Spectrometer demonstrates the instrument’s excellent performance, with sensitivity in the order of 0.05 ng/mL (12 amol/µL) and linearity maintained across 4 orders of magnitude. The method is highly selective for semaglutide quantification in solvents and human plasma extracts, exhibiting less than 0.1% carry-over, and ensuring reliable quantification. The system's performance at high acquisition rates allowed for rapid chromatography, reducing the total run time by 75%. This halved the amount of organic solvents needed, and reducing the cost per sample injected and increasing overall lab productivity. Furthermore, sample stability was confirmed for at least 96 hours post-preparation at 4 °C, supporting robust and consistent analysis over extended periods. This method is ideal for routine quantitative work, and a similar approach can be used for the analysis of different types of GLP-1RA.
The Xevo MRT Mass Spectrometer delivers a powerful characterization platform through its combination of high resolution, rapid scan speeds, and exceptional sensitivity. It enables simultaneous qualitative and quantitative analysis, integrating structural elucidation with routine quantification in a single workflow, to accelerate decision-making and minimize instrument downtime. This versatility makes Xevo MRT Mass Spectrometer ideal for both discovery and regulated environments, supporting advanced analytical strategies without sacrificing productivity.
References
- Zheng, Z., Zong, Y., Ma, Y. et al. Glucagon-like peptide-1 receptor: mechanisms and advances in therapy. Sig Transduct Target Ther 9, 234 (2024).
- Ferries S. Comprehensive Workflow for the Quantification of Peptides and Proteins in Plasma: Semaglutide a Case Study. Waters Application note 720008600 (2024).
- Campbell, J. E. & Drucker, D. J. Pharmacology, physiology, and mechanisms of incretin hormone action. Cell Metab. 17, 819–837 (2013).
- Deacon, C. F. Circulation and degradation of GIP and GLP-1. Horm. Metab. Res 36, 761–765, (2004).
- Gong B., Yao Z., Zhou C., Wang W., Sun L. and Han J. Glucagon-like peptide-1 analogs: Miracle drugs are blooming? Europ. J. Med. Chem. 256:116342, (2024).
- Yu M., Benjamin M., Srinivasan S., Morin E., Shishatskaya E., Schwendeman S., Schwendeman A. Battle of GLP-1 delivery technologies Adv Drug Deliv Rev. 130: 113–130, (2018).
- Tan Q., Akindehin S., Orsso C., Waldner R., DiMarchi R., Müller T. and Haqq A. Recent Advances in Incretin-Based Pharmacotherapies for the Treatment of Obesity and Diabetes. Front. Endocrinol.,13:83841, (2022).
- Hicks M, Farrell W, Aurigemma C, Lehmann L, Weisel L, Nadeau K, Lee H, Moraff C, Wong M, Huang Y and Ferguson P. Making the move towards modernized greener separations: introduction of the analytical method greenness score (AMGS) calculator Green Chem. 21: 1816 (2019). https://www.acsgcipr.org/amgs/
720009191, December 2025