Leveraging Analytical Quality by Design Principles for Efficient Development of a Targeted Assay Method for Routine Monitoring of Mannose-5 Glycans Using Fluorescence Detection
Pawel Bigos, Robert E. Birdsall, Karen Nyholm
Waters Corporation, United States
Published on May 05, 2025
Abstract
Utilizing Analytical Quality-by-Design (AQbD) principles to modify established platform methods can significantly enhance method development efficiency. Platform methods are typically well-established, validated, and widely accepted, offering a reliable starting point for further development and optimization based on specific needs. The universal N-glycan hydrophilic interaction liquid chromatography (HILIC) method, which serves as the basis for the glucose unit (GU) library within UNIFI™, is a foundational platform method that provides a standardized and validated approach for glycan analysis.1 However, as a broad and generalized method, it applies to a wide range of N-glycans and may not be optimized for specific glycans of interest. By leveraging AQbD principles, critical method parameters (CMPs) were identified and optimized, such as instrumentation, column, and mobile phase conditions to tailor the platform method into a targeted assay for Mannose-5 glycans (Man-5) using fluorescence detection (FLR).
In this application note, Design of Experiments (DoE) and advanced statistical tools were used for method development, leading to the establishment of a robust Method Operable Design Region (MODR). This approach ensured the methods reliability, robustness, and compliance with regulatory requirements and the optimized method demonstrated high resolution, specificity, and consistency, making it suitable for routine analytical applications for Man-5 monitoring. Furthermore, the integration of AQbD principles facilitated a systematic and risk-based approach to method development, enhancing the overall quality and performance of the analytical procedure.
Benefits
- The ACQUITY™ QDa™ II Mass Detector complements method development workflows by easily monitoring coeluting peaks over various chromatographic conditions
- Integration of Fusion QbD® Software with Empower™ 3 Chromatography Data System (CDS) facilitates seamless data exchange by efficiently transferring method conditions and exporting processed results
- AQbD provides a comprehensive understanding of the relationship between method parameters and analytical performance
Introduction
AQbD is a systematic, scientific, and proactive approach to method development that begins with predefined objectives. In the context of chromatographic methods, AQbD principles provide a structured framework that enhances the efficiency, robustness, and reliability of analytical methods. Traditionally, methods were developed using a one-factor-at-a-time (OFAT) approach where one variable is changed sequentially until a suitable method is produced. This type of development can create adequate methods but provides a limited understanding of method capabilities and method robustness. According to the ICH Q14 guidelines, the traditional approach remains an acceptable method for developing robust analytical procedures that are fit for their intended purpose. However, the enhanced approach integrates elements of AQbD and risk management into the development process, offering a more comprehensive understanding of the interactions between variables and the collective impact on method performance.2 This enhanced approach to method development uses statistical tools, including DoE, which is a structured approach for planning, analyzing, and interpreting experiments to study the relationship between factors and responses, and robustness simulators, for the identification of optimal method conditions. These tools enable the identification of critical method parameters and their interactions, allowing for the optimization of method conditions to achieve desired performance characteristics.
The primary objective of this application note is to develop a targeted Man-5 assay utilizing a software-assisted AQbD approach. Typically, glycans are analyzed using a HILIC method, however, closely related glycan structures can coelute, making it difficult to achieve high-resolution separations. Utilizing AQbD principles, CMPs such as buffer concentration, column temperature, and gradient slope were systematically evaluated and optimized. The use of DoE allowed for the exploration of a wide range of these conditions, leading to the establishment of a MODR. This approach ensured that the method conditions were fine-tuned to achieve optimal separation of Man-5 from other glycans.
Experimental
RapiFluor-MS™ Intact mAb Standards (p/n: 186008843) and RapiFluor-MS High Mannose Test Standards (p/n: 186008317) were dissolved sequentially with 9 µL of water, 10 µL of dimethylformamide, and 21 µL of acetonitrile. 0.5 µL of the RapiFluor-MS High Mannose Test Standard was then transferred to the 40 µL vial of RapiFluor-MS Intact mAb Standard to spike in high mannose glycans at the ~1% level to facilitate easier monitoring throughout method development. 50 mM and 200 mM ammonium formate in water concentrations were prepared by adding Waters Ammonium Formate Solution–Glycan Analysis (p/n: 186007081) to 1 L and 0.250 L of water, respectively.
Universal N-Glycan Method
|
LC system: |
ACQUITY Premier System |
|
Detection: |
ACQUITY FLR Detector (λexcitation= 265 nm,λemission= 425 nm) |
|
Column: |
ACQUITY Premier Glycan BEH™ Amide Column, 1.7 µm, 130 Å, 2.1 x 150 mm (p/n: 186009524) |
|
Vials |
QuanRecovery™ with MaxPeak™ HPS Vial and pre-slit PTFE silicone cap (p/n: 176004434) |
|
Column temperature: |
60 °C |
|
Sample temperature: |
10 °C |
|
Injection volume: |
1 µL |
|
Mobile phase A: |
50 mM ammonium formate in water |
|
Mobile phase B: |
Acetonitrile |
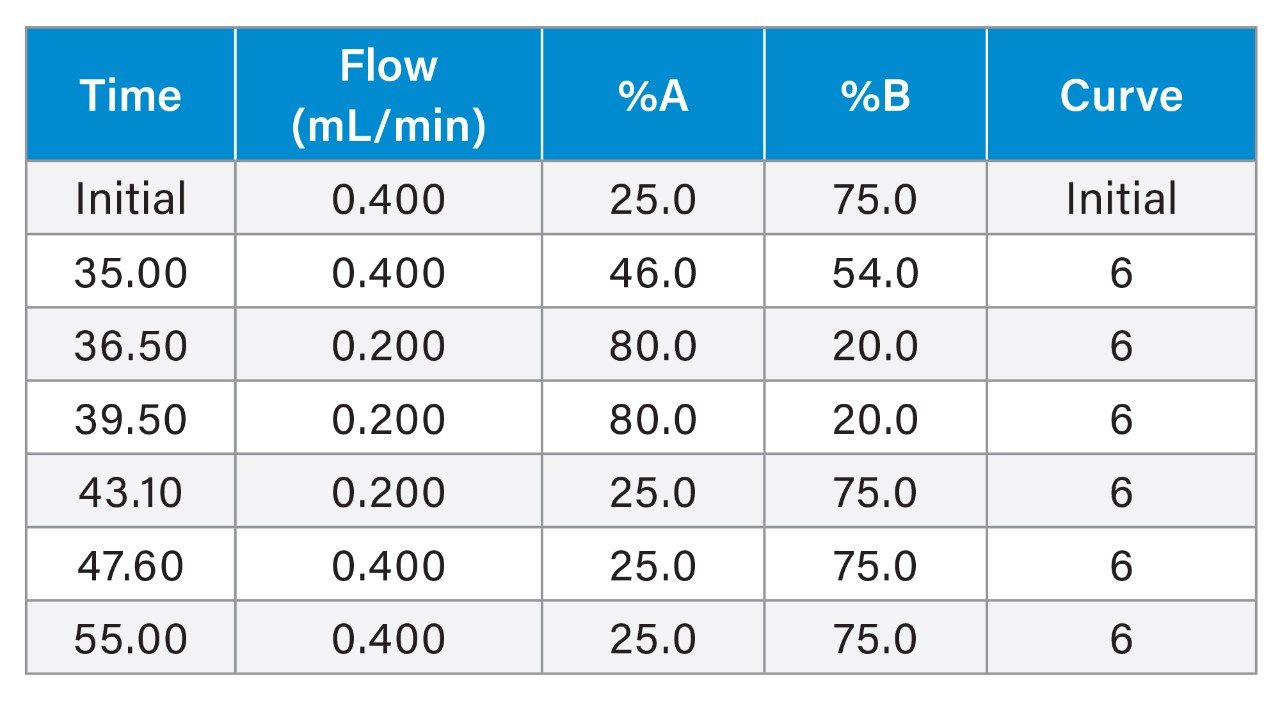
LC Gradient
Targeted Mannose-5 Glycan Method
|
LC system: |
ACQUITY Premier System |
|
Detection: |
ACQUITY FLR Detector (λexcitation= 265 nm,λemission= 425 nm) |
|
Column: |
ACQUITY Premier Glycan BEH Amide Column, 1.7 µm, 130 Å, 2.1 x 150 mm (p/n: 186009524) |
|
Vials: |
QuanRecovery with MaxPeak HPS Vial and pre-slit PTFE silicone cap (p/n: 176004434) |
|
Column temperature: |
30 °C |
|
Sample temperature: |
10 °C |
|
Injection volume: |
1 µL |
|
Mobile phase A: |
50 mM ammonium formate in water |
|
Mobile phase B: |
Acetonitrile |
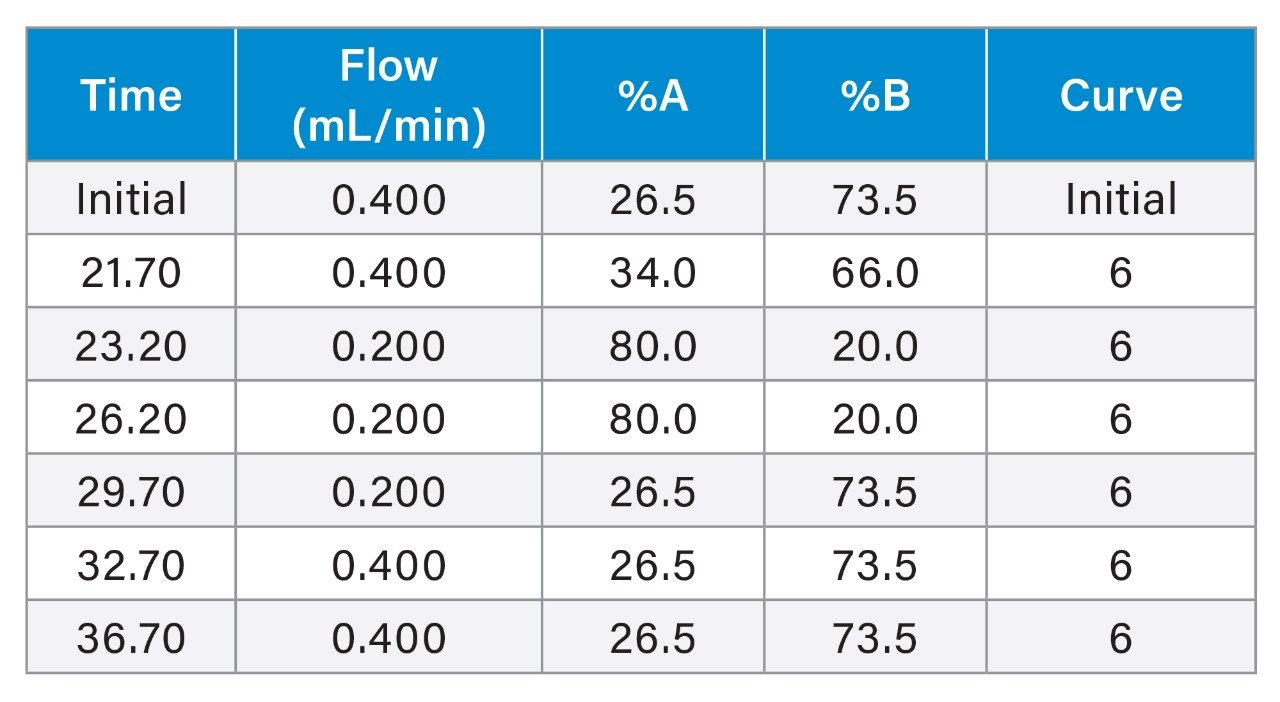
LC Gradient
MS Detector Settings for Selectivity Confirmation
|
LC system: |
ACQUITY QDa II Mass Detector |
|
Ionization mode: |
ESI positive |
|
Scan rate: |
5 Hz |
|
Acquisition range: |
350–1,500 m/z |
|
Capillary voltage: |
1.5 kV |
|
Cone voltage: |
15 V |
|
Probe temperature: |
500 °C |
SIRs
|
N-Glycan |
m/z |
|
Man-5 |
774.2 |
|
FA1G1 |
867.5 |
|
A2G1 |
895.9 |
Software
|
Chromatography data system : |
Empower 3.8.1 |
|
Method development software: |
Fusion QbD® Software from S-Matrix Corporation, Version 9.9.2 SR3.b |
Results and Discussion
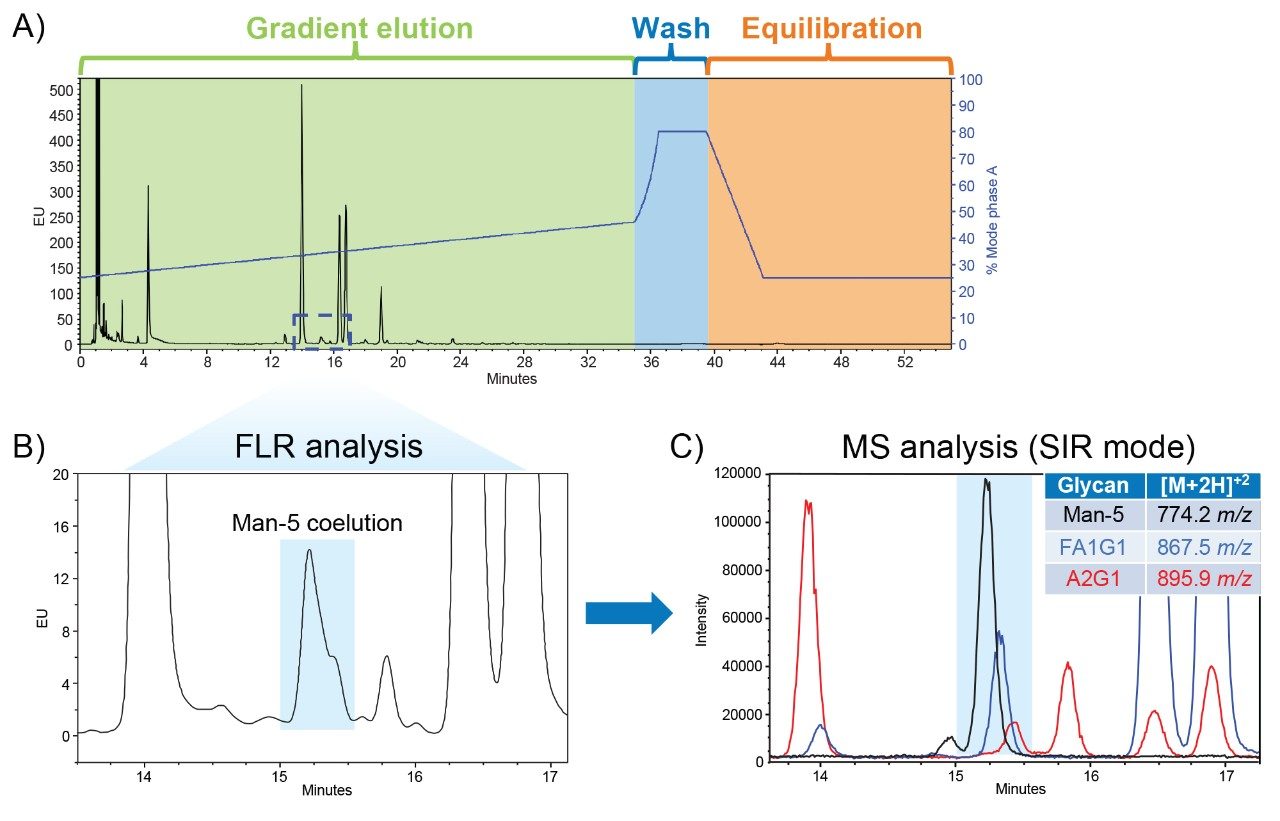
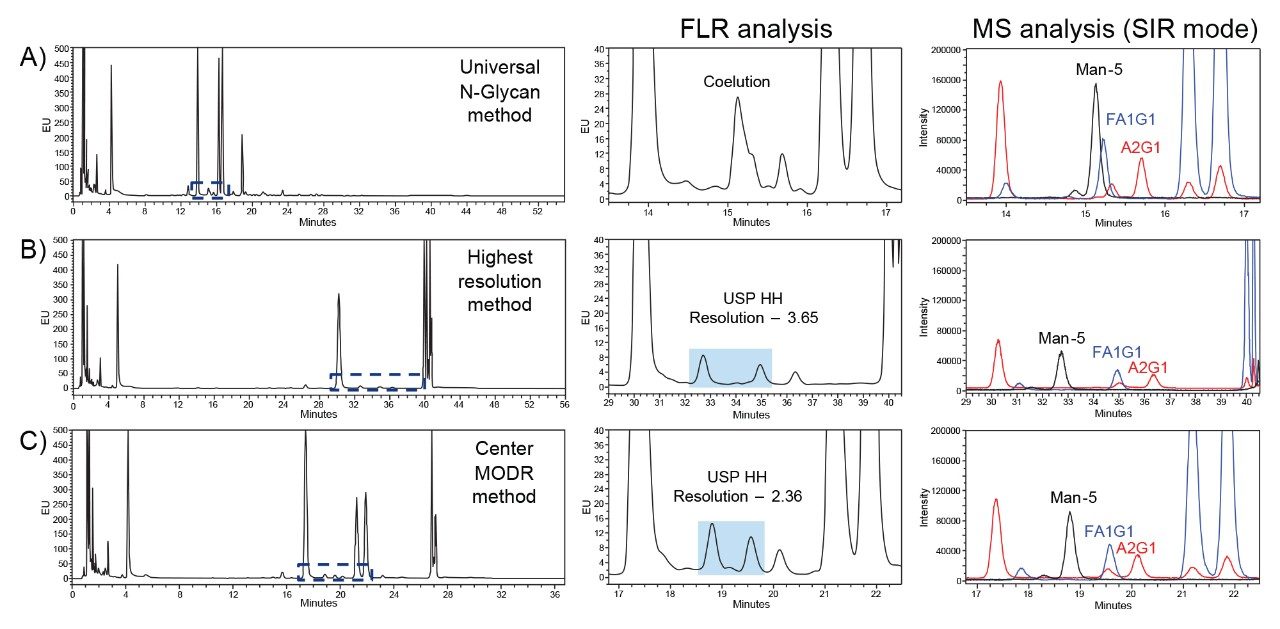
During method development, particularly within the framework of AQbD, established platform methods can serve as a strategic starting point for creating robust and reliable analytical procedures. While these methods can be valuable during the development stages, they may fall short when targeting specific peaks of interest. As shown in Figure 1A, a universal N-glycan HILIC method was previously developed to separate diverse types of N-glycans from mAb drug products. This platform method is the basis of the GU integrated scientific library within UNIFI and is the recommended method for a variety of RapiFluor-MS standards.
In this chromatogram, the RapiFluor-MS Intact mAb Standard produces a similar N-glycan profile to that of therapeutic mAbs and at least 14 different N-glycans can be readily identified.3 However, several peaks are only partially resolved and consequently difficult to monitor by FLR. In Figure 1B, one critical glycan species that is not fully resolved is the Man-5 glycan. This glycan impacts the pharmacokinetics and efficacy of mAbs and requires monitoring due to its influence on clearance rates.4 Therefore, robust separation of the Man-5 glycan is the Critical Quality Attribute (CQA) defined for this study. Its coelution in the platform method necessitates the use of the ACQUITY QDa II Mass Detector to leverage the specificity of SIR mass analysis for separating Man-5 from the coeluting FA1G1 and A2G1 glycans as shown in Figure 1C. By applying AQbD principles, the universal N-glycan HILIC method will be systematically optimized to develop a targeted assay for monitoring Man-5 glycans by FLR.
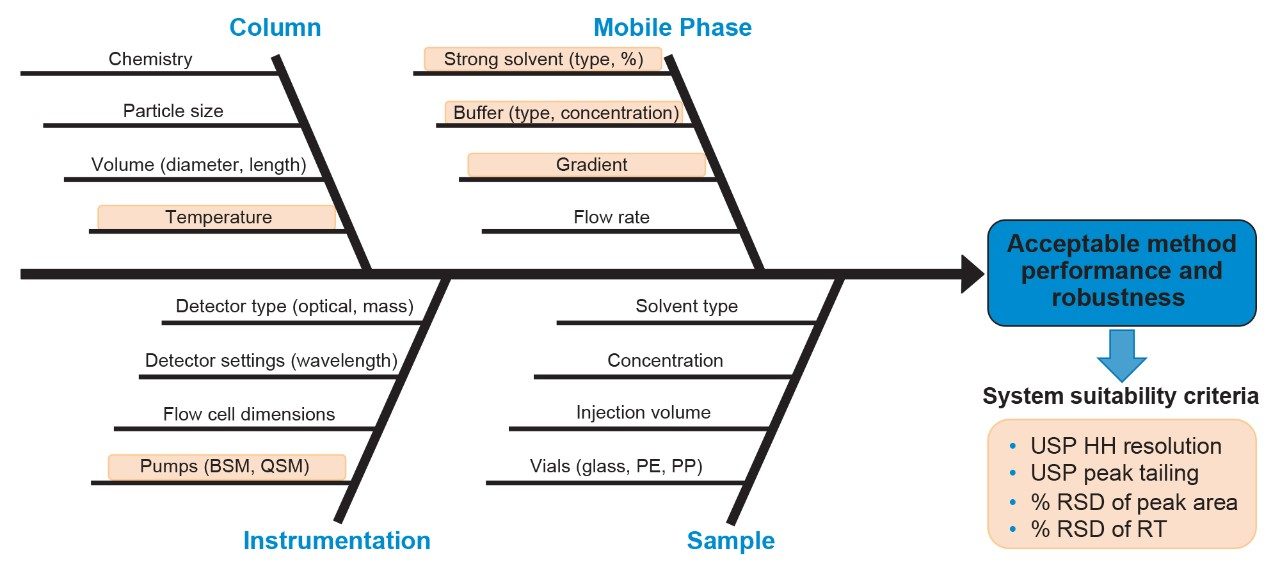
With the CQA identified, the next step in the AQbD workflow is to identify CMPs that can affect the method attributes. As illustrated in Figure 2, various method parameters can influence chromatographic performance of CQAs, including sample, instrumentation, column, and mobile phase changes. According to ICH Q14 guidance, prior knowledge can be explicitly or implicitly used during analytical procedure development.1 By combining empirical knowledge and scientific literature, the variables highlighted in orange were selected for preliminary experiments to confirm the improvement of Man-5 separation using a one-factor-at-a-time (OFAT) approach. These preliminary experiments provided a suitable range of method conditions, including minimum and maximum values, for multivariate analysis using DoE and modeling software. By employing DoE software, multiple variables can be efficiently analyzed simultaneously to gain a comprehensive understanding of the relationship between the CMPs and the response of the analytical method for Man-5 separation.
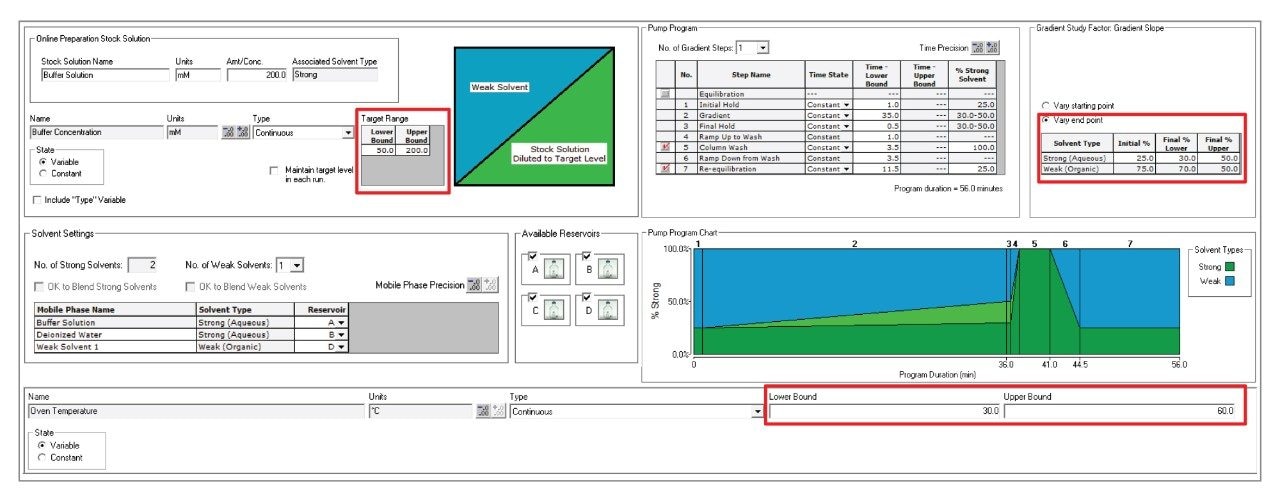
The software chosen for the DoE was Fusion QbD Software from S-Matrix Corporation. Fusion QbD Software performs mathematical modeling to identify chromatographic conditions that meet robustness and performance goals. As shown in Figure 3, the minimum and maximum range of method conditions were entered into the experiment setup tab. For the initial DoE, buffer concentration was evaluated between 50–200 mM of ammonium formate, column temperature between 30–60 °C, and a gradient slope between 0.14–0.72% ammonium formate/min (30–50% final % strong solvent). The integration of Fusion QbD Software with Empower 3 CDS creates a streamlined solution for method development. Based on the proposed DoE, the software automatically generates and exports the instrument methods to Empower CDS and then imports the integrated results for statistical analysis. This seamless data exchange ensures that method conditions are accurately implemented, facilitating efficient and error-free optimization.
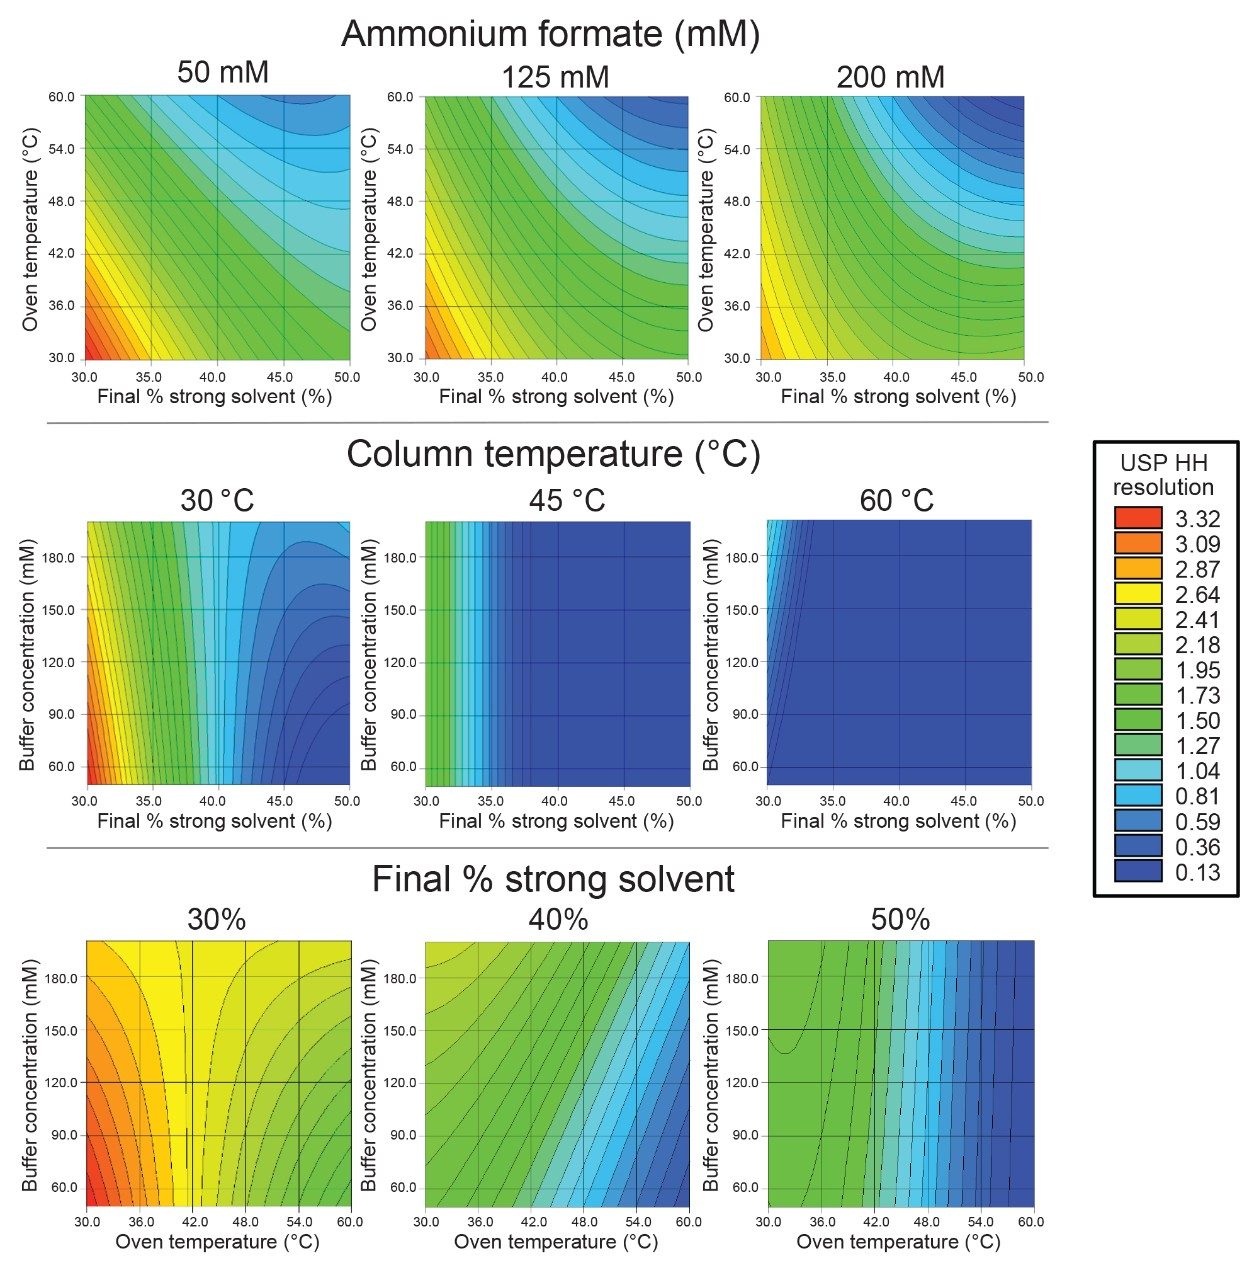
After integrating the experiment chromatograms in Empower 3 CDS, the results were imported into Fusion QbD Software for mathematical modeling. To determine the optimal method conditions for resolving Man-5, the performance goal selected was to maximize USP half height (HH) resolution between Man-5 and FA1G1/A2G1. Figure 4 summarizes the results for the separation of this critical peak pair with resolution maps at the low, medium, and high range for the three variables evaluated. The resolution maps are color coded to represent the resolution of the critical peaks with red areas indicating the highest resolution (>3.0) and blue areas indicating significant coelution. These resolution maps provide a comprehensive overview of the method’s performance across the range of tested conditions and reveal complex relationships that might not be apparent from an OFAT approach. For example, ammonium formate concentration initially appeared to have a larger impact on separating Man-5 from FA1G1/A2G1 in the preliminary OFAT experiments. However, when evaluating multiple factors, column temperature and gradient slope were much more impactful on resolving Man-5. Without adjusting these parameters, resolving Man-5 would not be possible as is shown with the resolution maps for column temperature at 60 °C and final % strong solvent at 50%. The experiment run from the DoE that achieved the highest resolution was an ammonium formate concentration of 50 mM, a column temperature of 30 °C, and a gradient slope of 0.14% ammonium formate/min (30% final strong solvent).
With the method parameters that achieve the highest resolution established, the focus of the following DoEs was to reduce the method’s runtime. As shown in Figure 5A, the gradient slope and the gradient run time were adjusted at both the starting and end points. This design aims to find the optimal gradient conditions for a faster run time while maintaining a minimum resolution threshold. Since the mobile phase concentration was established in the previous DoE, another parameter to reduce runtime is the choice of pump in the LC system. Illustrated in the schematic in Figure 5B, quaternary pumps (QSM) can mix four different solvents together to create buffer concentrations of various strengths. This was critical for efficiently evaluating five different ammonium formate concentrations (50, 87.5, 125, 162.5, and 200 mM) in the initial DoE by using three mobile phase reservoirs (200 mM ammonium formate, water, and acetonitrile). However, with the optimal ammonium formate concentration identified, the mixing functionality of the QSM will not be necessary, allowing the use of a binary pump (BSM).
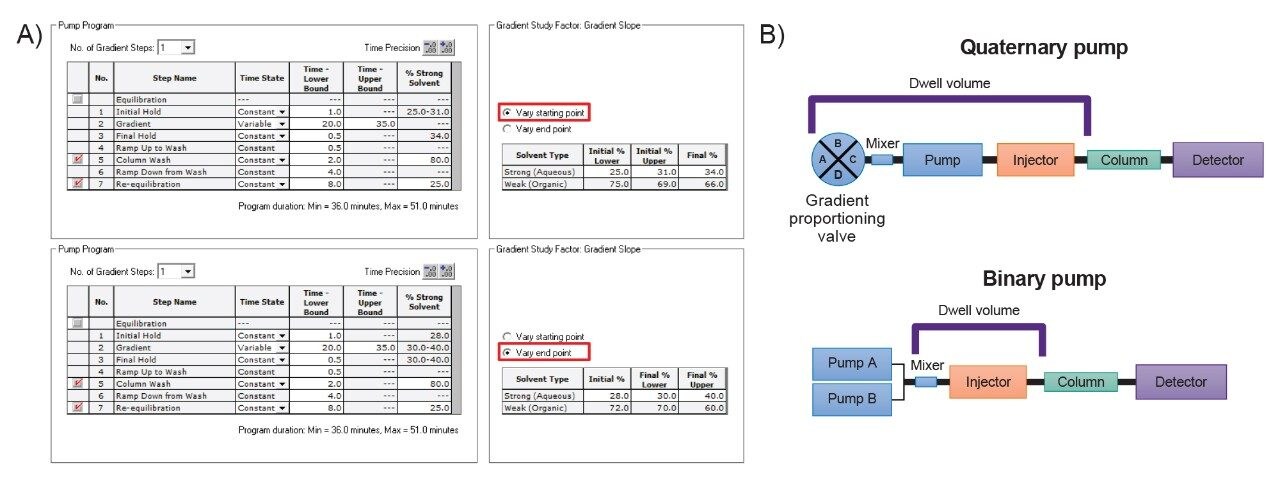
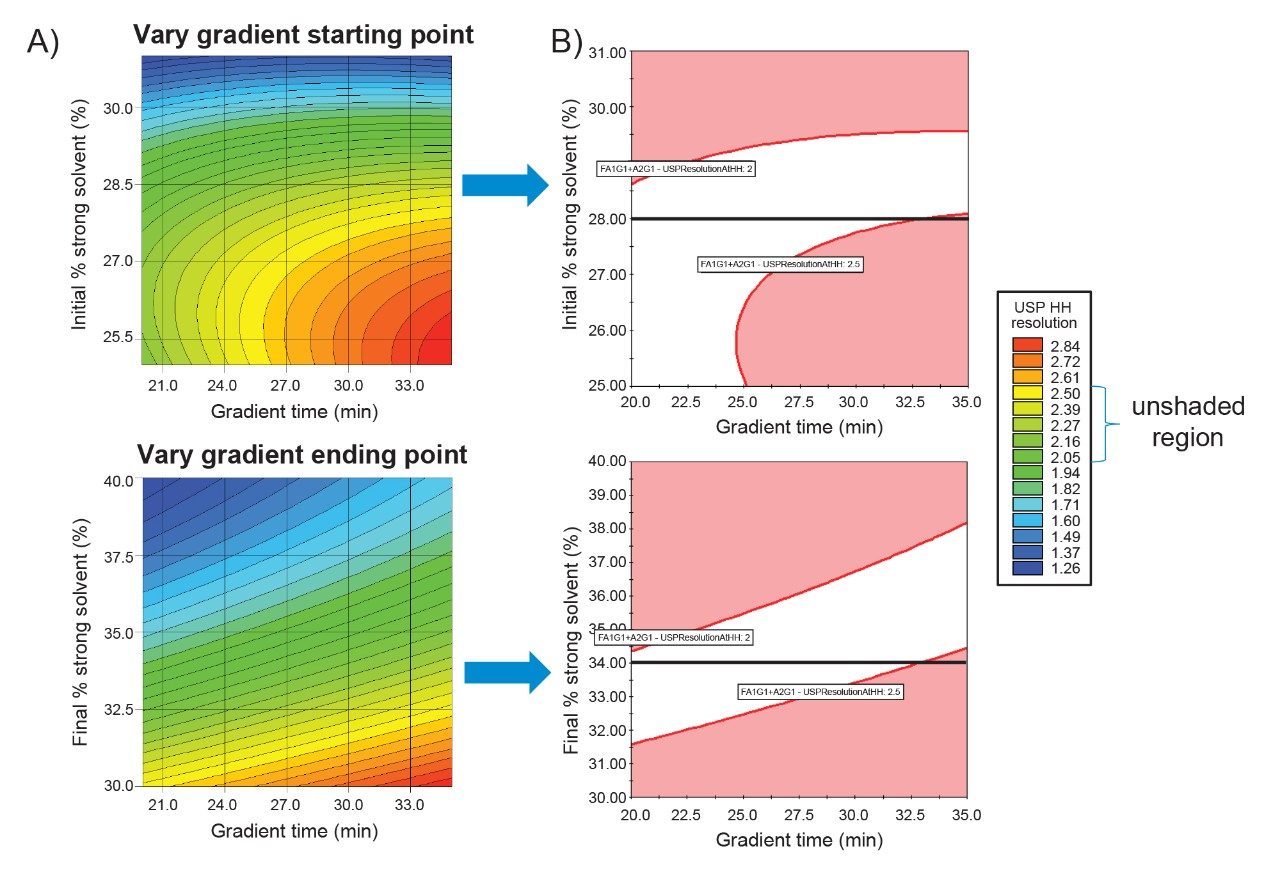
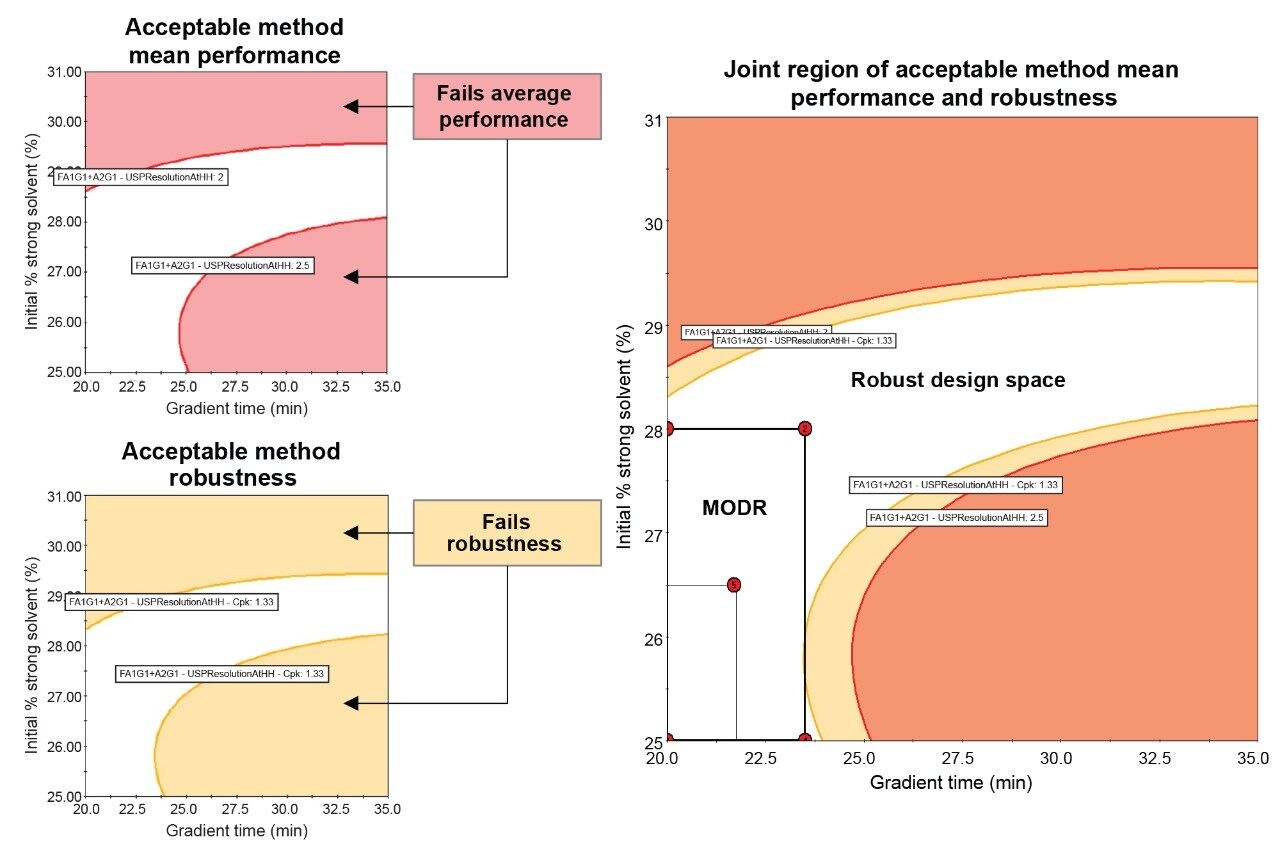
This change results in a lower dwell volume for faster gradient response time and improved gradient precision due to high-pressure solvent mixing. The results of these modifications are shown in Figure 6A. For both DoEs, the highest resolution was observed with the longest gradient time and the shallowest gradient. To narrow down the method conditions, Figure 6B shows the unshaded region representing method performance that meets a USP HH resolution between 2.0 and 2.5 for Man-5. Since the starting point had a final 34% ammonium formate gradient and the end point had a starting 28% ammonium formate gradient, a black line represents the area where the data between the two DoEs are the same. Even though two different experimental designs and resulting data sets populated the models, there is a strong similarity of the unshaded regions at these points, indicating consistency in the estimated study parameter effects across models.
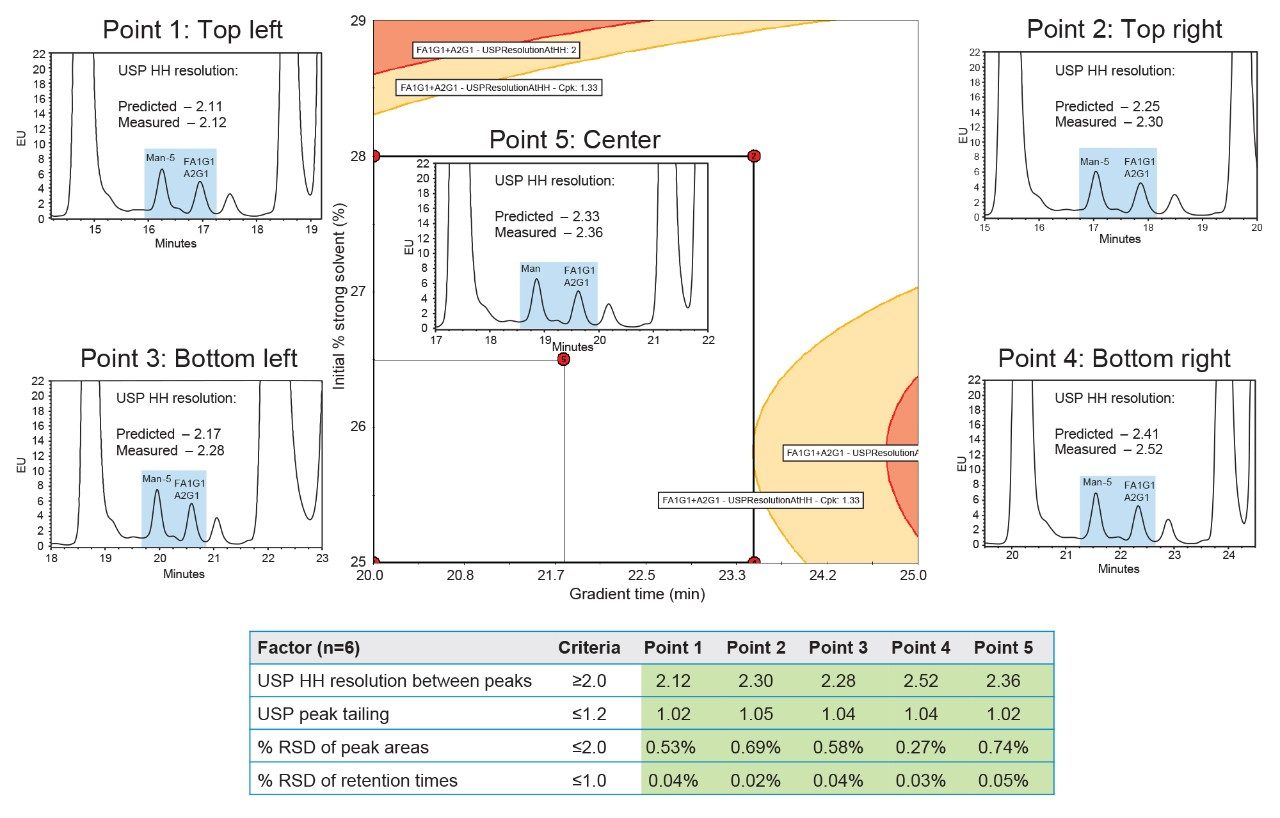
Since the DoE that changed the starting gradient point had a larger unshaded region, further statistical analysis of this DoE was performed to create a robust design space of acceptable method mean performance and robustness (Figure 7). The Robustness Simulator™ tool within Fusion QbD Software predicts how variations in method parameters can jointly affect the performance of the method. This is calculated using the process capability index which measures the ability of a method to produce a result within specification limits. The robustness simulation was calculated for mobile phase composition to give a Cpk value of ≥1.33. A Cpk value of 1.33 or greater corresponds to a process with an edge of failure at least four sigma (σ) from the mean response, indicating a reliable and stable method for meeting specifications.5 When the robustness and acceptable mean performance are overlaid, the unshaded region produces a robust design space that can be used to establish a MODR. Since the goal of the final DoE was to reduce runtime without sacrificing resolution, the five verification points of the MODR with the lowest gradient times were selected. To determine repeatability, each of the five verification points were analyzed six times and compared to the system suitability criteria outlined in Figure 2. In Figure 8, all five verification points meet system suitability criteria, ensuring accuracy and consistency of the developed method. Furthermore, the measured USP HH resolution between Man-5 and FA1G1/A2G1 agrees within ~0.1 units of the resolution values predicted by Fusion QbD, indicating experimental verification of the modeled results.
The methods analyzed and developed using AQbD principles provided enhanced understanding of the HILIC method in relation to its critical parameters. Each DoE allowed for better control and optimization based on the predefined objectives to identify optimal conditions and mitigate risks with variability. In summary, Figure 9 visually highlights the advantages and disadvantages of each method based on the entire chromatogram and a zoomed-in image of Man-5, FA1G1, and A2G1. The universal N-glycan method excels at separating a variety of glycans, while not being optimized for any particular N-glycan (Figure 9A). The highest resolution method from the initial DoE provides excellent separation of Man-5 from FA1G1/A2G1, but this is at the expense of reducing sensitivity due to broader peaks from the shallow gradient (Figure 9B). Lastly, the method from the center verification point of the MODR strikes an excellent balance between the other two methods, providing the resolution required to quantitate Man-5 without significantly impacting sensitivity (Figure 9C). Unlike the traditional OFAT approach, AQbD allows for a comprehensive understanding of the interactions between multiple factors and their collective impact on performance. The ability to predict and control variability through AQbD ultimately results in more efficient and effective method development, leading to reproducible and high-quality results.
Conclusion
By applying AQbD principles, the universal N-glycan HILIC method was efficiently transformed into a targeted, high-performance assay for Man-5 glycan monitoring using FLR detection. Leveraging tools such as DoE, Fusion QbD Software, and the ACQUITY QDa II Mass Detector enabled a data-driven approach to method optimization. This resulted in a comprehensive understanding of critical method parameters and their impact on chromatographic performance. This process led to the establishment of a robust MODR, ensuring the methods reliability, robustness, and compliance with regulatory requirements. Methods within the MODR demonstrated high resolution, specificity, and consistency, ideal for routine analytical workflows focused on Man-5 monitoring. Overall, the tailored method developed through AQbD principles offers a more efficient and effective solution than a traditional OFAT approach. This approach highlights the advantages of using AQbD for method development, ultimately leading to enhanced method performance and reduced variability.
References
- Yu YQ. Released N-linked Glycan Analysis Using the Glycan Application Solution With UNIFI. Waters Application Note. January 2016. 720005598.
- ICH Q14 Guideline on Analytical Procedure Development. International Council for Harmonisation of Technical Requirements for Pharmaceuticals for Human Use. November 2023.
- McCall SA, Lauber MA, Koza SM, Chambers EE. Profiling Released High Mannose and Complex N-Glycan Structures from Monoclonal Antibodies Using RapiFluor-MS Labeling and Optimized Hydrophilic Interaction Chromatography. Waters Application Note. October 2015. 720005516.
- Goetze AM, Liu YD, Zhang Z, Shah B, Lee E, Bondarenko PV, Flynn GC. High-mannose Glycans on the Fc Region of Therapeutic IgG Antibodies Increase Serum Clearance in Humans. Glycobiology. Jul 2011, 21(7):949–59.
- QbD-aligned LC Method Development with Fusion QbD. Fusion LC Method Development White Paper V3.2.2018.
Fusion QbD is a registered trademark of S-Matrix Corporation.
720008799, May 2025