Extraction and Analysis of a Definitive Drug Panel in Hair Samples by UHPLC-MS/MS for Forensic Toxicology
Extraction and Analysis of a Definitive Drug Panel in Hair Samples by UHPLC-MS/MS for Forensic Toxicology
Jonathan Danaceau, Lisa Calton
Waters Corporation, United States
Published on June 10, 2025
Abstract
This application note describes a robust UHPLC-MS/MS method for the analysis of drugs of abuse in hair to satisfy the confirmation cut-off values as recommended by the Society of Hair Testing (SoHT).1,2 Many common forensically relevant drugs are included including opiates, amine stimulants, benzodiazepines, fentanyl and other synthetic opiates, and other common drugs of abuse. Extraction conditions were optimized to address the wide variety of compounds. The samples were then cleaned up using Oasis™ MCX mixed-mode cation exchange plates and separated on an ACQUITY™ UPLC™ I-Class Plus System. The Xevo™ TQ Absolute Triple Quadrupole Mass Spectrometer provided the specificity and sensitivity to meet the detection requirements outlined by the SoHT.
Benefits
- Hair matrix provides long drug detection window and collection is non-invasive
- Optimized sample preparation for a wide variety of compounds
- Robust method using UHPLC-MS/MS for the sensitive determination of forensically relevant drugs in hair
Introduction
The use of hair as a biological matrix for forensic testing continues to increase in popularity. As a specimen, hair offers several benefits. In contrast to other matrices such as blood, hair collection is simple and does not require medically trained staff to collect the sample. Sample collection is not considered intrusive, meaning that collection can be easily supervised, thus reducing the potential for sample adulteration. Further, once collected, hair can be easily transported and stored at room temperature prior to analysis.
Drug substances can be incorporated into the hair by various mechanisms including passive diffusion from the blood supply at the follicle into the growing hair matrix, diffusion into the hair shaft from sweat or sebum or external contamination such as smoke or contaminated hands. Some key factors that affect the incorporation of hair include the melanin content of the hair, pKa of the analyte and the degree of lipophilicity of the analyte.
One key benefit of hair is that it provides an extended window of detection for drug exposure. Unlike traditional matrices such as blood and urine, where drugs may only be detected within hours or days of use, drugs can be detected in hair months and even years after use. Hair generally grows at a rate of 1 cm per month. Thus, a hair sample can provide an accumulated specimen which can provide an insight into drug usage over recent months. This makes analysis of illicit drugs and pharmaceuticals in hair useful for situations where other samples may not be appropriate or available for analysis such as post-mortem toxicology, drug facilitated sexual assault (DFSE), or for employment testing in which long-term monitoring is desired.
Hair analysis does have some challenges that must be addressed, however. First, hair must be decontaminated prior to analysis to remove surface contamination. The pulverization step is also critical. More complete pulverization leads to more efficient extraction for many common drugs (Hu 2023, JAT; 47; 346–52).3 The initial extraction conditions are also crucial. Some drugs and metabolites are unstable at either high or low pH, and solvent composition can affect the efficiency of the extraction for different compounds. All these issues must be considered and balanced when extracting a large panel of compounds from hair.
In developing this analytical method, we were able to optimize the initial incubation to efficiently extract a wide variety of compounds including opiates, amine stimulants, benzodiazepines, synthetic opiates, and other forensically relevant compounds while meeting the sensitivity requirements of the Society of Hair Testing (SoHT). Oasis MCX plates enabled a quick and efficient sample clean up. Analyte recoveries were consistent and resulted in the accuracy and precision needed for this assay. Rapid separation was achieved with the ACQUITY UPLC I-Class Plus System and ACQUITY BEH™ Column coupled to the Xevo TQ Absolute Triple Quadrupole Mass Spectrometer which provided the sensitivity required for this analysis.
Experimental
LC/MS grade solvents were either from Fisher or Honeywell. Optima Grade formic acid and ammonium acetate were from Fisher Scientific. Certified reference materials and internal standards were acquired from Cerilliant (Round Rock, TX).
Hair samples were sourced from volunteers and analyzed as either single samples or blended.
External positive control samples were purchased from Comedical (Comedical.biz).
Certified reference standards and mixes were combined to make a nominal 10 µg/mL working stock solution which was then further diluted to produce working calibrator and quality control standards. 6-acetyl morphine and norfentanyl had a concentration of 2 µg/mL and fentanyl had a concentration of 1 µg/mL in the working stock solution. Seven working standards were prepared, ranging from 10–1000 ng/mL in methanol (MeOH). Quality control working stock solutions were prepared at concentrations of 30, 150, and 300 ng/mL in methanol. An internal standard (IS) stock solution was prepared at 1000 ng/mL in methanol. Working IS solutions were prepared daily in methanol at 250 ng/mL.
A volume of 20 µL of each working calibrator or control standard was added to 20 mg of hair, resulting in a nominal calibration range from 0.01–1.0 ng/mg and QC samples at concentrations of 0.03, 0.15, and 0.30 ng/mg hair.
Extraction Method
Hair samples were decontaminated by sequential solvent washes and allowed to fully dry. Bulk hair samples were pulverized using a Precellys Tissue Homogenizer and 2 mL CKMix Lysing Kits (Bertin Technologies, Montigny-le-Bretonneux, FR) for 6 x 6400 rpm for 40 seconds each.
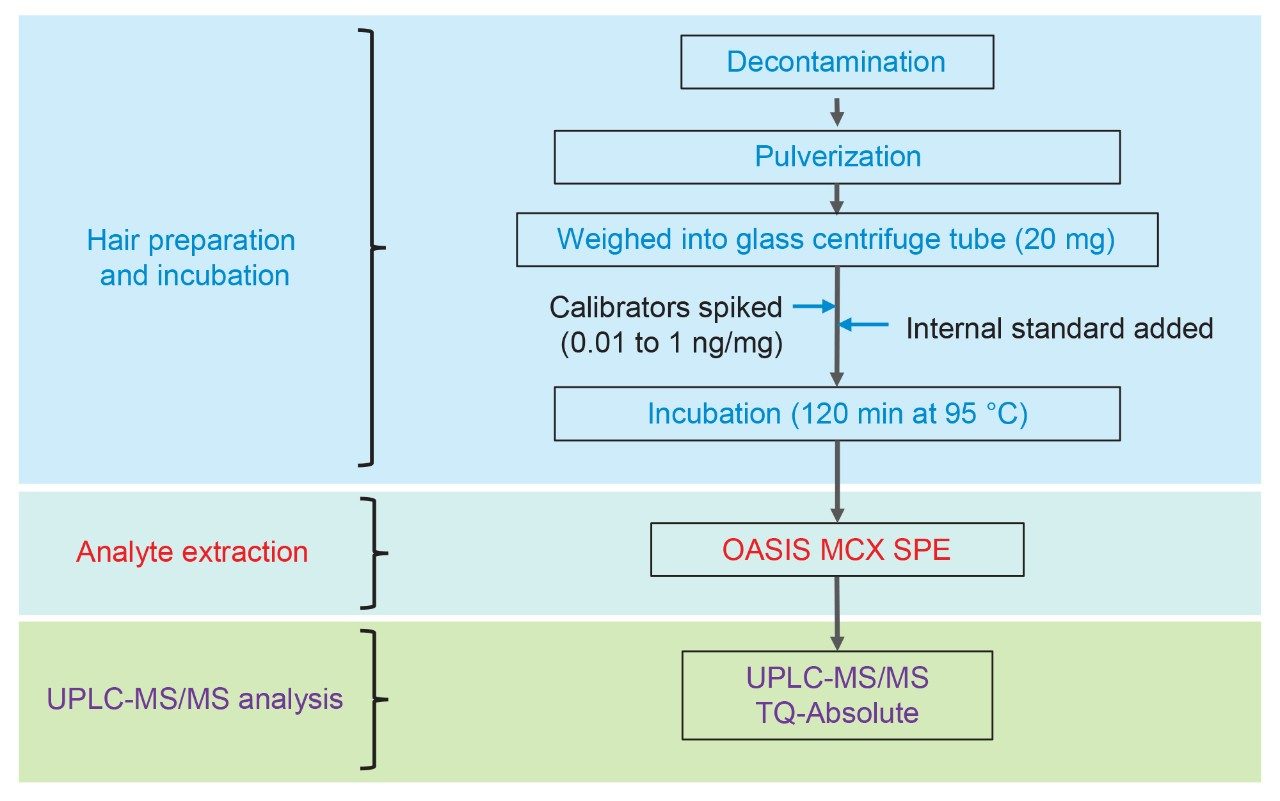
An aliquot of blank, pulverized hair (20 ± 1 mg) was weighed into 16 x 100 mm round bottomed glass centrifuge tubes. Working calibrator and QC solutions were added as described above along with 40 µL of working IS solution. A double blank sample was also prepared with no IS. Next, 1.2 mL of the extraction solution was added and then the tubes were capped, and samples were incubated for 2 hrs at 95 ºC. The samples were then centrifuged at 3200 rcf for 5 min and the solvent was transferred to a 2 mL 96-well collection plate containing 25 µL of formic acid. Sample extracts were evaporated for approximately 30 minutes to remove most of the solvent. After evaporation, samples were diluted with 1.5 mL of 4% phosphoric acid and loaded onto the wells of a Waters MCX 96-well plate (30 mg/well; p/n 186000258). The wells were then washed with 2 x 1 mL 80:20 water:methanol and eluted with 2 x 125 µL of 50:50 ACN:MeOH containing 5% strong ammonia (28–30%) and diluted with 500 µL of 97:2:1 water:ACN:formic acid. The entire extraction workflow is shown in Figure 1.
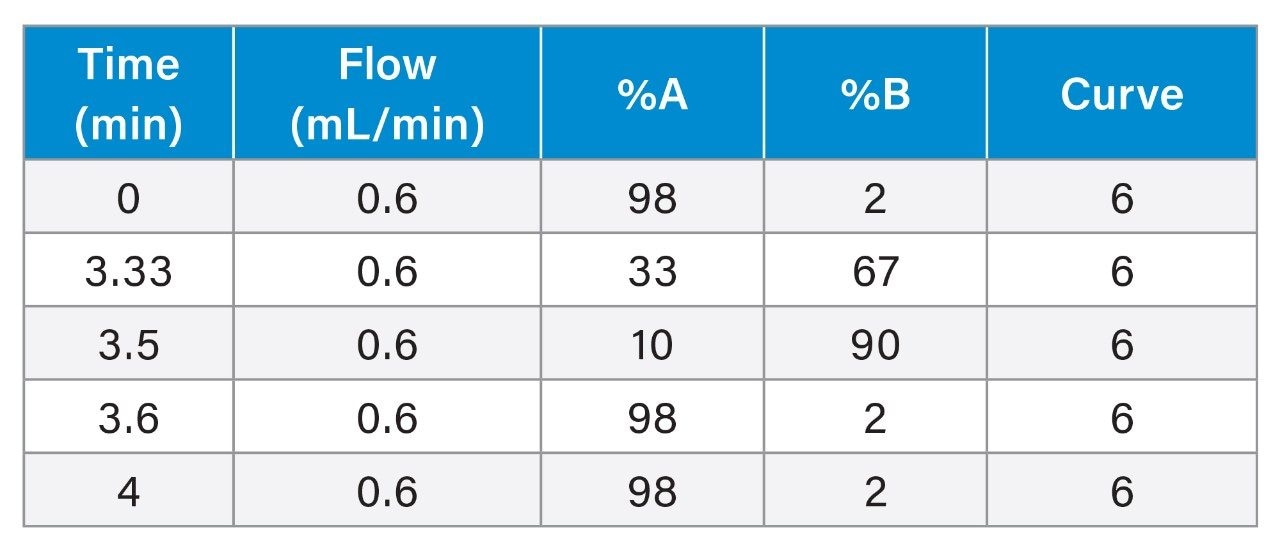
Chromatographic separation was achieved using a gradient of water and acetonitrile, both containing 0.1% formic acid, on an ACQUITY UPLC BEH C18 Column, 1.7 µm, 2.1 x 100 mm. The UHPLC System conditions are displayed below.
LC Conditions
|
LC system: |
ACQUITY UPLC I-Class PLUS System |
|
Column: |
ACQUITY UPLC BEH C18 1.7 µm, 2.1 x 100 mm |
|
Column temperature: |
40 °C |
|
Sample temperature: |
10 °C |
|
Injection volume: |
2 µL |
|
Flow rate: |
0.6 mL/min |
|
Mobile phase A: |
0.1% formic acid in MilliQ water |
|
Mobile phase B: |
0.1% formic acid in acetonitrile |
|
Wash solvent: |
25:25:25:25 MeOH:H2O:IPA:ACN |
Gradient Table
MS Conditions
|
MS system: |
Xevo TQ Absolute Triple Quadrupole Mass Spectrometer |
|
Ionization mode: |
ESI positive |
|
Desolvation temperature: |
500 °C |
|
Desolvation gas flow: |
1000 L/hr |
|
Cone gas flow: |
150 L/hr |
|
Acquisition range: |
MRM transitions optimized for individual compounds |
|
Capillary voltage: |
1.0 kV |
|
Collision energy: |
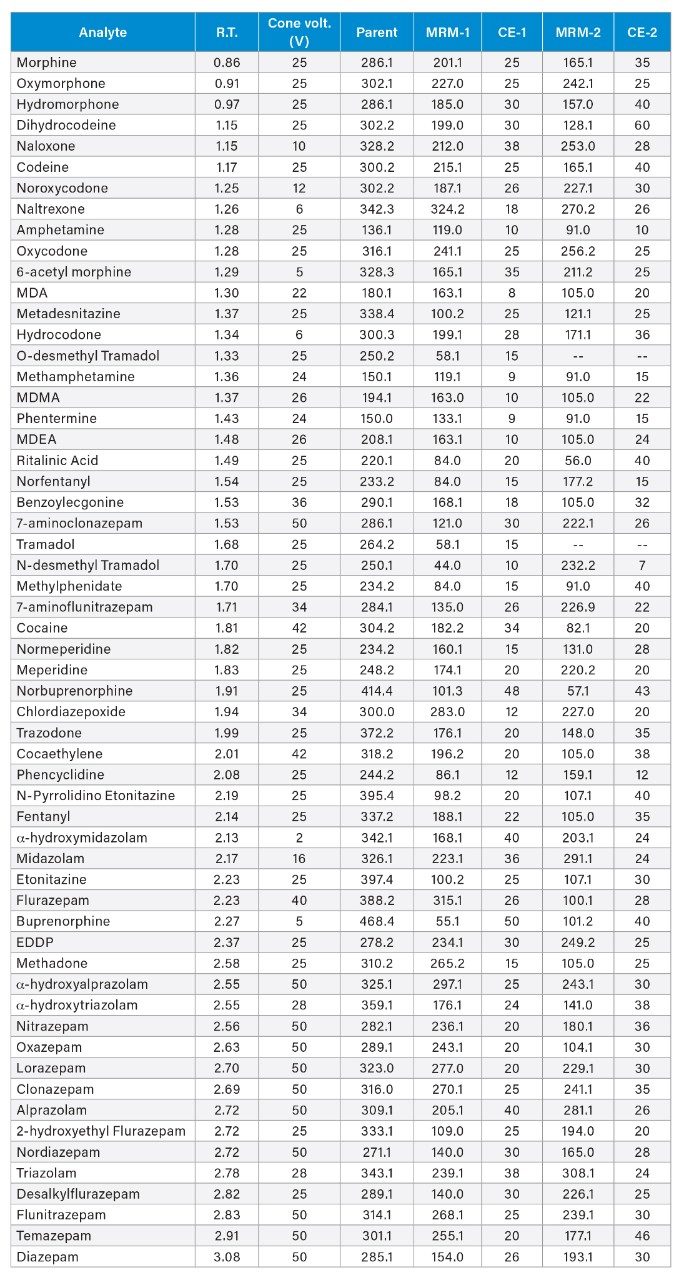
Optimized for individual compounds (See Appendix 1) |
|
Cone voltage: |
Optimized for individual compounds (See Appendix 1) |
Data Mangement
|
MS software: |
MassLynx™ Mass Spectrometry Software |
|
Quantification software: |
TargetLynx™ XS / QUAN Review |
Results and Discussion
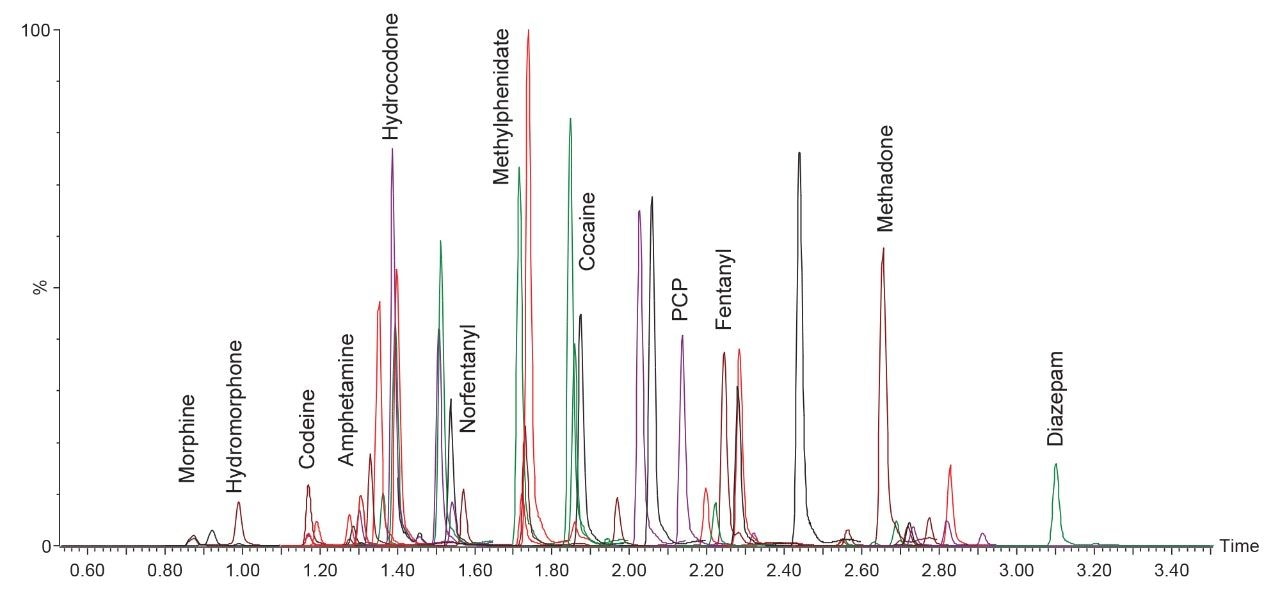
Figure 2 shows the resulting chromatography using the UPLC BEH C18 Column. Individual retention times are listed in Appendix 1. These chromatographic conditions were the same as those used previously for a multi-analyte panel in urine (Danaceau, 2017; 720006187). All compounds were baseline separated from any potentially interfering compounds and internal standards as shown previously. All compounds were eluted by 3.2 minutes with a total LC cycle time of 4.0 minutes.
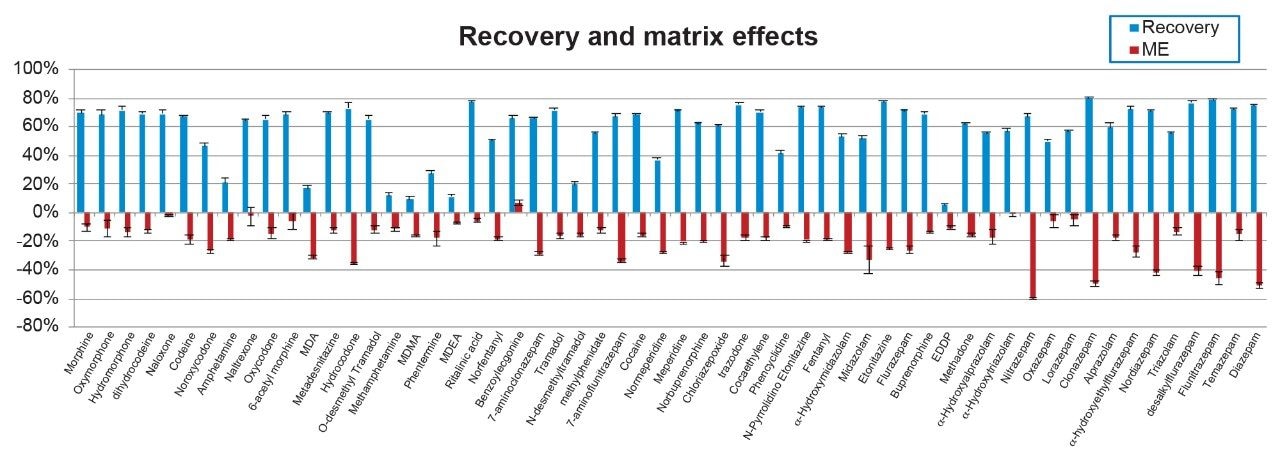
The sample preparation procedure was rapid, clean and robust. Figure 3 shows the recovery and matrix effects for all the compounds. Recoveries averaged 58% with 49/58 >40%. Some compounds such as the amine stimulants and EDDP demonstrated lower than average recovery. However, it was consistent and enabled the accurate and precise quantification of all compounds even at the lowest concentration levels. Matrix effects averaged 20% with only 6 compounds exceeding 40% ion suppression. The use of deuterated internal standards corrected for this, allowing accurate analyte quantification. As shown in Figure 3, matrix effects were consistent, with standard deviations all under 10%.
Several factors proved to be critical when optimizing the sample preparation procedure. For example, optmizing the incubation solution significantly improved recoveries for oxazepam and lorazepam. Additionally, the use of formic acid vs. HCl during in the evaporation step was necessary to prevent the acid catalyzed degradation of alprazolam, triazolam, and midazolam. Enzymatic digestion was also initially investigated as a sample pretreatment method. However, it needed an overnight digestion, many compounds demonstrated substantial ion suppression (>80%), and we saw significant chromatographic interferences, so it was not investigated further.
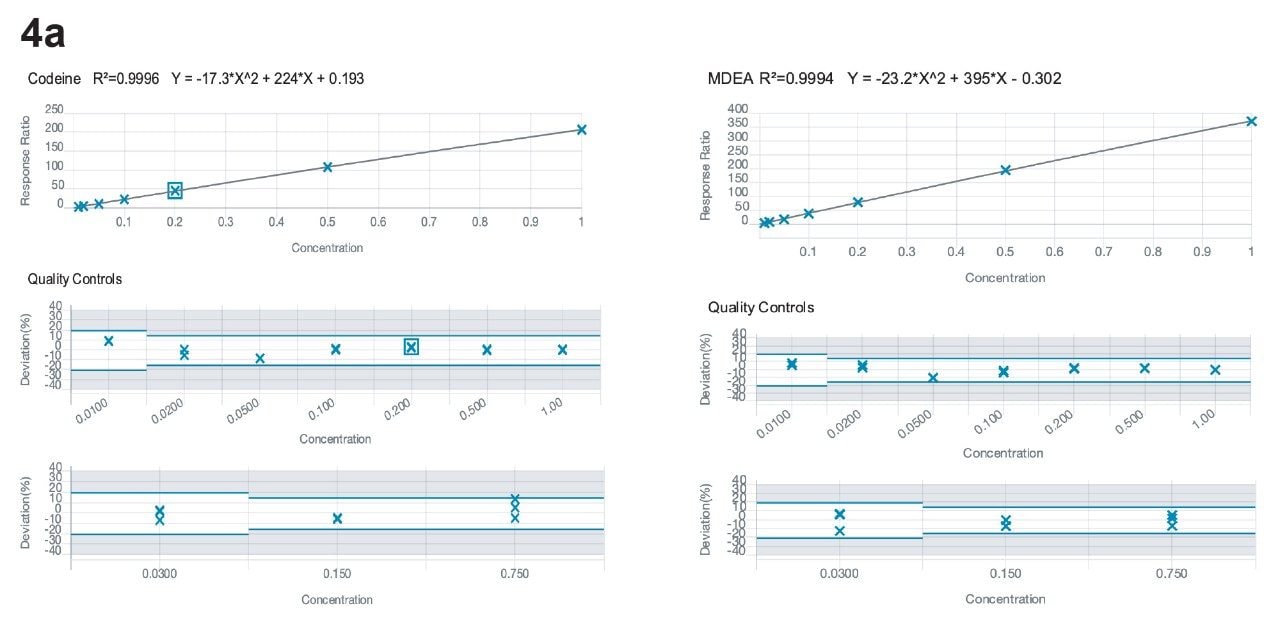
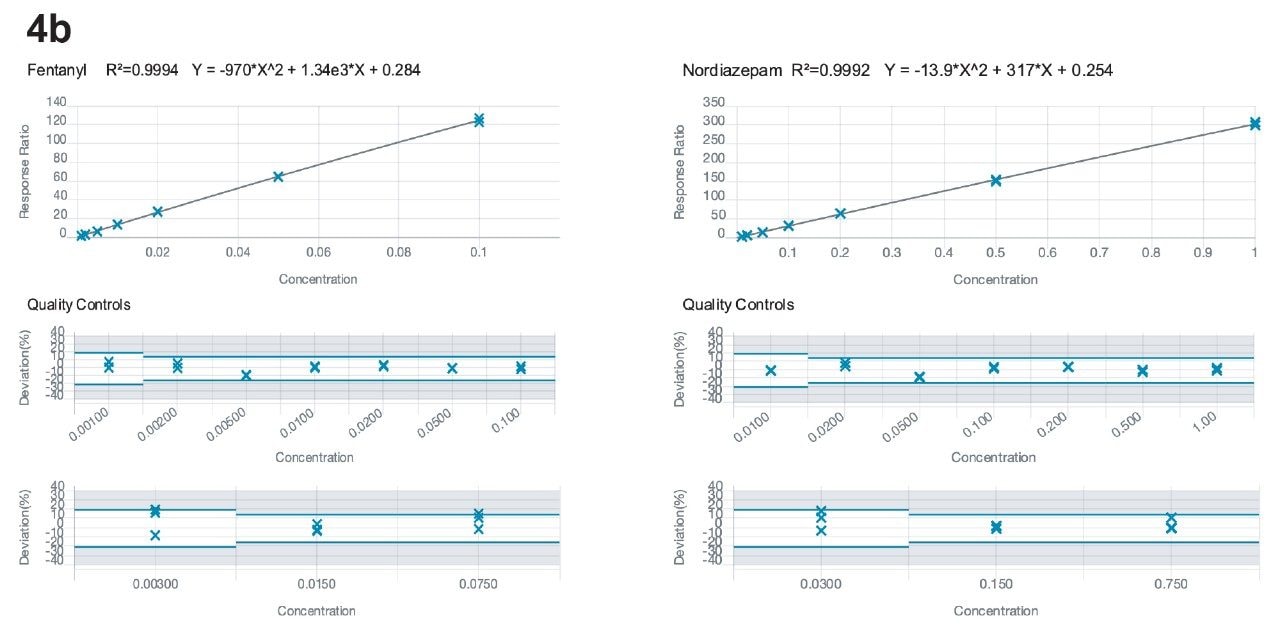
Calibration curves ranged from 0.01–1.0 ng/mg, encompassing the cutoff values of the Society of Hair Testing for drugs of abuse. As mentioned above, 6-acetyl morphine (6-AM) and norfentanyl had calibration ranges from 0.002–0.2 ng/mg and fentanyl had a calibration range from 0.001–0.1 ng/mg. All compounds had R2 values of 0.99 or better, apart from phentermine and metadesnitazine. Neither of these compounds had a stable labelled internal standard and phentermine was also subject to significant matrix-based interference. Figure 4 shows calibration curves for morphine, methamphetamine, fentanyl, and alprazolam.
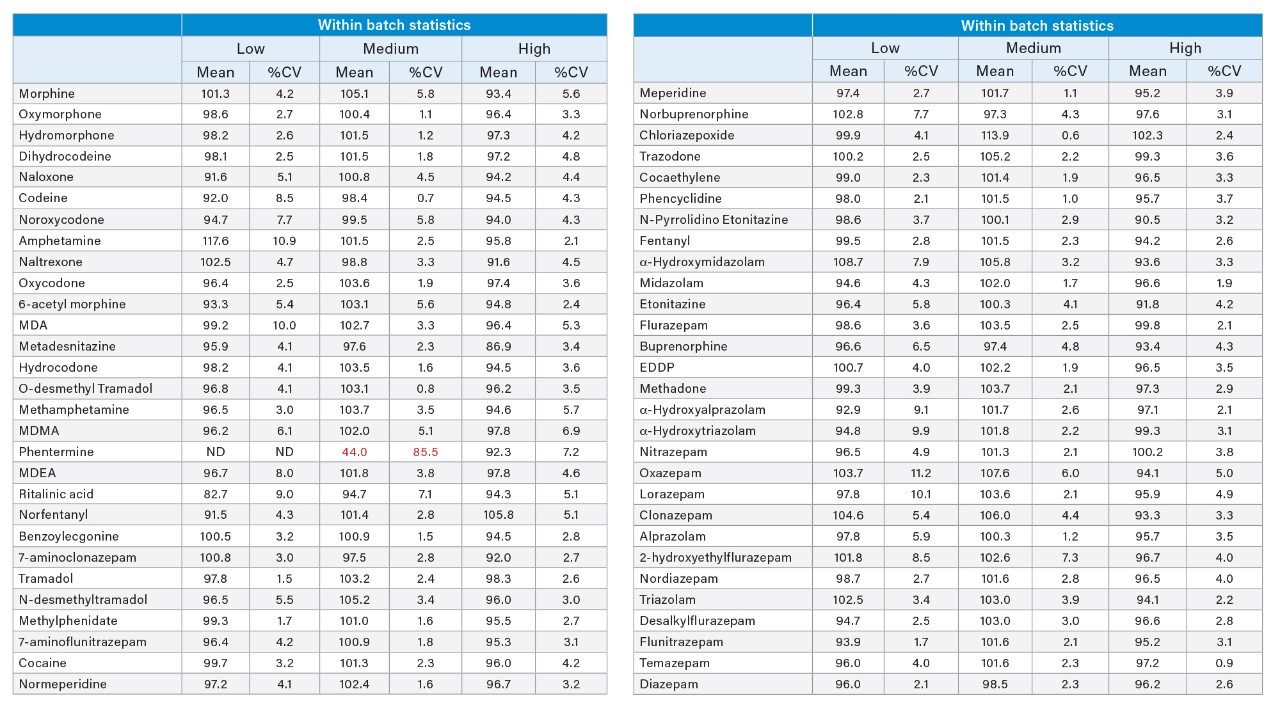
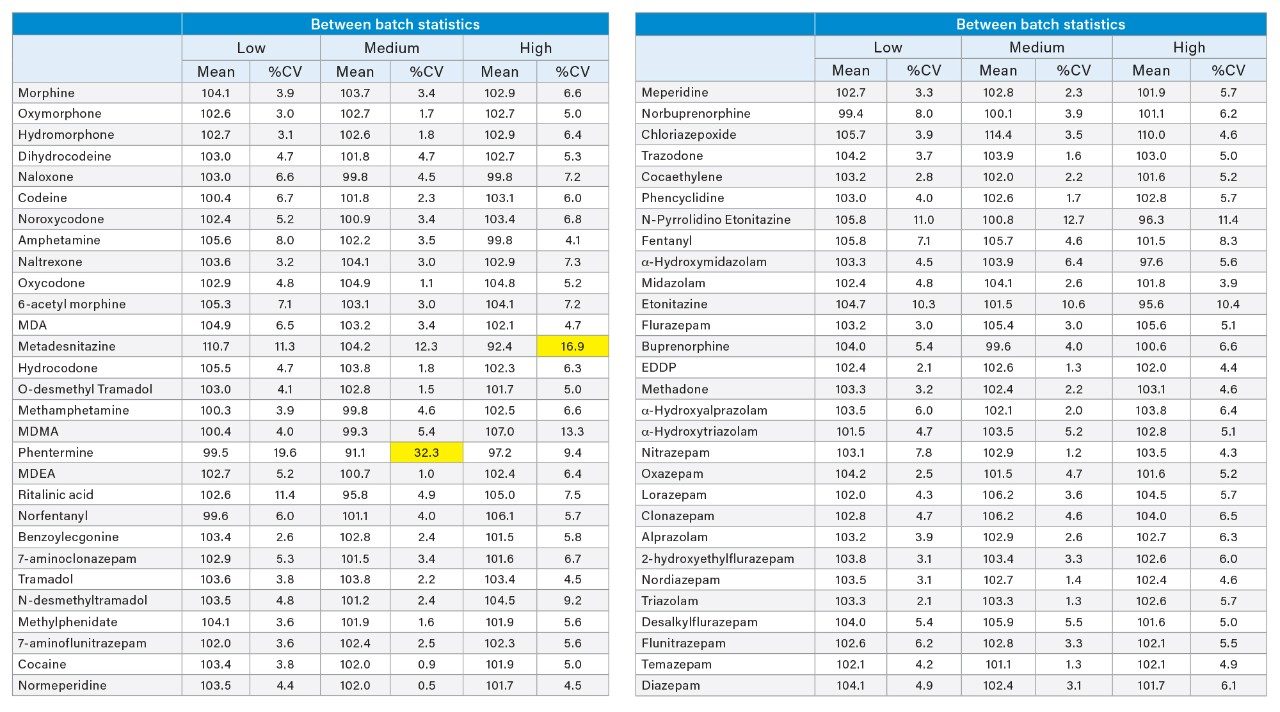
Accuracy and precision were evaluated by extraction of 5 individual batches. The results are shown in Appendices 2 and 3. All compounds had within-run and between-run accuracies within 15% of target values (20% for low QC samples) and %CVs <15% (20% for the low QC samples), apart from phentermine and metadesnitazine. The remainder of the compounds demonstrated accuracy and precision values that met the validation requirements of ASB Standard-036.
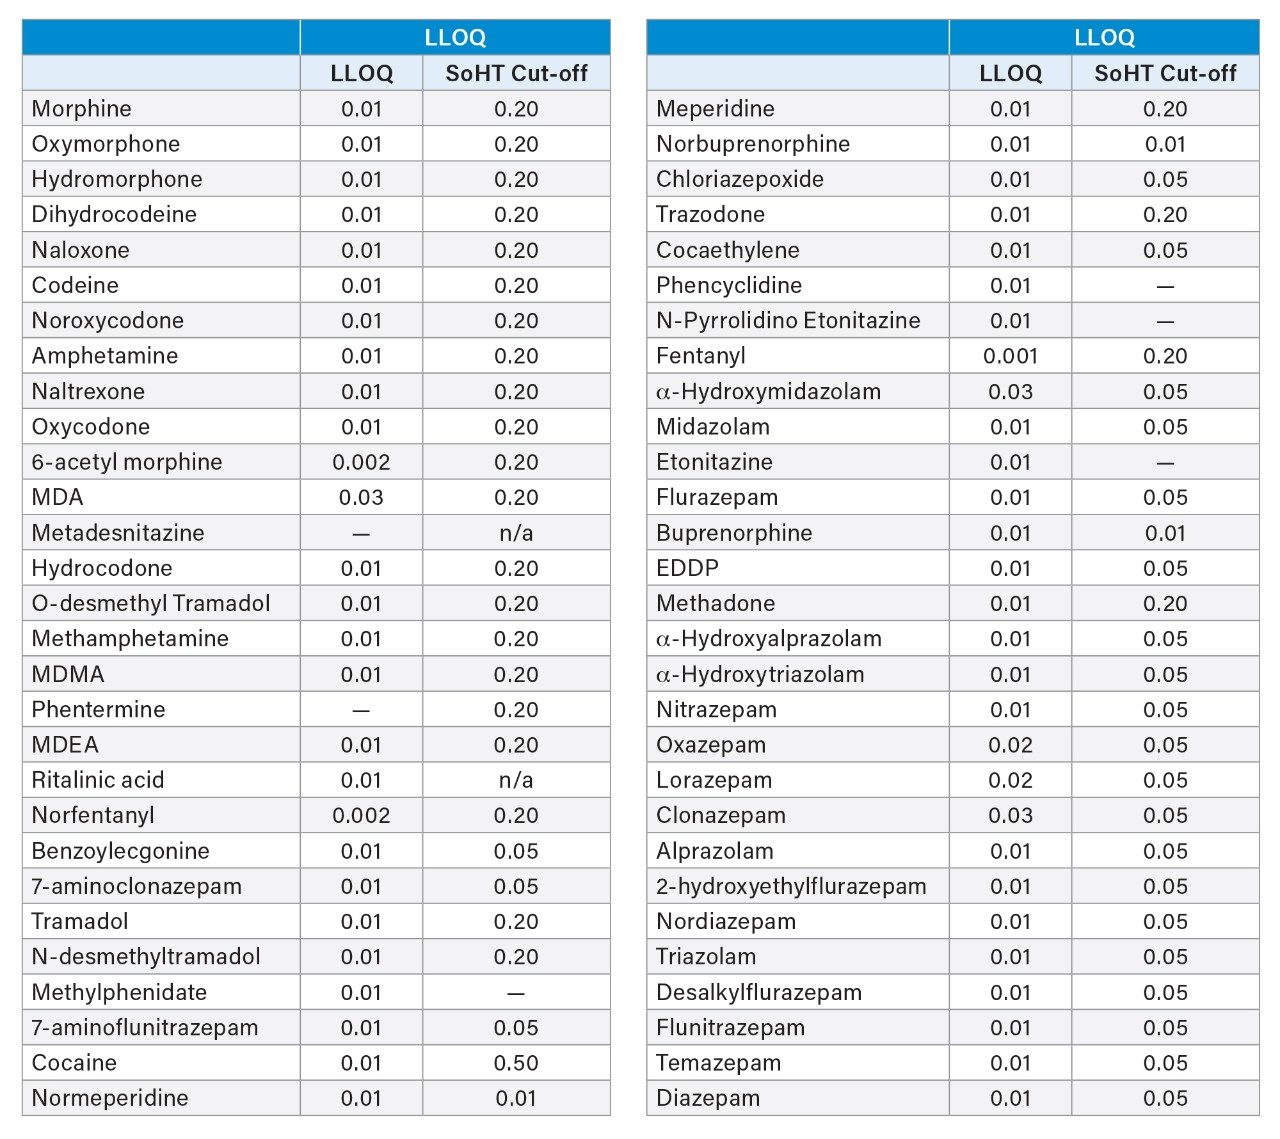
Functional sensitivity was assessed by extracting 10 replicates at nominal concentrations of 0.01 and 0.02 ng/mg. Lower limits of quantification (LLOQ) were those at which accuracy was within 20% and %CVs were also less than 20%. The results of these experiments are shown in Table 1. For those analytes that did not meet the requirements at 0.01 or 0.02 ng/mg, the low QC was used as a LLOQ. This included MDA, α-OH midazolam and clonazepam. All compounds met the SoHT requirements for sensitivity except for phentermine, which lacked a labelled internal standard and was subject to endogenous interferences. LLOQ values for fentanyl, 6-AM and norfentanyl were correspondingly lower due to their lower calibration ranges.
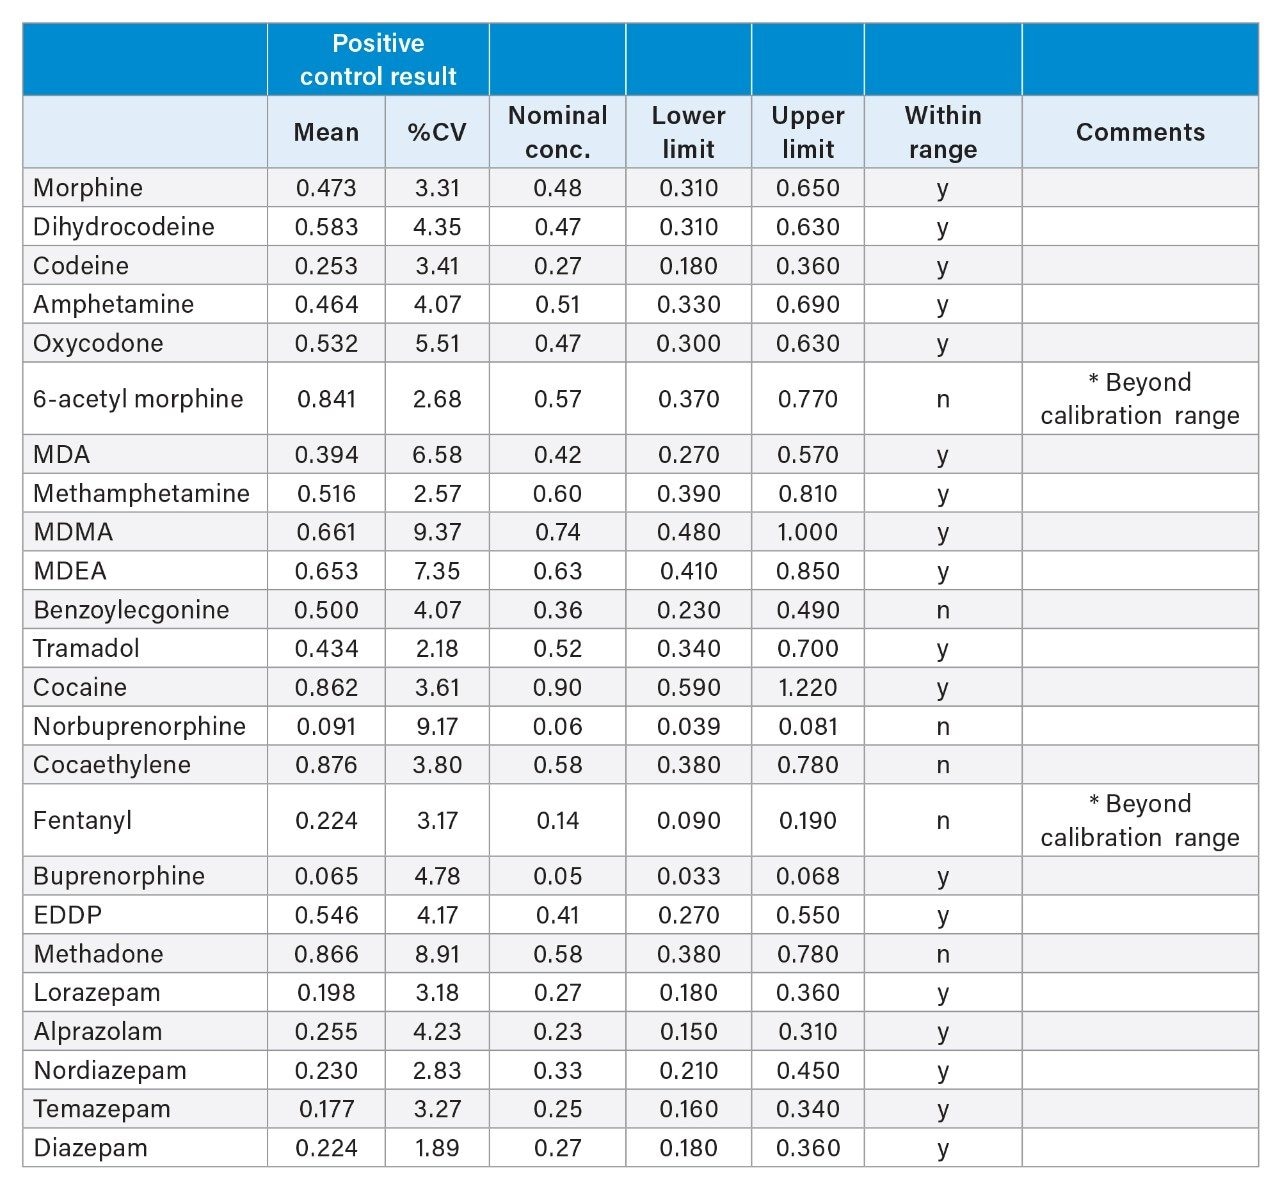
True accuracy was assessed using external positive control samples from Comedical. These samples had known concentrations of drugs incorporated into the hair matrix as well as established acceptance windows. The results are shown in Table 2. Coefficients of variance were excellent, with all under 10%. Of the compounds included, 18/24 (75%) were within the acceptance criteria established by the manufacturer. The values in the EQA samples were beyond the calibration range of 6-AM and fentanyl, which had upper quantitation limits of 0.2 and 0.1 ng/mg, respectively. Excluding those two, 18/22 (82%) of the compounds met the acceptance criteria. These samples had been prepared by spiking bulk hair with analytes followed by extensive mixing, versus actual hair samples with incorporated drugs. Nevertheless, the comparison is quite favorable.
Conclusion
We have developed an optimized procedure for the analysis of a comprehensive drug panel in hair samples that meets the requirements of SoHT for sensitivity. The extraction was optimized to accommodate a wide variety of compounds including amine stimulants, natural and synthetic opioids, benzodiazepines and other common drugs of abuse. The Oasis MCX 96-well plates resulted in consistent recoveries and well controlled matrix effects. The chromatographic method was rapid, with all peaks eluting by 3.1 minutes while achieving baseline separation from potential interfering isomers. The Xevo TQ Absolute Triple Quadrupole Mass Spectrometer resulted in quantitative results that were accurate and precise over the entire calibration range, meeting the SoHT sensitivity requirements for all the analytes, with only a couple of exceptions. External positive control samples confirmed the accuracy of the method with all compounds identified and >80% of compounds within the reference ranges. The combination of efficient sample preparation, rapid chromatography and accurate and precise quantification result in a method that can be used to accurately quantitate a variety of drugs in hair samples.
Appendix 1
Appendix 2
Appendix 3
References
- G.A.A. Cooper, R. Kronstrand, P. Kintz. Society of Hair Testing Guidelines for Drug Testing in Hair. Forensic Science International 281 (2012) 20–24.
- Statements of the Society of Hair Testing Concerning the Examination of Drugs in Human Hair [cited 14th Aug 2024]. Available from: https://www.soht.org/statements
- J. Hu, H. Chen, et al. Pulverization is a crucial step – A Comparative Study of Different Pretreatments in Hair Drug Testing. Journal of Analytical Toxicology, 47 (2023) 346–352.
|
Ionization mode |
Electrospray Ionization (ESI) Adjustment-free high performance ZSpray™ dual-orthogonal atmospheric pressure ionization electrospray interface for robustness and reliability. Integrated adjustment-free plug-and-play probe for reduced dispersion and reliability |
|
Mass analyzer |
The instrument is equipped with a high resolution, high stability Tof mass analyzer |
|
Vacuum system |
A fully automated and differentially pumped vacuum system comprising of an air-cooled split-flow turbo pump and one rotary backing pump |
|
Scan speed |
1 to 20 Hz |
|
Acquisition modes |
Full scan (MS) Full scan with fragmentation (data independent acquisition) |
|
Mass range |
Positive ion: 50–2000 or 400–7000 m/z Negative ion: 50–2000 or 400–5000 m/z |
|
Mass measurement accuracy |
RMS error <2.5 ppm measured using consecutive repeat measurements of sodium and rubidium iodide, with Lock Mass correction |
|
Mass scale calibration accuracy |
<1 ppm with internal Lock Mass correction over range 50 to 2,000 m/z |
|
Mass resolution |
>10,000 FWHM measured on a singly charged ion between 550 and 650 m/z. The instrument will be tuned using the automated setup and calibration routine |
|
Positive ion MS sensitivity |
Intensity ≥22,000 ions/counts per second, measured from the peak at m/z 556.28 from a solution of 150 pg/µL leucine enkephalin + 500 pg/µL caffeine + 100 pg/µL pentane |
|
Negative ion MS sensitivity |
Intensity ≥13,750 ions/counts per second, measured from the peak at m/z 554.26 from a solution of 150 pg/µL leucine enkephalin + 500 pg/µL caffeine + 100 pg/µL pentane |
|
Chromatographic dynamic range |
The dynamic range is ≥4 orders of magnitude measuring replicate UPLC injections of lidocaine, monitoring the ion at m/z 235 |
|
Regulatory approvals/marks |
CE, CB, NRTL (CAN/US), RCM |
|
Software |
Systems supported in waters_connect Software version 1.9.12. |
|
Health System |
The ACQUITY RDa Detector has an automated instrument set-up and calibration routine for consistent results between users of all experience levels. The ACQUITY RDa Detector monitors instrument performance from run-to-run to ensure high quality data and increased confidence in your results. If a fault occurs, the software will display information that provides step-by-step guidance to fix the fault. |
|
Ionization mode |
Electrospray Ionization (ESI) |
|
Adjustment-free high performance ZSpray™ dual-orthogonal atmospheric pressure ionization electrospray interface for robustness and reliability. Integrated adjustment-free plug-and-play probe for reduced dispersion and reliability |
|
|
Mass analyzer |
The instrument is equipped with a high resolution, high stability Tof mass analyzer |
|
Vacuum system |
A fully automated and differentially pumped vacuum system comprising of an air-cooled split-flow turbo pump and one rotary backing pump (oil free pump option available) |
|
Scan speed |
1 to 20 Hz |
|
Acquisition modes |
Full scan (MS) |
|
Full scan with fragmentation (data independent acquisition) |
|
|
Mass range |
Positive ion: 50–2000 or 400–9000 m/z |
|
Negative ion: 50–2000 or 400–5000 m/z |
|
|
Mass measurement accuracy |
RMS error <2.5 ppm measured using consecutive repeat measurements of sodium and rubidium iodide, with Lock Mass correction |
|
Mass scale calibration accuracy |
<1 ppm with internal Lock Mass correction over range 50 to 2,000 m/z |
|
Mass resolution |
>10,000 FWHM measured on a singly charged ion between 550 and 650 m/z. The instrument will be tuned using the automated setup and calibration routine |
|
Positive ion MS sensitivity |
Intensity ≥22,000 ions/counts per second, measured from the peak at m/z 556.28 from a solution of 150 pg/µL leucine enkephalin + 500 pg/µL caffeine + 100 pg/µL pentane |
|
Negative ion MS sensitivity |
Intensity ≥13,750 ions/counts per second, measured from the peak at m/z 554.26 from a solution of 150 pg/µL leucine enkephalin + 500 pg/µL caffeine + 100 pg/µL pentane |
|
Chromatographic dynamic range |
The dynamic range is ≥4 orders of magnitude measuring replicate UPLC injections of lidocaine, monitoring the ion at m/z 235 |
|
Regulatory approvals/marks |
CE, CB, NRTL (CAN/US), RCM |
720008769, June 2025