Extended Gradients with Efficient Protein A Columns for the ProA-MS Analysis of mAb and msAb Variants
Stephan M. Koza, Chen Gao, Matthew A. Lauber, Stephen J. Shiner
Waters Corporation, United States
Published on October 23, 2025
Abstract
Here, we present studies using extended elution gradients with a high-efficiency Protein A (ProA) affinity column (Waters™ BioResolve™ Protein A Affinity Column, MaxPeak™ Premier, 3.5 µm, 2.1 x 20 mm) and a high-resolution mass spectrometer (HRMS, Xevo™ G3™ Q-Tof Mass Spectrometer) for the ProA-MS analysis of a monoclonal antibody (mAb) and multispecific antibody (msAb) directly from clarified cell culture filtrate samples (CCCF). Additionally, in combination with 280 nm UV absorbance data (A280), product titer and relative abundance information for separated variants were determined. The LC-MS method employed ammonium acetate (AMA) and formic acid mobile phases at a low flow rate to allow for direct connection to a QTof Mass Spectrometer, thereby facilitating low-level oxidation analysis of a mAb (NISTmAb) and the analysis of the heavy chain (HC) pairing of an intact mock msAb.
Briefly, these hyphenated ProA-MS methods can provide intact mAb and msAb characterization data, variant relative abundance measurements, and titer information. Additionally, correlations between variations in primary structure, post-translational modifications (PTM) and product degradation can also be readily investigated.
Benefits
- ProA-MS extended elution gradients for the separations of mAb and msAb variants
o Intact mass high-resolution MS identification of separated variants
o A280 determination of titer and variant relative abundances - Direct analysis of CCCF samples
Introduction
Analytical methods that enable the rapid structural evaluation of monoclonal antibodies mAb, msAb, and fusion proteins are sought after throughout the multiple stages of biopharmaceutical development. One such approach is ProA-MS for the direct analysis of CCCF samples.1-3 It has also been demonstrated that the differential dissociation of ProA bound mAb variants can be used analytically when using pH gradient elution.4 In this study, the impact of using high efficiency affinity columns is evaluated along with extended gradient elution methods for ProA-MS analyses.
In prior studies, we demonstrated the value of the minimal elution peak volumes generated when using a high-efficiency nonporous 3.5 µm, 2.1 X 20 mm ProA column in 2D ProA-SEC analyses.5,6 Since the efficiency of this column format would also potentially provide improved pH gradient separations of mAb variants that dissociate differentially from ProA, we evaluated a mock msAb and NISTmAb via ProA-MS as both a pure sample and spiked into CCCF. The mock msAb construct possessed identical Fab domains and a 2-point mutation in the heavy chain (HC) intended to modulate ProA binding affinity.
The primary focal points of this investigation were to evaluate the capability of these methods to identify intact variants by ProA-MS and to determine the linearity and recovery of sample components using A280 detection.
Experimental
Sample Descriptions
1. NISTmAb reference material, RM 8671 (10 mg/mL).
2. CHO clarified cell culture fluid (CCCF, clarified, 0.2 µm filtered, ~90 % viability, with ~0.035 mg/mL trastuzumab).
3. Mock msAb: IgG with 2-point mutation in one of the Fc domains (H338R, Y339F) to modulate ProA binding (1 mg/mL, supplied by absolute antibody, Redcar, UK).
LC Conditions
|
LC system: |
ACQUITY™ UPLC™ LC System with BSM™, FTN Sample Manager, and ACQUITY TUV (5 mm flow cell) |
|
Column: |
BioResolve Protein A Affinity Column, MaxPeak Premier, 3.5 µm, 2.1 x 20 mm (p/n: 186011369) |
|
Column temperature: |
Ambient |
|
Sample temperature: |
6 °C |
|
Injection volumn: |
10 µL or as indicated |
|
ProA loading mobile phase: |
100 mM ammonium acetate (LCMS grade) |
|
ProA elution mobile phase: |
200 mM formic acid (LCMS grade) |
|
Detector: |
TUV, 280 nm |
|
Data management: |
UNIFI™ and waters_connect™ Software Platform |
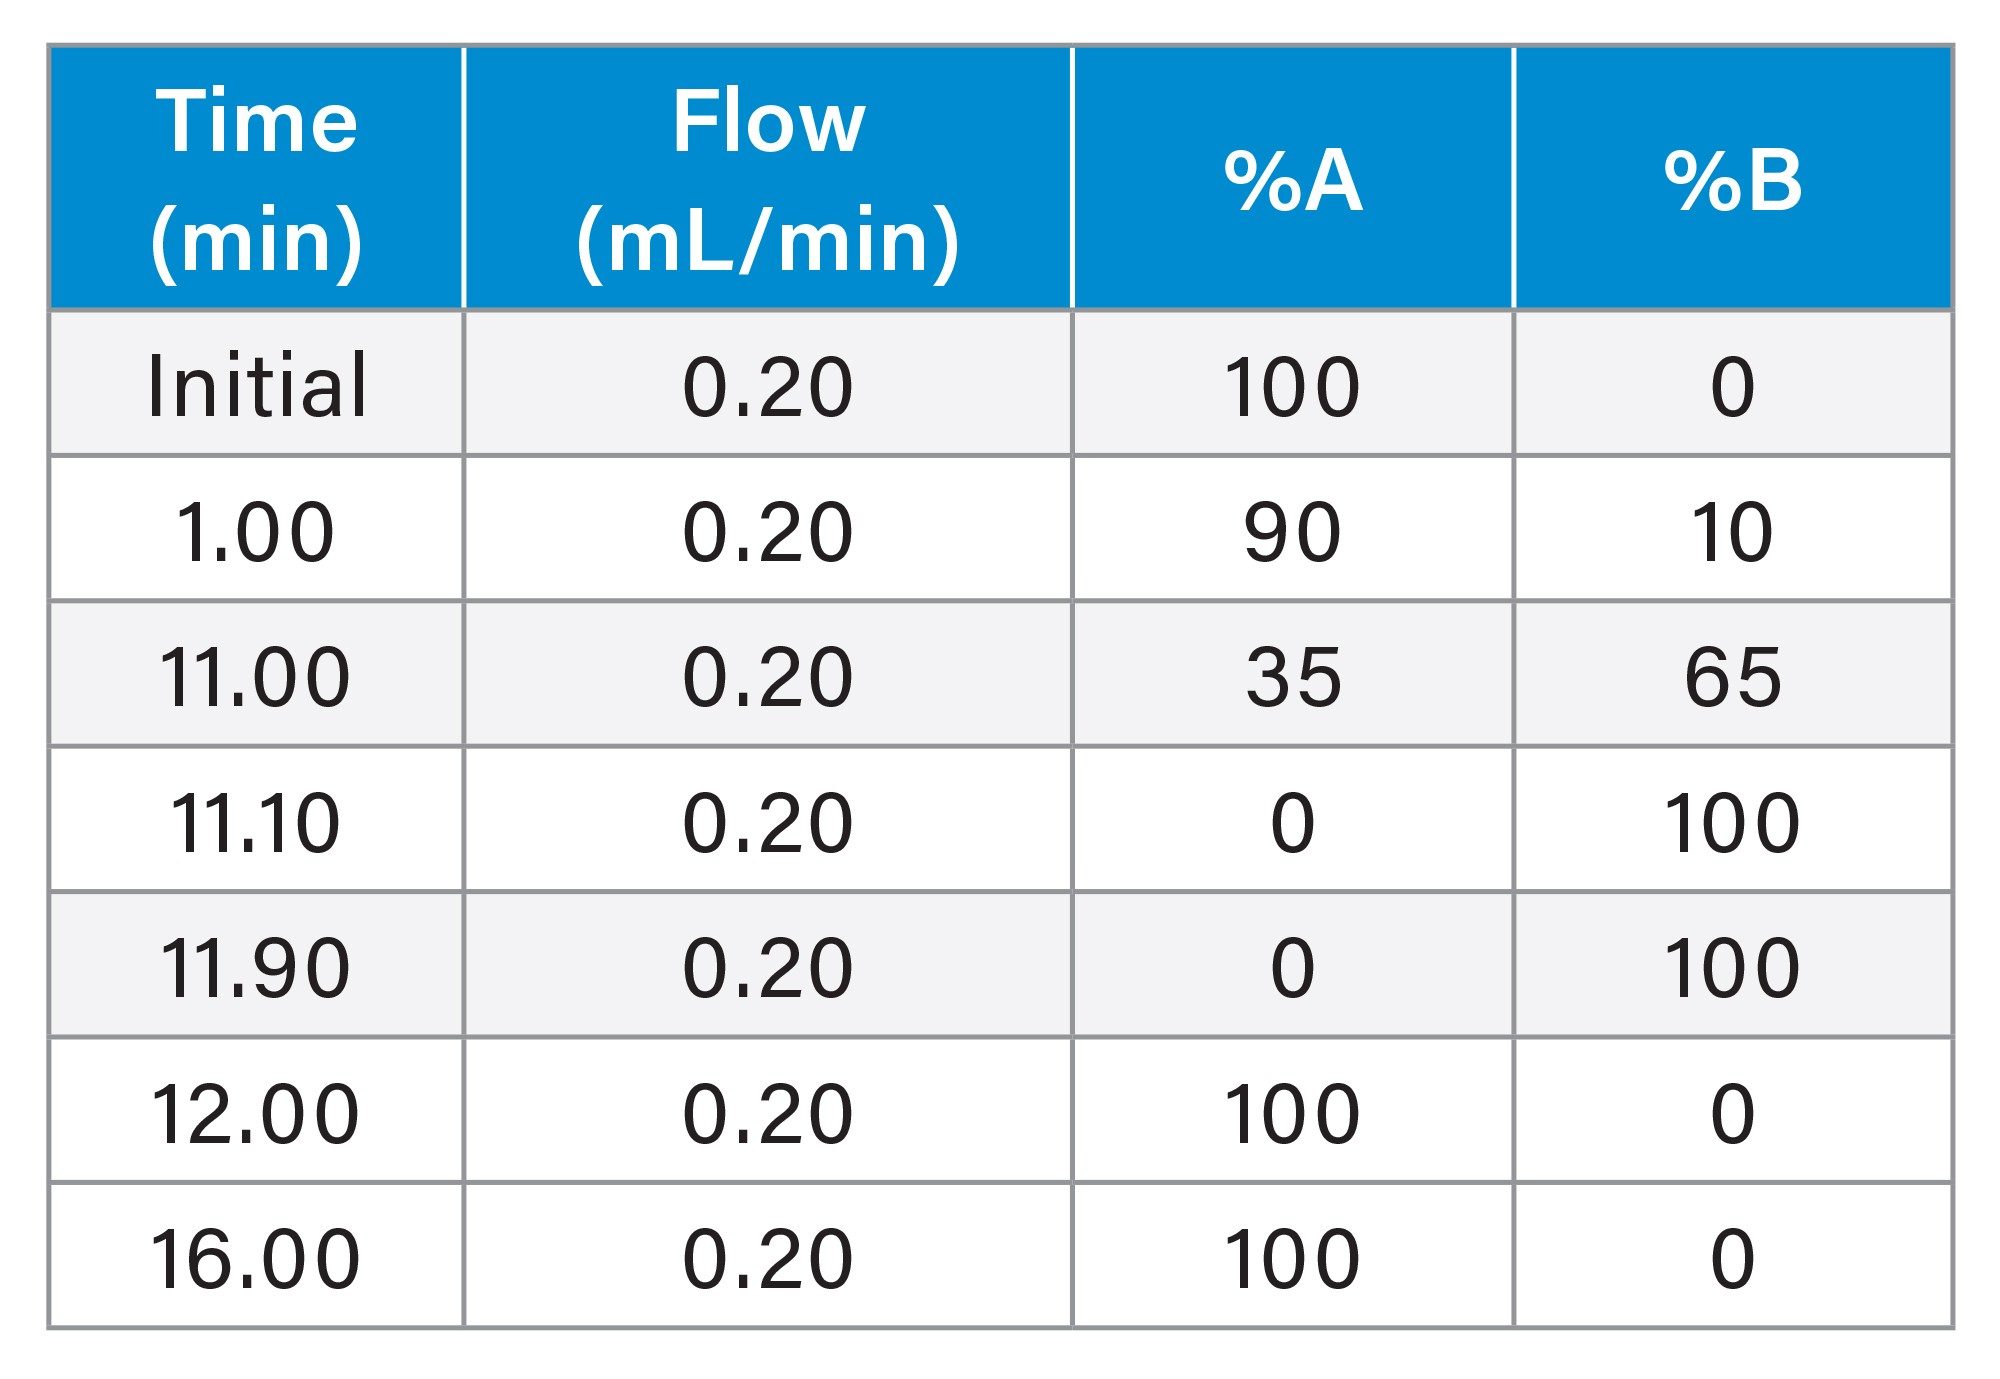
ProA msAb Gradient
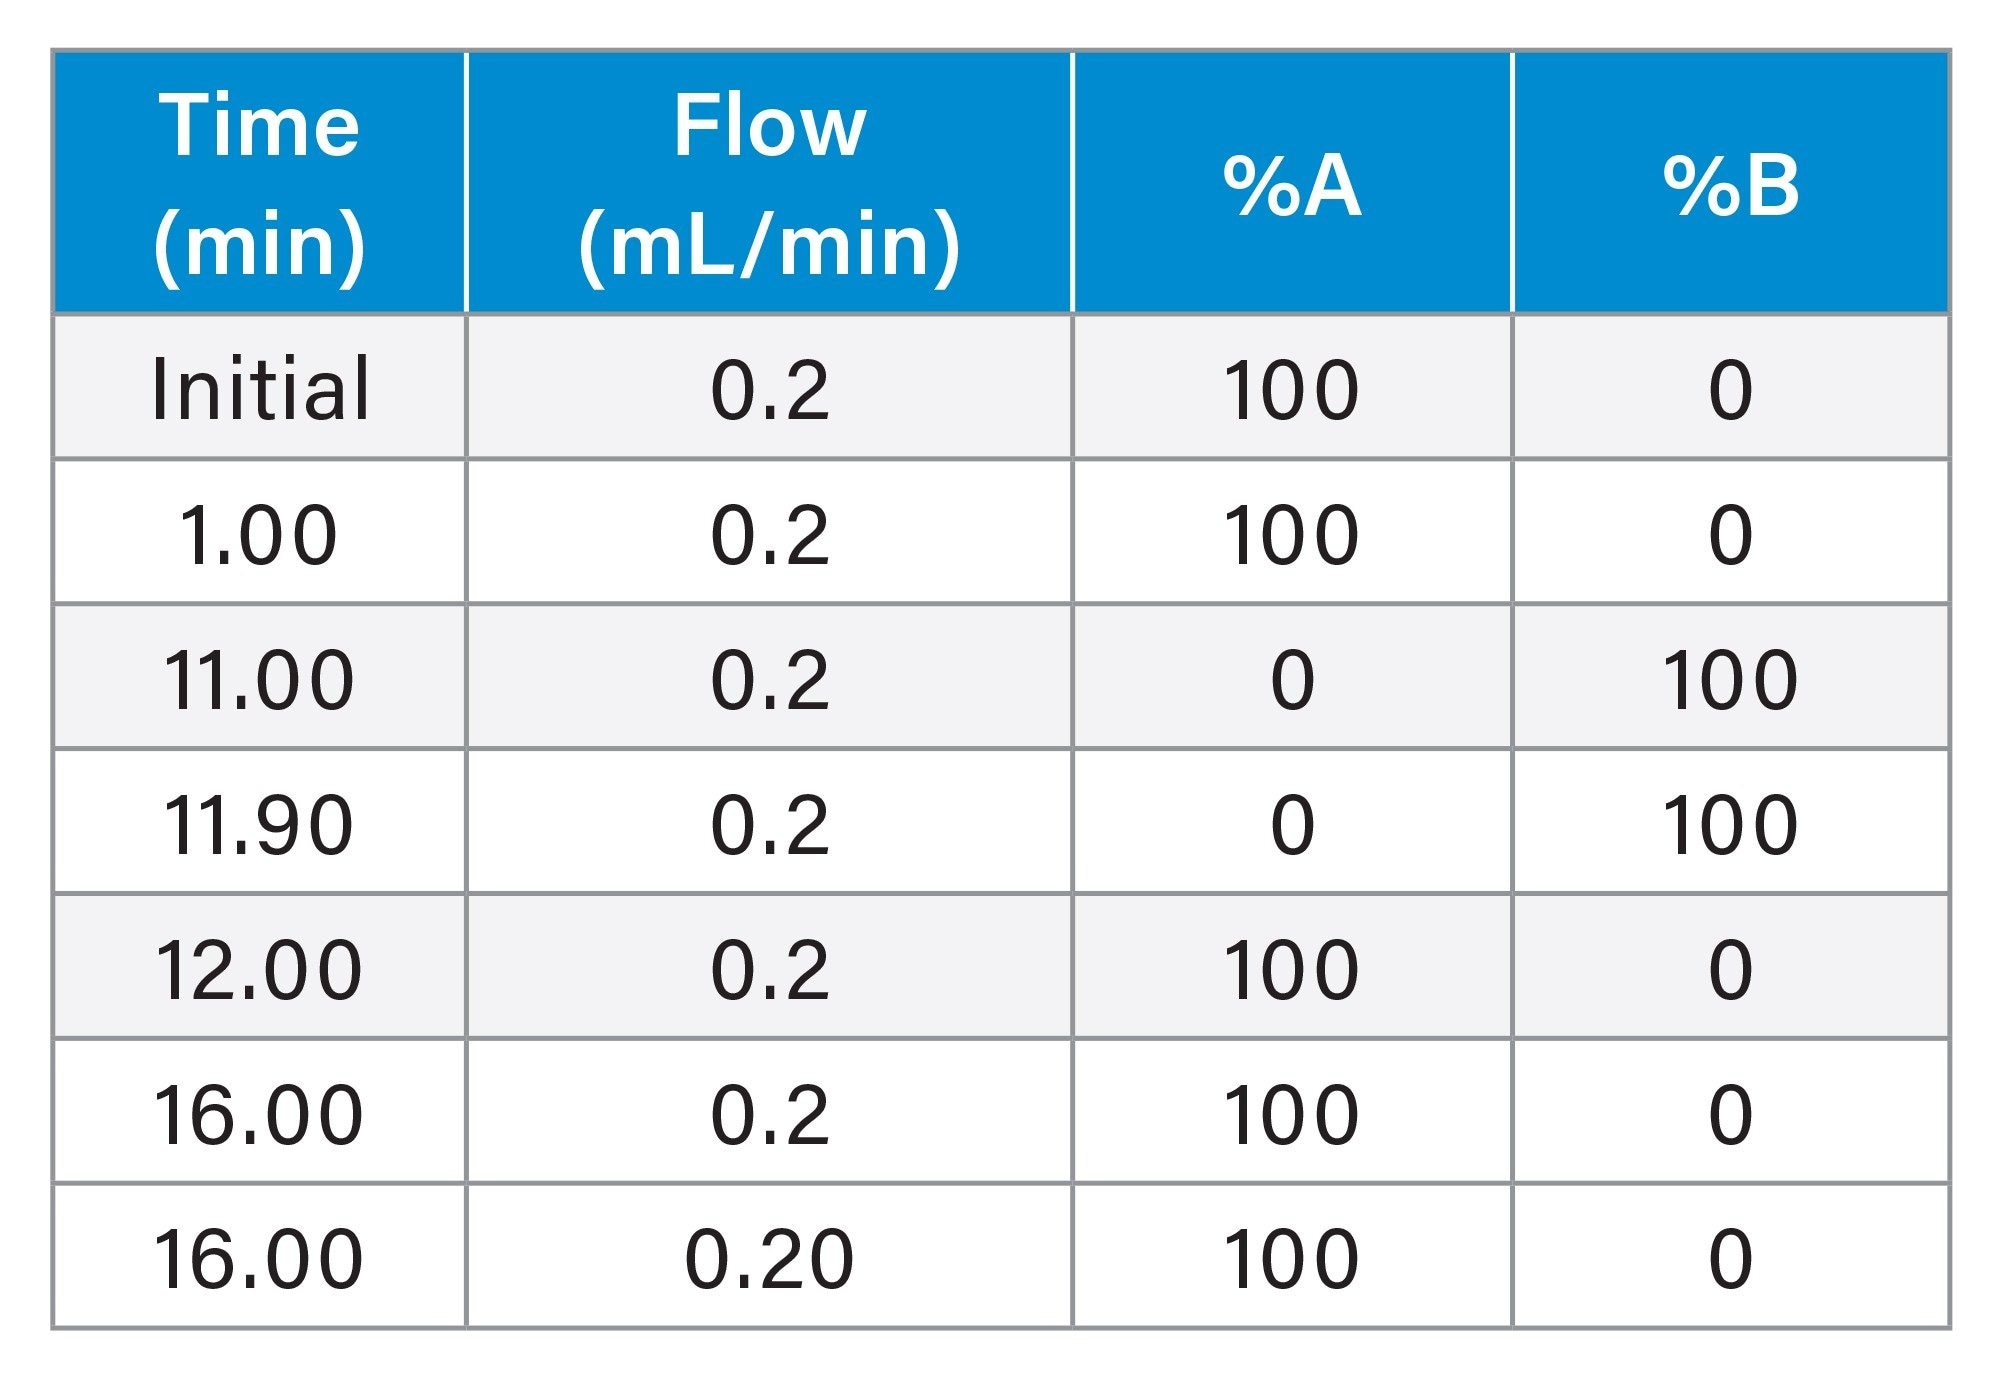
ProA NISTmAb Gradient
Xevo G3 QTof Mass Spectrometer Parameters
|
Low mass: |
400 m/z |
|
High mass: |
8000 m/z |
|
Scan time: |
1.000 s |
|
Collision energy mode: |
Off (6V) |
|
Intelligent data capture threshold: |
Custom (1) |
|
Source temperature: |
120 °C |
|
Desolvation temperature: |
500 °C |
|
Cone gas: |
50 L/h |
|
Desolvation gas: |
600 L/h |
|
Capillary voltage: |
2.00 kV |
|
Sample cone voltage: |
150 V |
|
Data collection and analysis: |
UNIFI and waters_connect Software Platform |
Results and Discussion
NISTmAb Oxidation
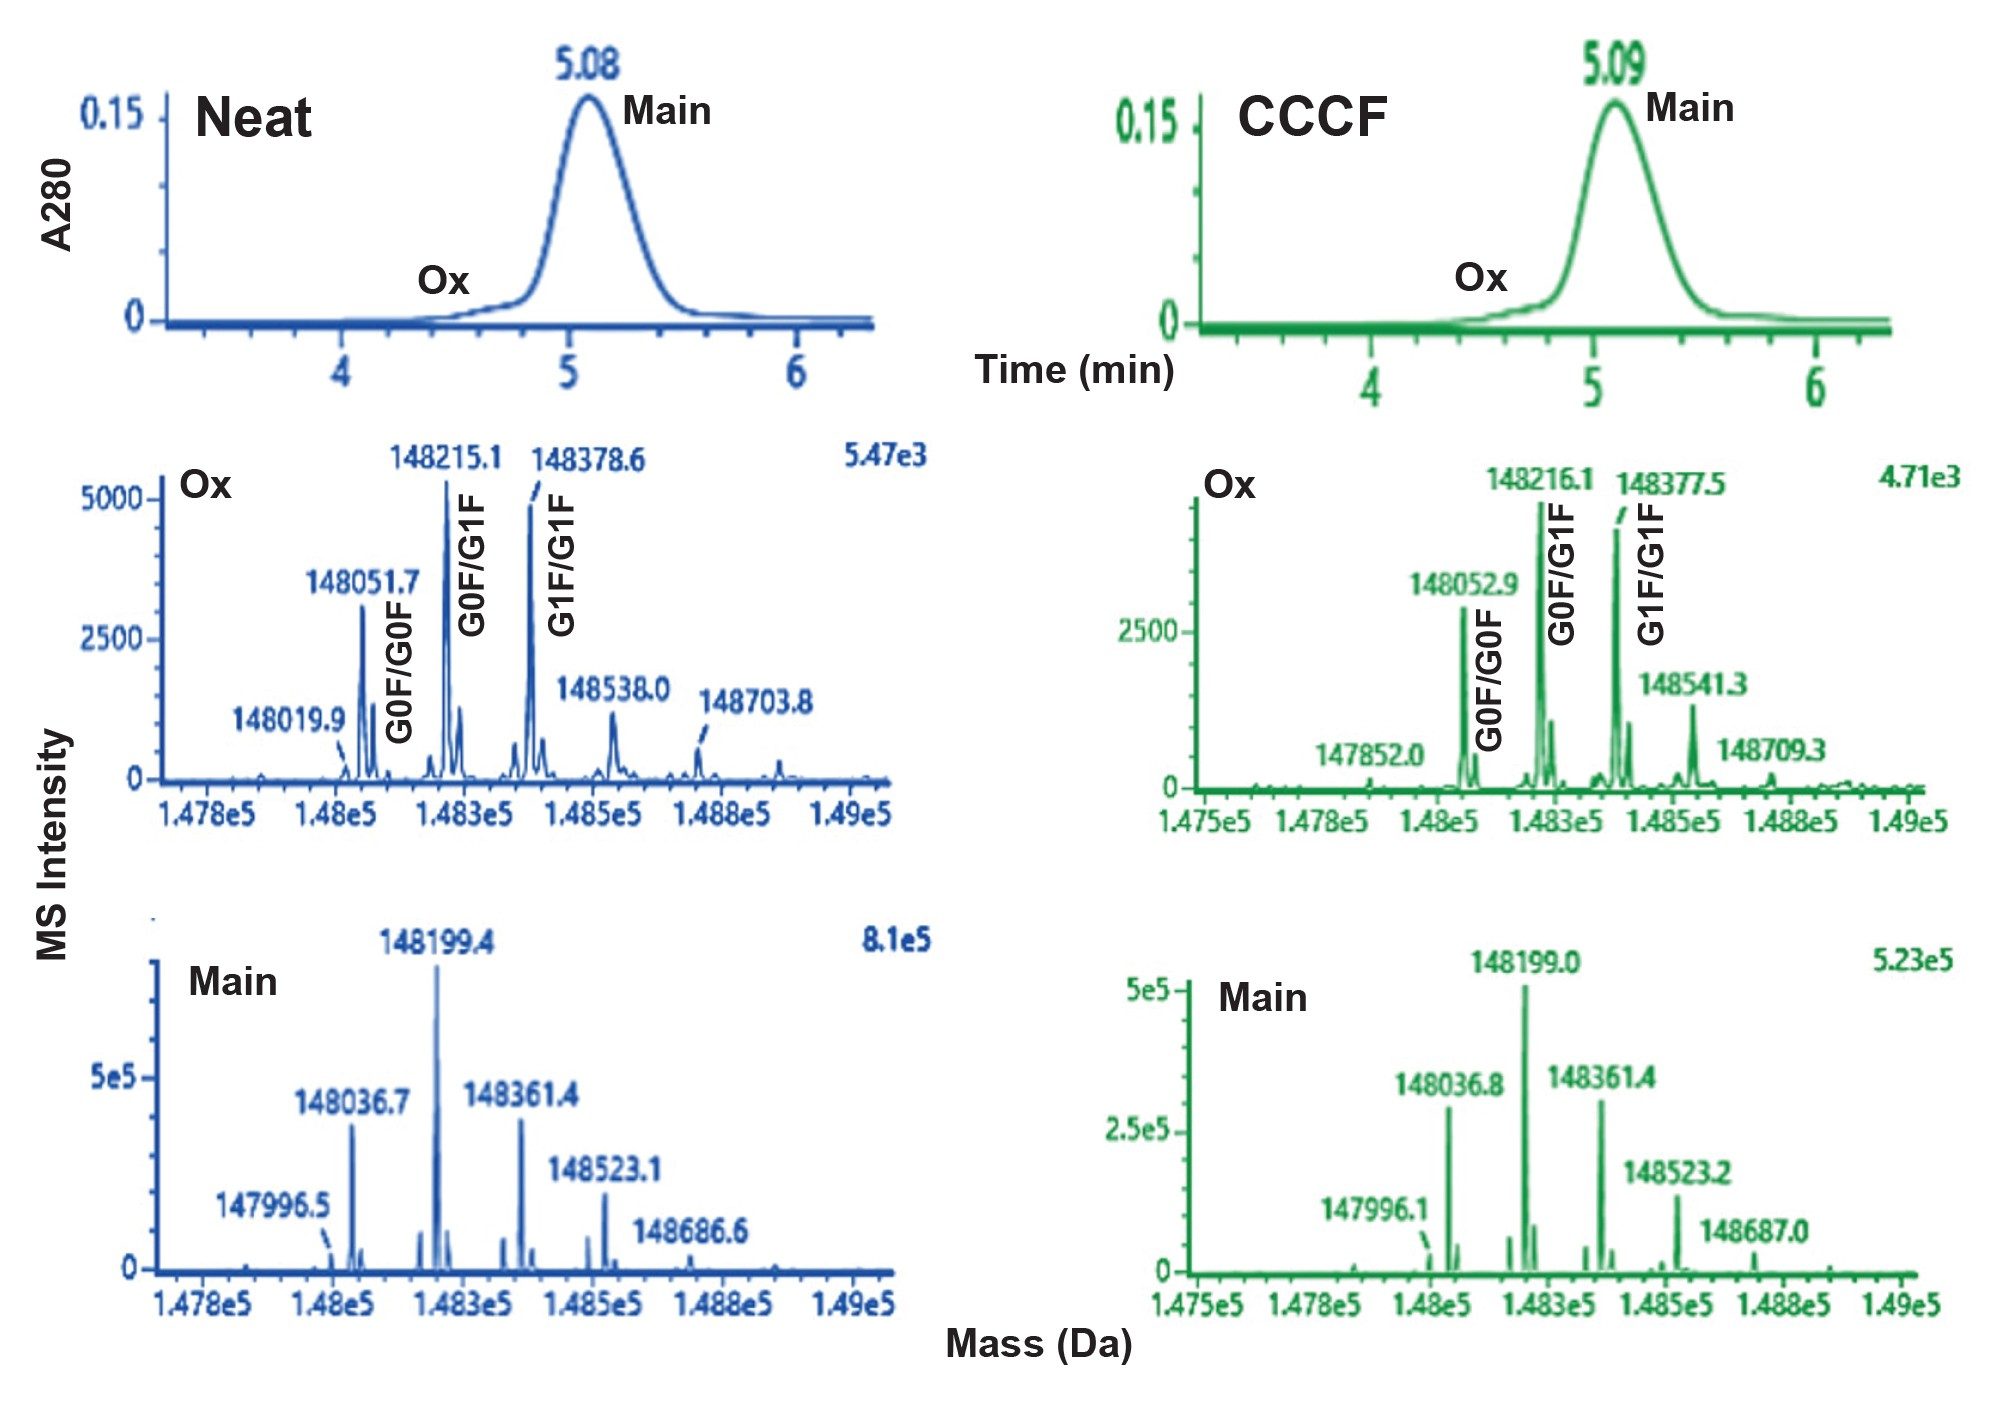
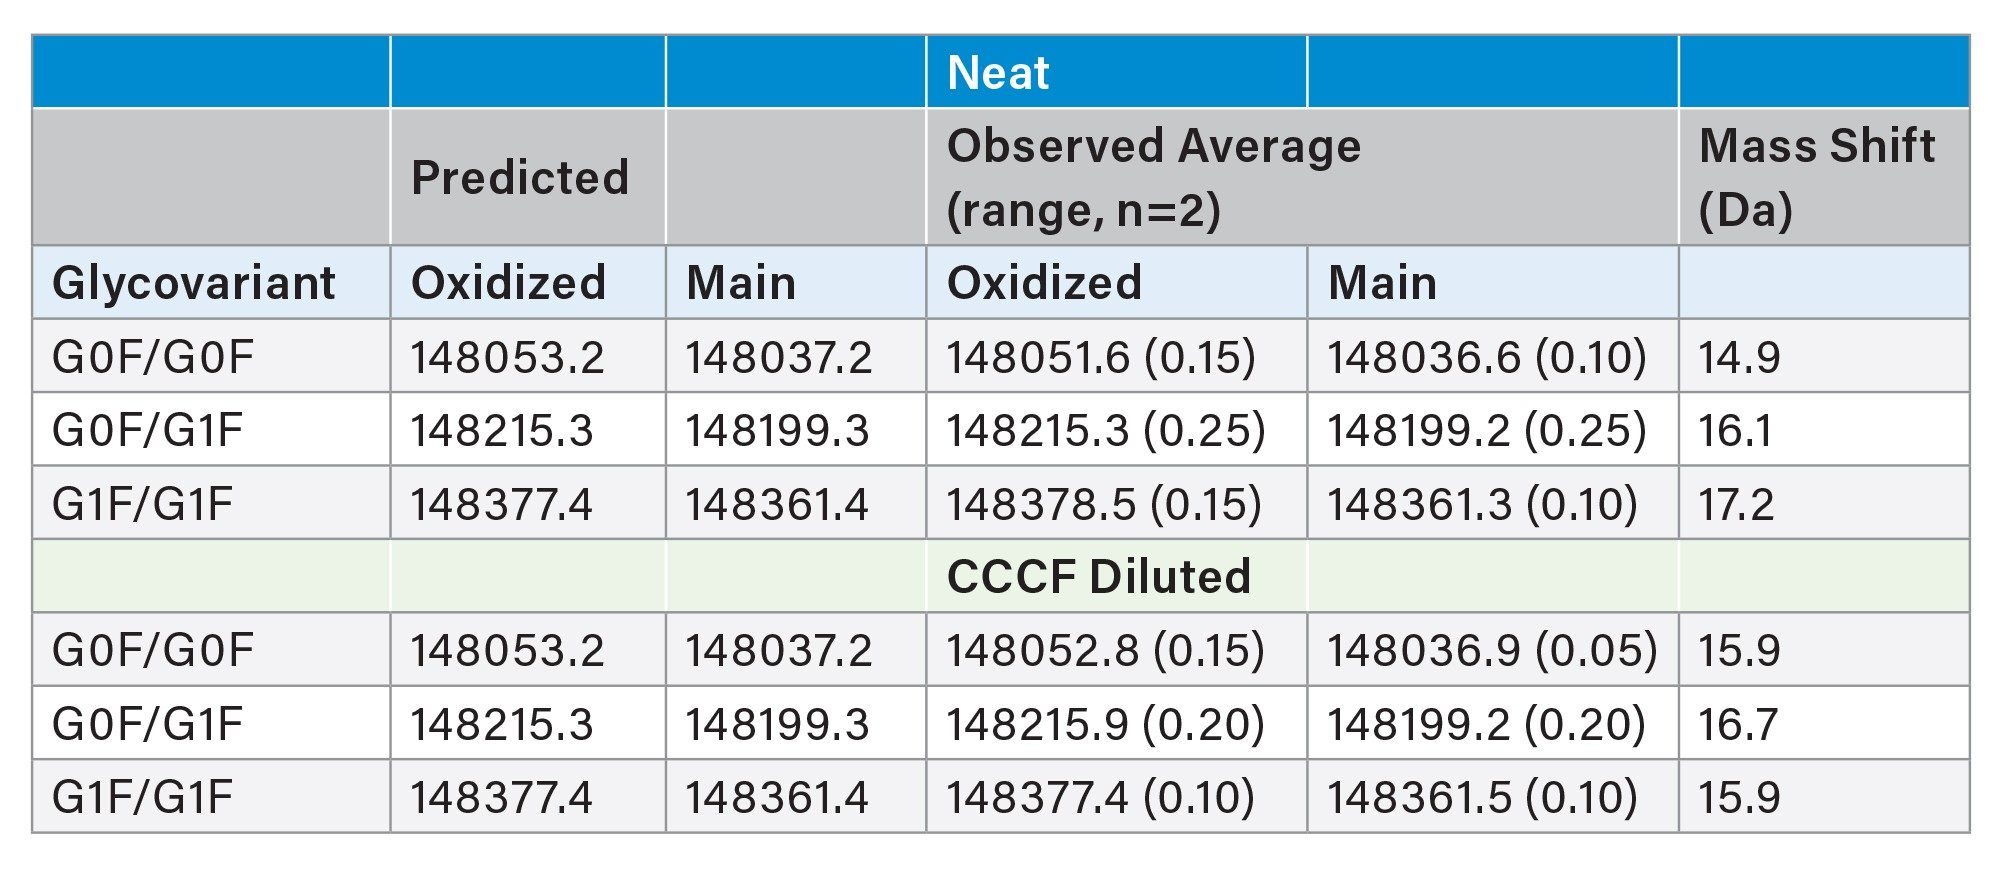
The chromatograms obtained from an extended gradient ProA-MS analysis of NISTmAb highlight the separation of a low abundance early eluting variant (Figure 1). These results were generated using MS-compatible mobile phases (see Experimental) and an MS-friendly flow rate of 0.20 mL/min. These conditions were selected to provide effective binding and elution along with minimal analysis time while not significantly compromising MS performance. As presented in Table 1, the MS results for both a neat NISTmAb sample and a sample generated by diluting NISTmAb 1:9 with CCCF indicate that the early eluting peak has a predominant mass consistent with oxidation (Δ +16 Da). Comparable results were observed for both the neat and CCCF diluted samples. These results are in line with published reports noting that oxidation of the methionine residues associated with the ProA binding site of the Fc domain (M255 and M431 for NISTmAb) can significantly alter ProA elution.4
Also of note, a subtle shift in N-glycan distribution was observed for the oxidized NISTmAb. While suggestive of a correlation between N-glycan galactosylation and the propensity of methionine oxidation in the ProA binding site of the Fc domain, further studies would be required to confirm such a link. Nonetheless, this observation highlights the potential benefits of considering the use of extended gradient and HRMS ProA-MS characterization methods. In addition, similar benefits may also be realized for alternative affinity based gradient separations.
Based on integration of the A280 chromatograms, the level of the oxidized degradant in the NISTmab sample tested was between 1.2% and 1.4%, as determined from a range of sample loads (2 – 10 µg). It is noteworthy that useful MS spectra were obtainable even for this low abundance degradant using the described ProA-MS method.
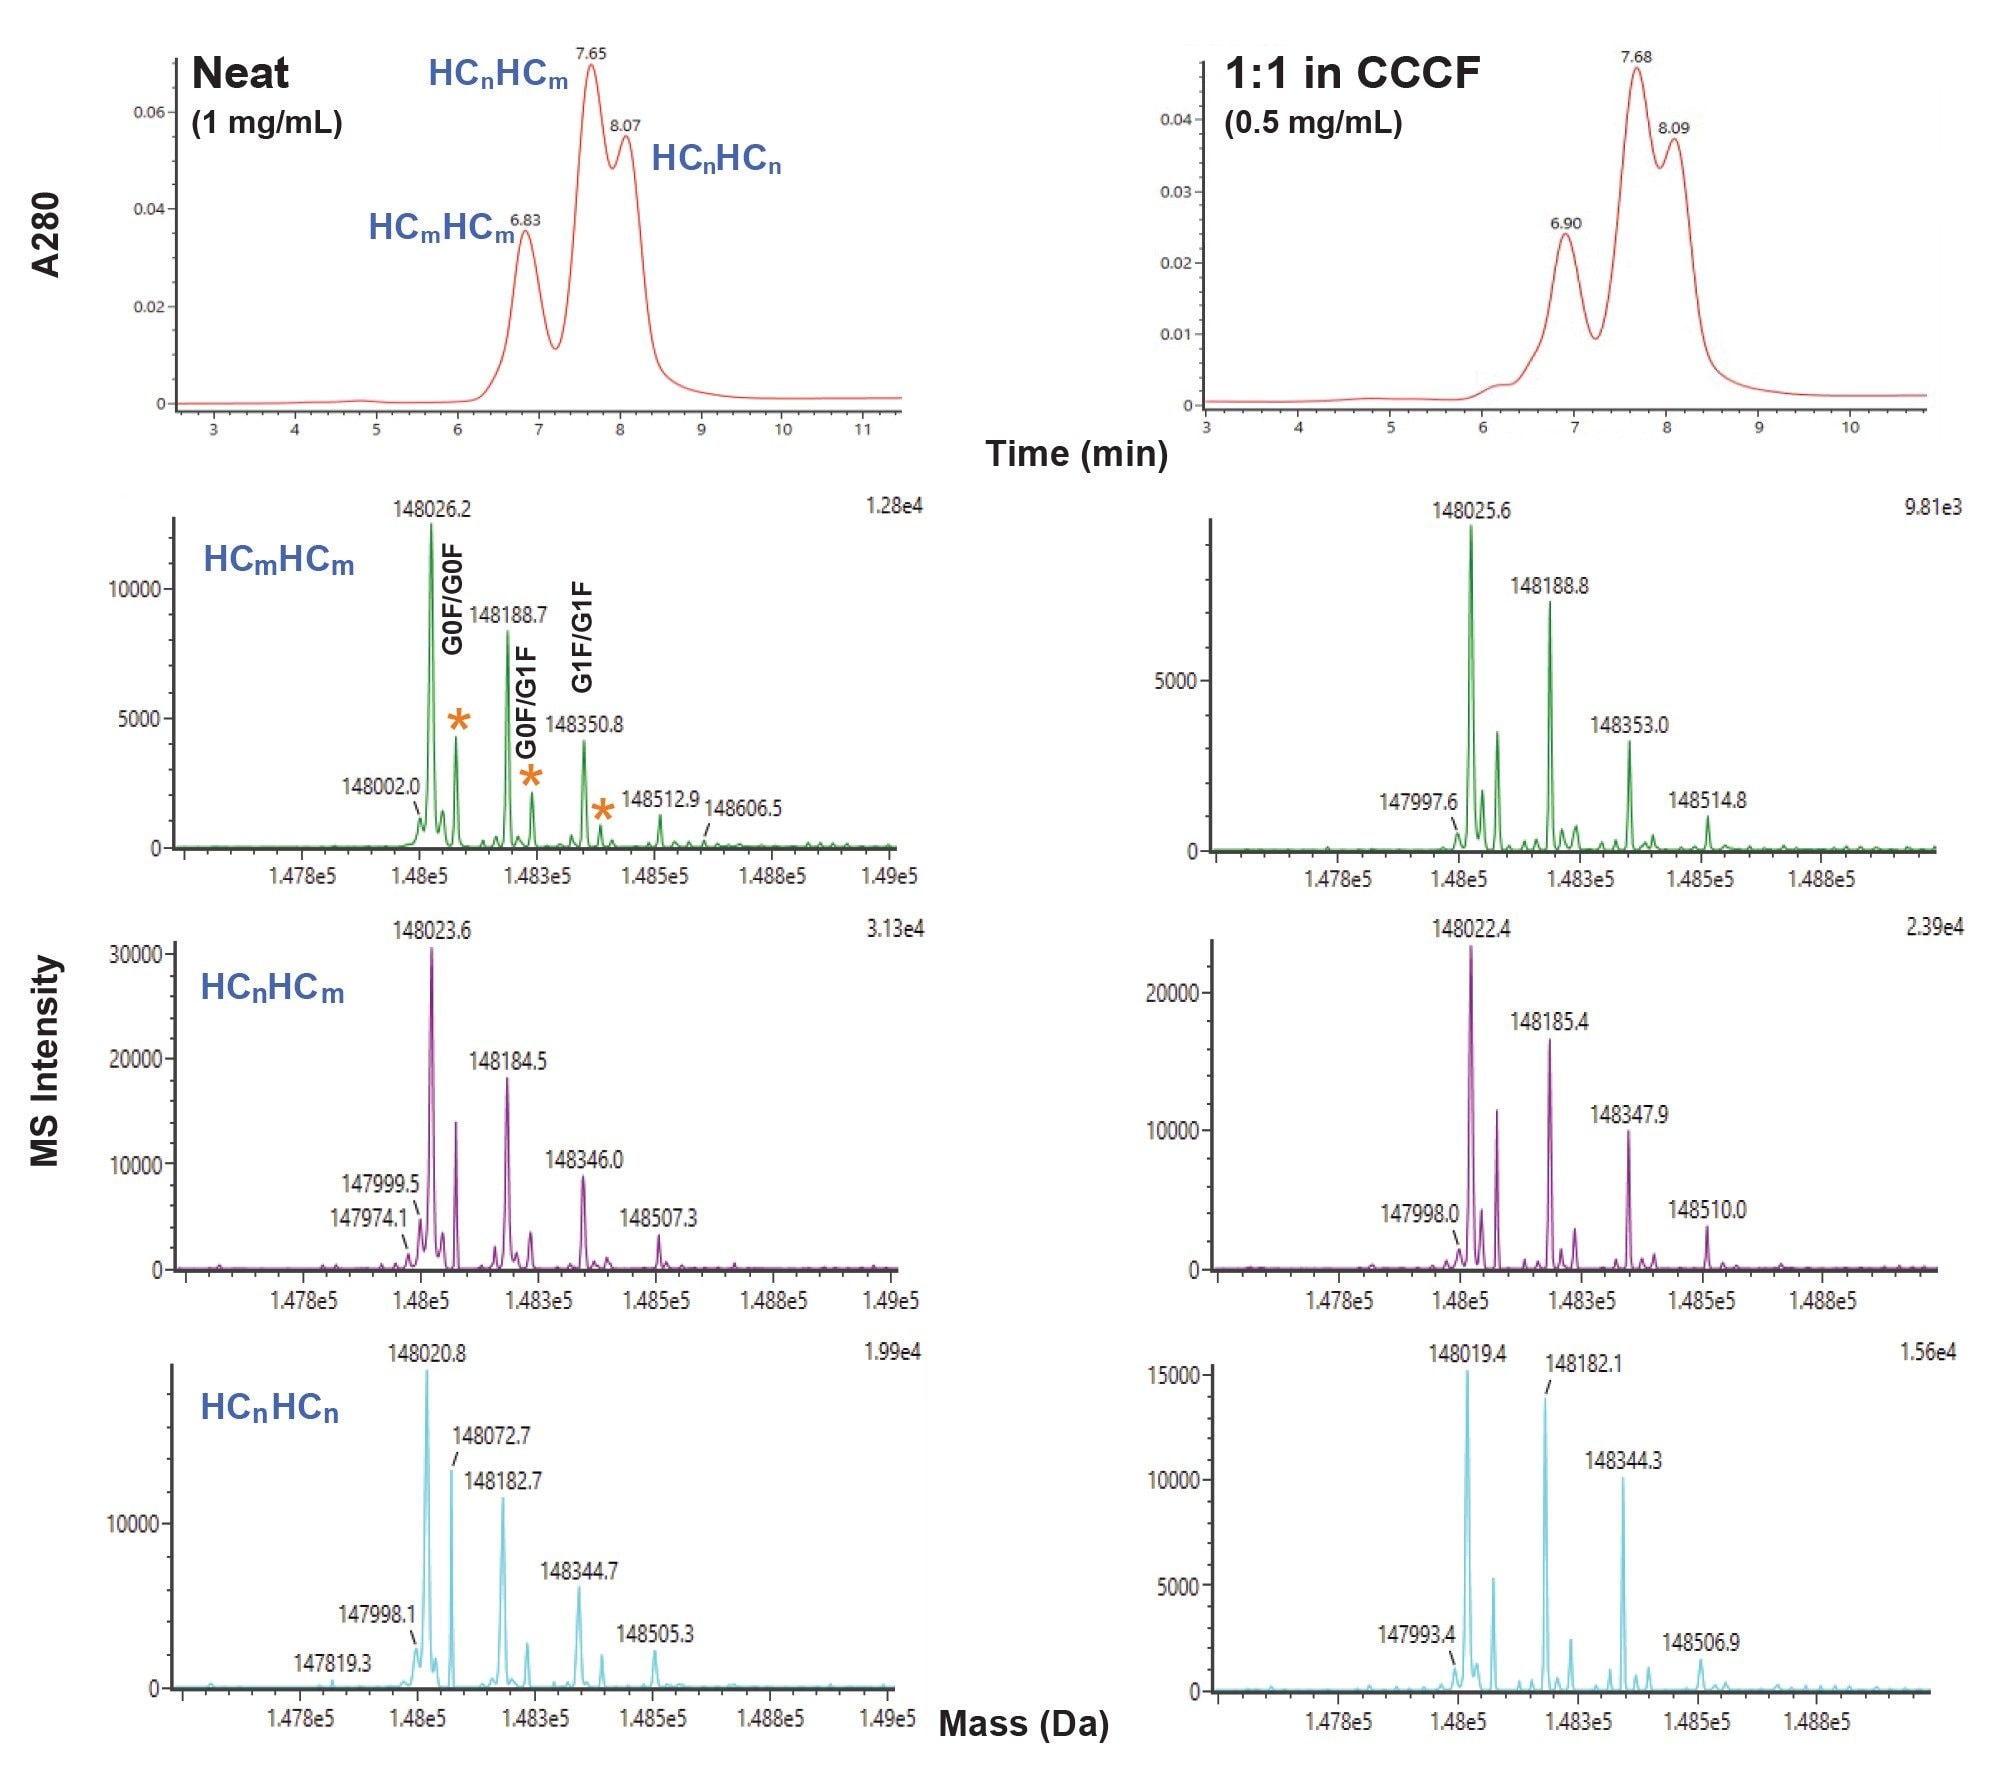
msAb HC Pairing
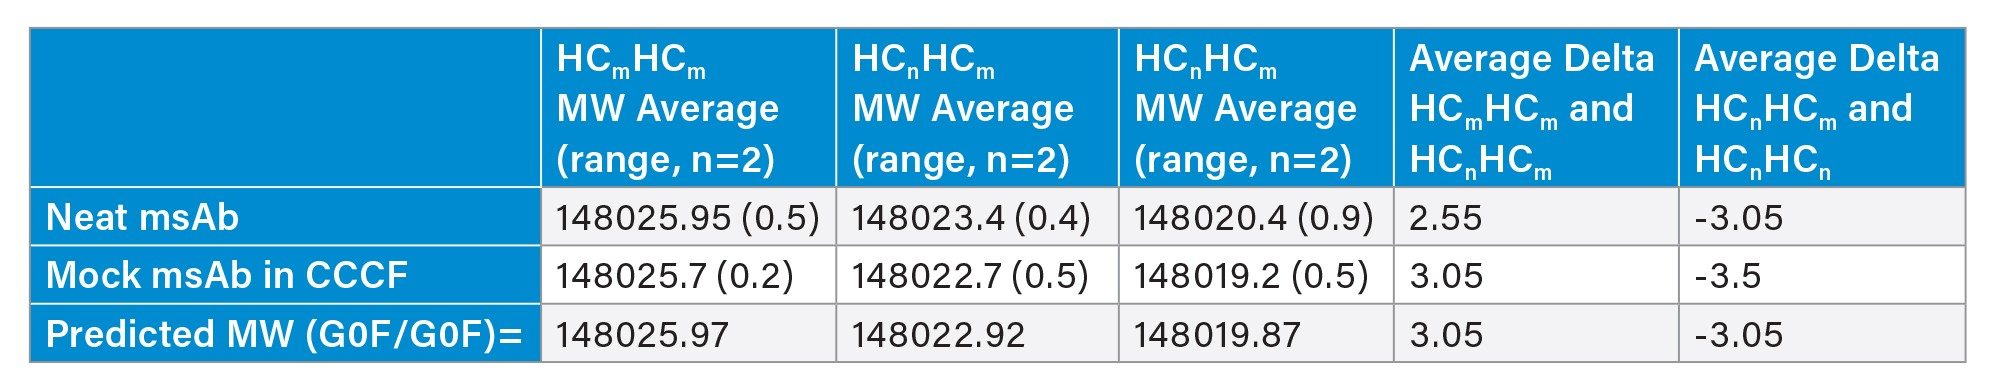
ProA-MS analysis of a mock msAb targeted to possess one native sequence HC (HCn) and one mutated HC (HCm), wherein the ProA affinity of HCm is known to be partially attenuated was performed. The mass shift for this HC 2-point mutation is 3.05 Da (see Experimental). The gradient used for this analysis was optimized to improve the separation of the three major forms observed with different HC pairings noted as HCmHCm, HCnHCm and HCnHCn (see Experimental). The mock msAb was analyzed both neat (1 mg/mL) and as a 1:1 dilution in CCCF. The intact LC-MS results are presented in Figure 2 and Table 2. Mass shifts for the variants that are consistent with the predicted 3.05 Da mass shift were observed. Additionally, consistent results were obtained when comparing the neat and CCCF diluted samples.
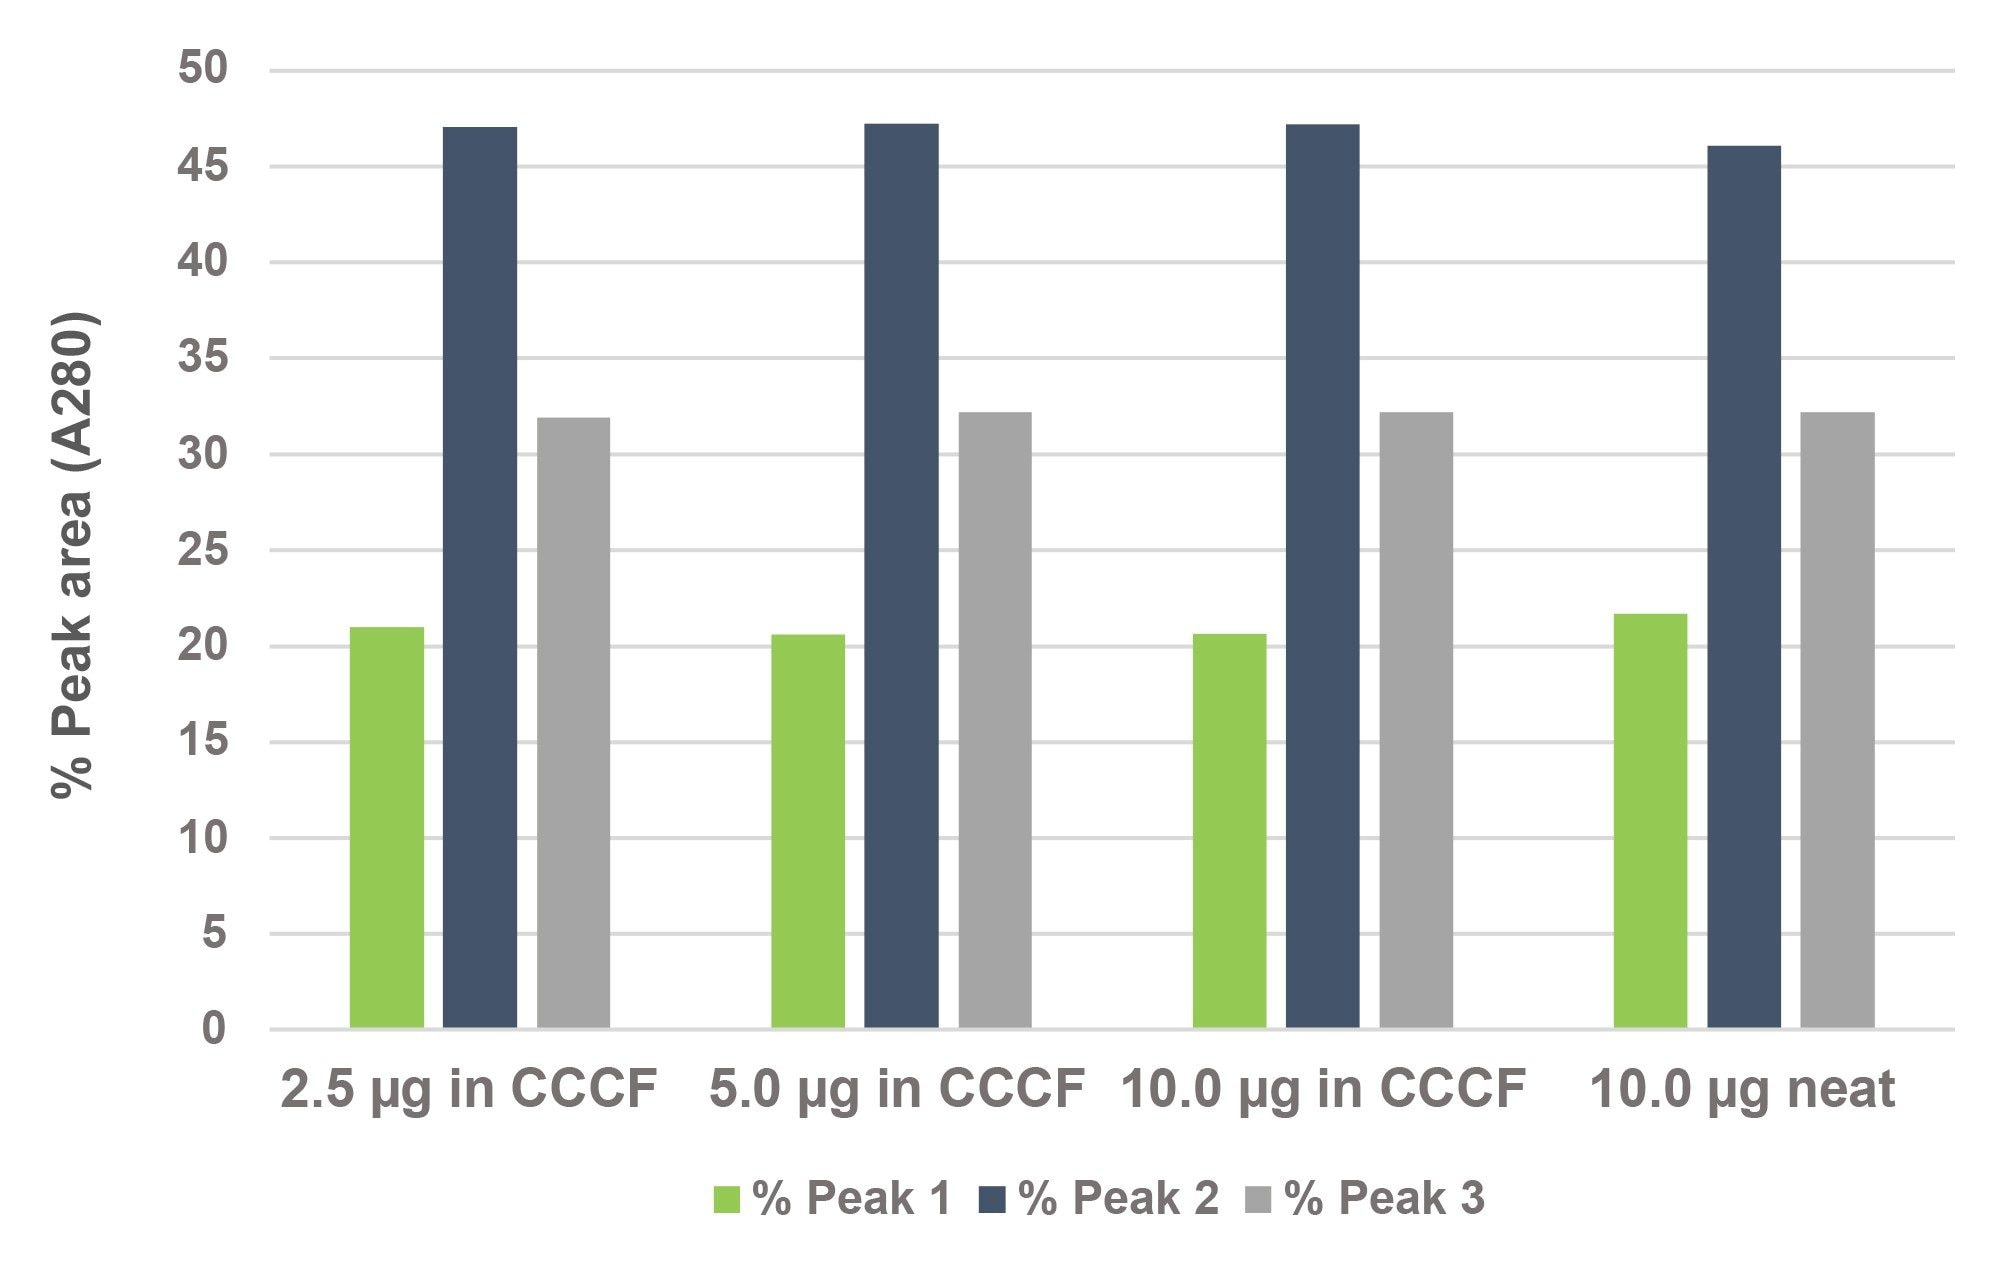
The relative abundances of the three primary HC pairings were also assessed from the drop-baseline integrations of A280 chromatograms for a range of sample loads (Figure 3). Consistent relative abundances for the CCCF diluted samples versus a neat control over a range of sample loads were observed.
Titer Determination
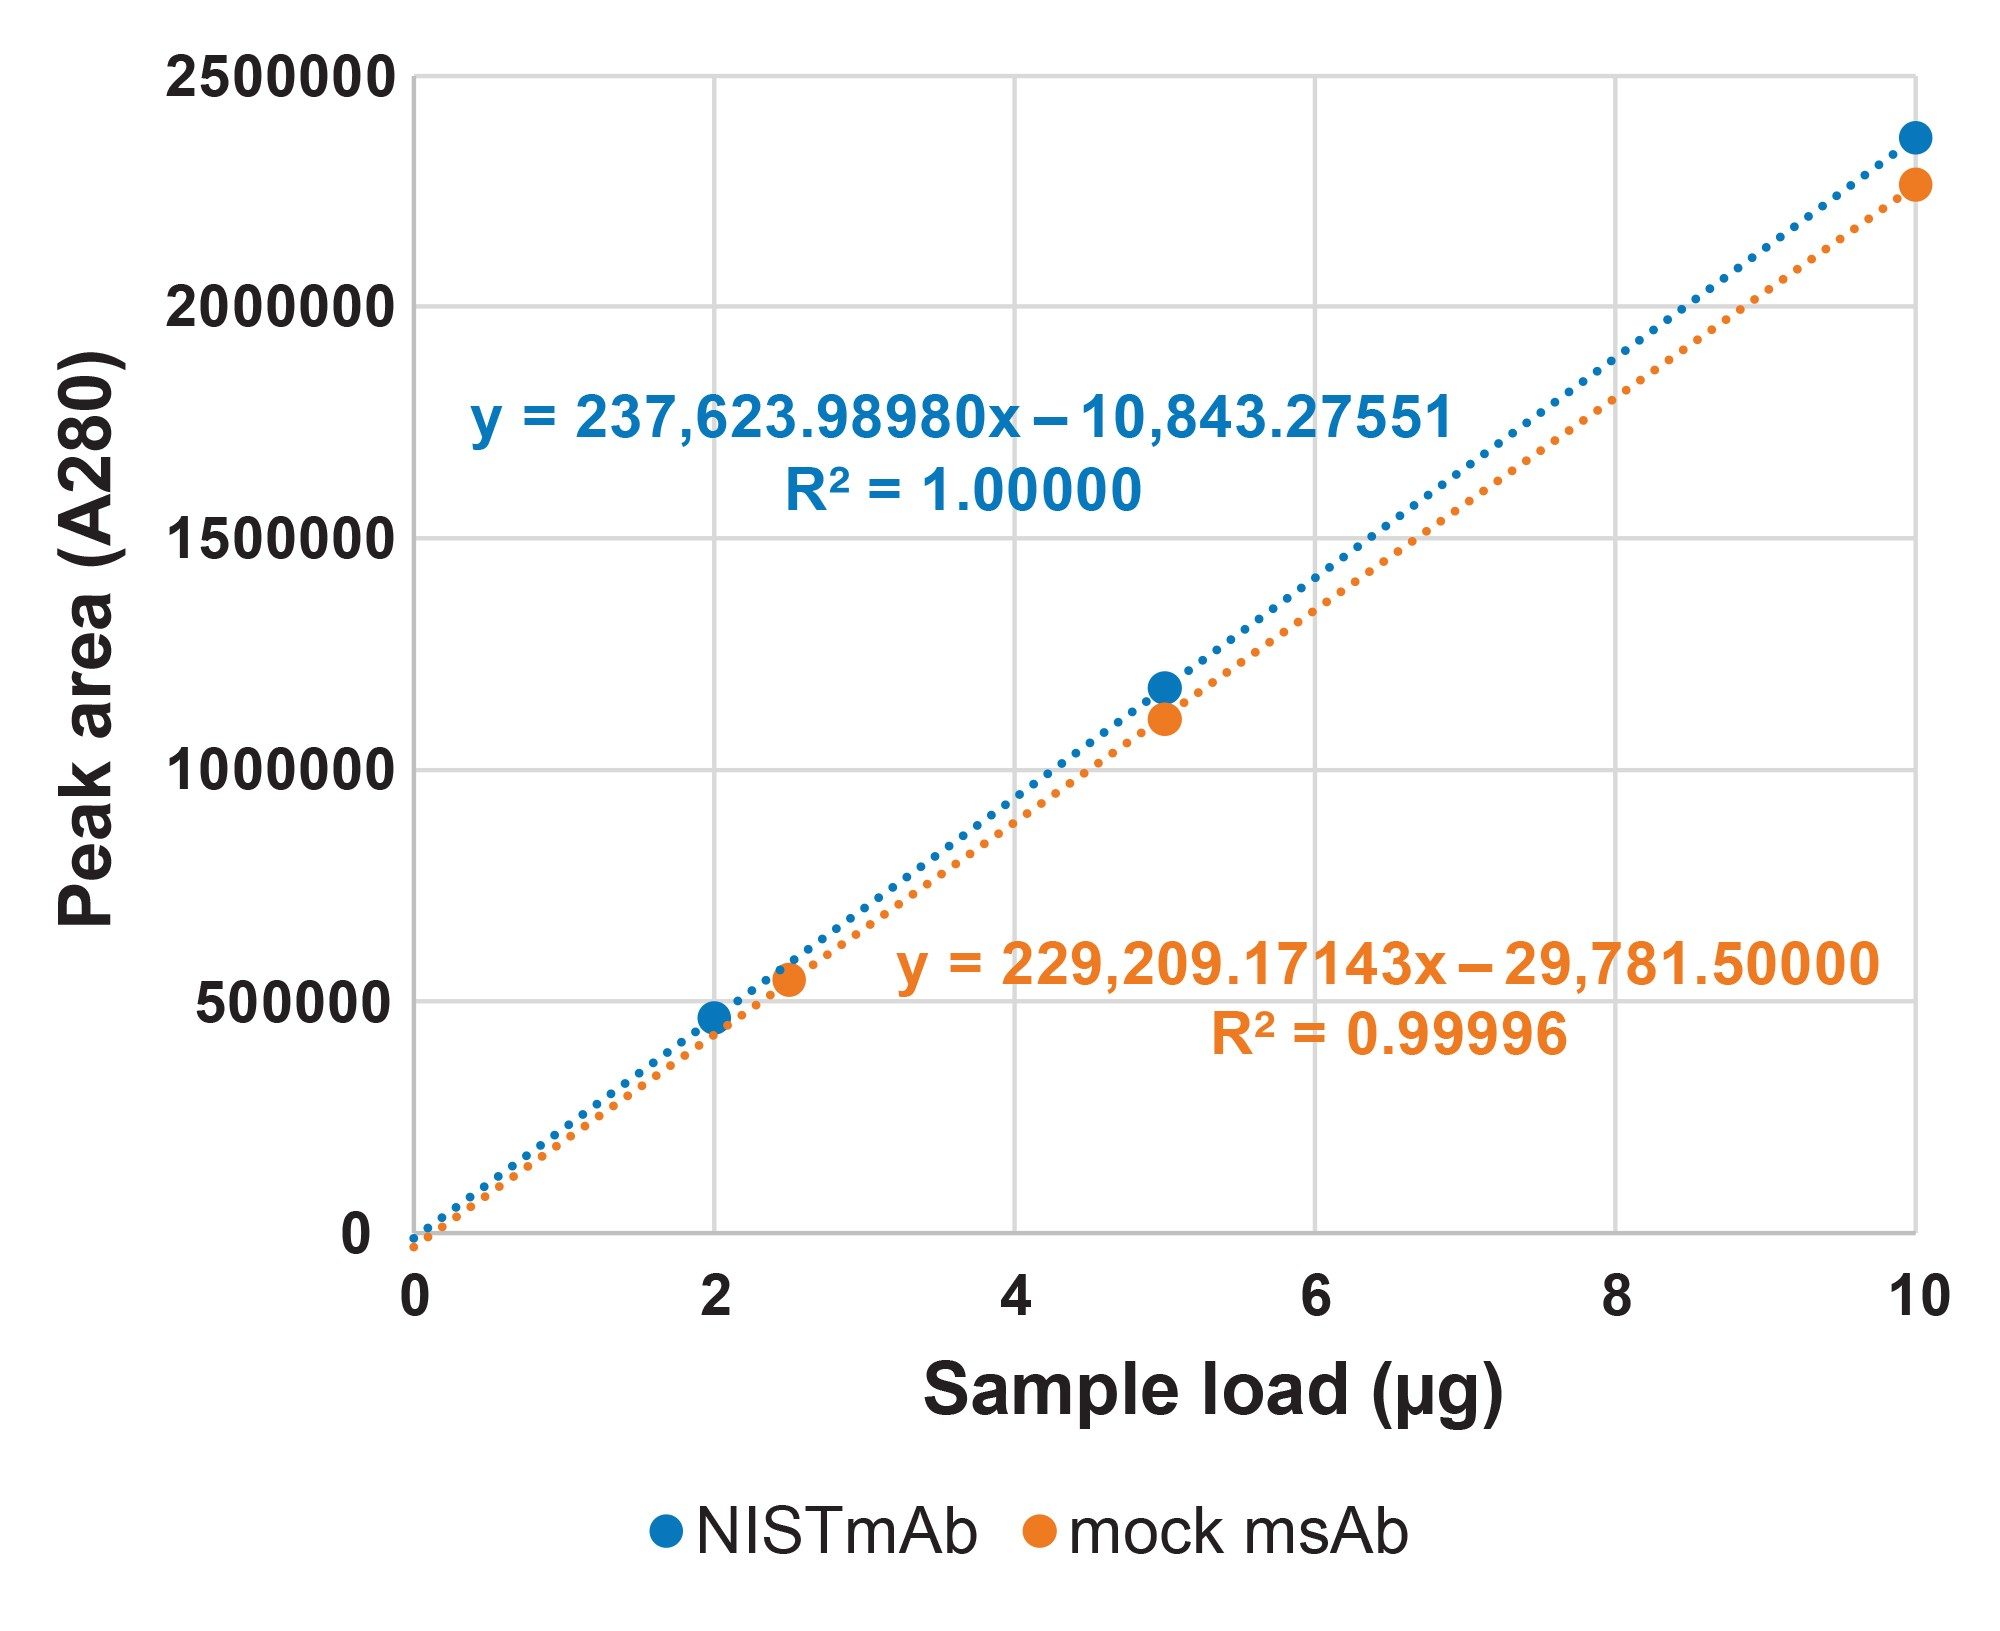
The capabilities of this ProA column for A280 titer determination have been reported.7 Accordingly, for this study fewer evaluations to confirm the fit-for-purpose recoveries and linearity of these ProA-MS methods were performed. A280 peak area linear responses for the extended gradient separations of NISTmAb and the mock MsAb diluted into CCCF are shown in Figure 4. The measured percent recovery of NISTmAb was 102% and that of the mock msAb was 96% when comparing CCCF diluted NISTmAb and mock msAb samples to the same load of their respective neat samples. The plots shown in Figure 4 indicate a linear response where the percent residual values ranged from only -0.05% to 0.08% for NISTmAb and -0.56% to 0.78% for the mock msAb. In summary, these ProA-MS methods provide valuable titer data in addition to insightful mass spectral information.
Conclusion
This study shows the benefits of applying a high efficiency ProA column to perform MS-compatible gradient separations of mAb and other Fc-based protein constructs directly from CCCF samples. These benefits can be realized when using both optical and HRMS detectors where A280 optical detection allows for the precise determination of relative abundances for separated variants plus overall titer, while the addition of HRMS detection allows for additional structural interrogation of the variants being separated.
References
- Dunham, Wade H., Michael Mullin, and Anne‐Claude Gingras. Affinity‐purification coupled to mass spectrometry: Basic principles and strategies. Proteomics 12.10 (2012): 1576-1590.
- Jakes, Craig, et al. Rapid analysis of biotherapeutics using protein A chromatography coupled to orbitrap mass spectrometry. Analytical Chemistry 93.40 (2021): 13505-13512.
- Cotham, Victoria C., et al. A generic platform to couple affinity chromatography with native mass spectrometry for the analysis of therapeutic monoclonal antibodies. Journal of Pharmaceutical and Biomedical Analysis 228 (2023): 115337.
- Gaza-Bulseco, Georgeen, Sagar Faldu, Karen Hurkmans, Chris Chumsae, and Hongcheng Liu. Effect of methionine oxidation of a recombinant monoclonal antibody on the binding affinity to protein A and protein G. Journal of Chromatography B 870, no. 1 (2008): 55-62.
- Koza, S. M., S. Shiner, M. A. Lauber. 2025. A Trap & Elute Style 2D Protein A–SEC Heart-Cut Method for the Analysis of Monoclonal Antibody Titer and Size Variants in Cell Culture. Waters Application Note, 720008902, 2025.
- Koza, S. M., Muriithi, B., S. Shiner, M. A. Lauber. 2025. An Easy-to-Execute Direct-Connect 2D Protein A–SEC Method for the Analysis of Monoclonal Antibody Titer and Size Variants in Cell Culture. Waters Application Note, 720008780, 2025.
- Koza, S. M., S. Shiner, M. A. Lauber. 2025. Lowering Quantitation Limits for mAb Titer Measurements Using Small Volume 3.5 µm Particle-Size Protein-A Affinity Columns. Waters Application Note, 720008775, 2025.
720009041, September 2025