Comprehensive Workflow for the Quantitative Analysis of Nitrosamines Drug Substance Related Impurity in Drug Product Using waters_connect™ Software
Abstract
N-nitrosamines have indeed become a significant concern for the pharmaceutical industry. These compounds are potent carcinogens and can pose serious health risks to patients if present in medications, even in trace amounts. While they are not intentionally added to drugs, their formation as impurities or degradation products during manufacturing or storage processes is a pressing issue.
In response to these concerns, regulatory agencies such as the U.S. Food and Drug Administration (FDA), the European Medicines Agency (EMA), and the other global health authorities have implemented strict guidelines and regulations to address the presence of N-nitrosamines in drugs. This guidance includes risk assessment, establishing acceptable limits for N-nitrosamine impurities, testing and, monitoring of pharmaceutical products and mitigation strategies by pharmaceutical manufacturers. Recently, both the EMA and the FDA provided revisions on how acceptable intake (AI) values are determined. The revisions introduced the Carcinogenic Potency Categorization Approach (CPCA), which aligns the relationship of impurity structure with carcinogenic potency. A CPCA category with a specific AI threshold is now determined for most new N-nitrosamines where in vivo toxicity of the impurity has not been determined.
Previously, a LC-MS/MS method was developed for the analysis of N-nitroso-sertraline in drug substance and drug product (tablet) using an Ultra-Performance Liquid Chromatography (UPLC™) System and a Xevo™ TQ-S micro Tandem Quadrupole Mass Spectrometer.
This application note describes the quantitative workflow of N-nitroso-sertraline in drug substance and drug product (tablet) using waters_connect for quantitation Software. The samples were prepared and analyzed with the focus being to demonstrate the waters_connect LC-MS/MS workflow for quantitative nitrosamine analysis. waters_connect can rapidly process large sample batches using accelerated workflows that reduces time spent on data review with the unique Exception Focused Review (XFR) functionality. Additionally, it reduces errors through the end-to-end seamless workflow from acquisition to processing method with ease of use, intuitive visuals and embedded impurity calculations.
Benefits
- Trace level detection of N-nitroso-sertraline in drug product using the Xevo TQ-S micro Tandem Quadrupole Mass Spectrometer meeting the 10% regulatory AI threshold industry guidelines
- waters_connect for Quantitation Software offers compliant-ready integrated workflows for the acquisition, processing, reviewing, and reporting of genotoxic impurity levels relative to API and regulatory set threshold
- Reduce time spent on data review with the unique Exception Focused Review functionality
- Advanced workflows for the bi-directional transfer between LIMS and waters_connect transfer supported by waters_connect
- Complete workflow demonstration of the analysis of drug substance and drug product using waters_connect for Quantitation Software
- N-nitroso-sertraline and sertraline hydrochloride reference standards serve as suitable benchmarks, enabling trace detection of the NDSRI in drug substance, and drug product
Introduction
N-nitrosamines have indeed become a significant concern in the pharmaceutical industry. These compounds are potentially potent carcinogens and can pose serious health risks to patients if present in medications, even in trace amounts. While they are not intentionally added to drugs, their formation as impurities or degradation products during manufacturing or storage processes is a pressing issue.1
The presence of N-nitrosamines in drugs gained widespread attention in the pharmaceutical industry and regulatory agencies following several high-profile recalls of medications due to contamination with these compounds. One of the most notable cases involved the discovery of N-nitrosamine impurities in certain angiotensin receptor blockers (ARBs), including valsartan, losartan, and irbesartan.2
Nitrosamine drug substance related impurities (NDSRIs) are potentially potent carcinogens, with, in some cases, even lower exposure levels raising concerns about long-term health risks. The contamination of pharmaceuticals with N-nitrosamines can occur through various mechanisms introducing the presence of vulnerable amines and nitrosating agents under certain conditions, including the use of contaminated raw materials, drug substance synthesis, and product manufacturing processes and degradation of drug substances or excipients under certain conditions such as high temperature, humidity, or exposure to light.3 In response to these concerns, regulatory agencies such as the FDA, EMA, and other global health authorities have implemented strict guidelines to regulate the presence of N-nitrosamines in drugs. This guidance includes risk assessment, establishing acceptable limits for N-nitrosamine impurities, testing, and monitoring of pharmaceutical products and mitigation strategies by pharmaceutical manufacturers.4 Recently, both the EMA and the FDA provided revisions on how AI values are determined.5,6 The revisions introduced the CPCA, which aligns the relationship of impurity structure with carcinogenic potency. A CPCA category with a specific AI threshold is now determined for most new N-nitrosamines where in vivo toxicity of the impurity has not been determined.7
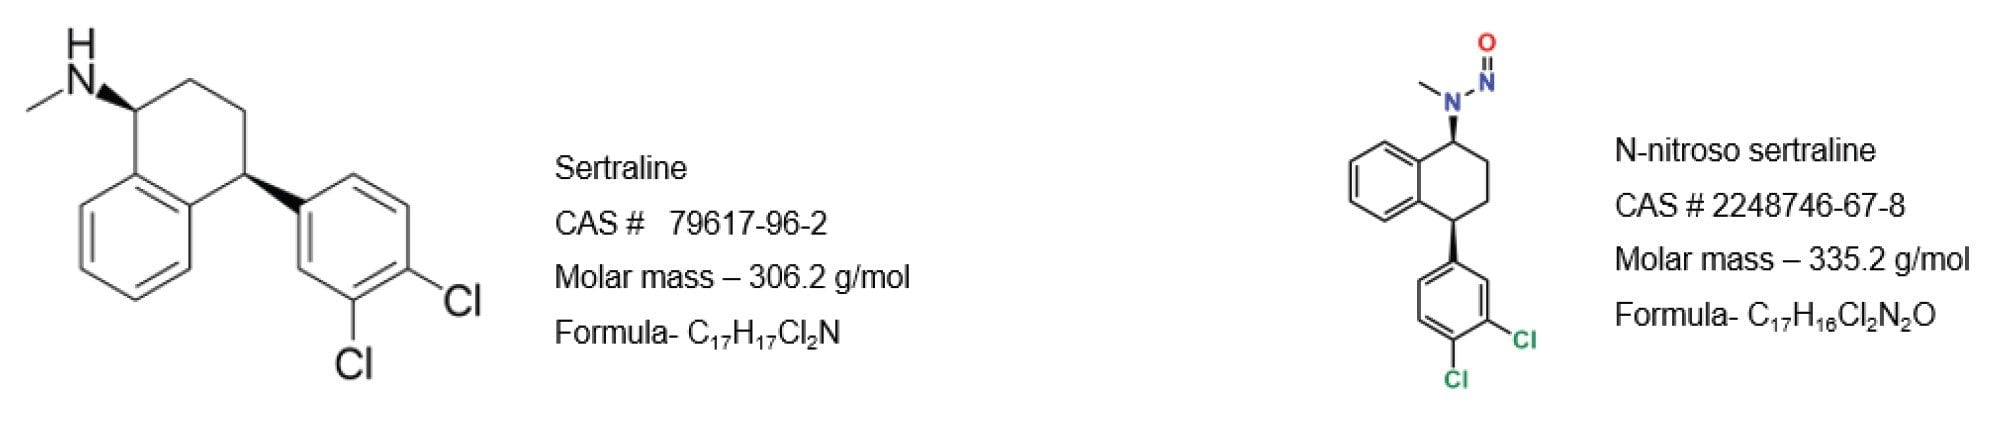
Sertraline is a commonly prescribed antidepressant medication, and N-nitroso-sertraline is a derivative formed through the nitrosation process. This compound is of particular concern due to its potential carcinogenic properties, similar to other N-nitrosamines. The presence of N-nitroso-sertraline or any N-nitrosamine derivative in pharmaceutical products above the regulatory defined threshold is considered a significant risk for patient safety and regulatory compliance. To avoid the need for onwards batch release testing in QC, analytical methods used for the detection of nitrosamines, including NDSRI, are required to demonstrate the absence of the impurity at a lower limit of quantitation (LOQ) of 10% of the limit derived from the AI and the active pharmaceutical ingredients (API) maximum daily dose (MDD). With a MDD of 200 mg, the assay exceeded the regulatory requirements of N-nitroso-sertraline. According to the EMA, the acceptable intake (AI) of sertraline is 1500 ng/day and the CPCA category is 5. While for the FDA, the AI is 100 ng/day, and CPCA category is 2. For this study, the more stringent (FDA) regulation was selected which makes a threshold of (AI/MDD) 0.5 ppm. With respect to 5 mg/mL of sertraline API, the impurity N-nitroso-sertraline threshold is 2.5 ppb (µg/kg with respect to 0.5 ppm of API) so the 10% threshold is 0.25 ppb (µg/kg with respect to 0.05 ppm of API). This study describes the analysis of N-nitroso-sertraline in drug substance and final drug form (FDF) using the ACQUITY™ UPLC I-Class PLUS System, Xevo TQ-S micro Tandem Quadrupole Mass Spectrometer, and waters_connect for Quantitation Software.
Experimental
LC Conditions
|
LC system: |
ACQUITY UPLC I-Class PLUS System with FTN |
|
Detection: |
ACQUITY PDA (UV absorbance 230 nm) |
|
Mobile phase A: |
0.1% Formic Acid in Water |
|
Mobile phase B: |
0.1% Formic Acid in Acetonitrile |
|
Purge solution: |
Acetonitrile: H2O (1:1) |
|
Wash solution: |
Methanol |
|
Seal wash: |
Methanol: water (1:9) |
|
Injection volume: |
10 µL |
|
Sample temperature: |
10 °C |
|
Column temperature: |
40 °C |
|
Extension loop: |
50 µL |
|
Column: |
Atlantis™ Premier BEH C18 AX 2.1 x 100 mm, 2.5 µm (p/n: 186009392) |
MS Conditions
|
System: |
Xevo TQ-S micro Tandem Quadrupole Mass Spectrometer |
|
Ionisation mode: |
Electrospray Positive |
|
Capillary voltage (kV): |
3 |
|
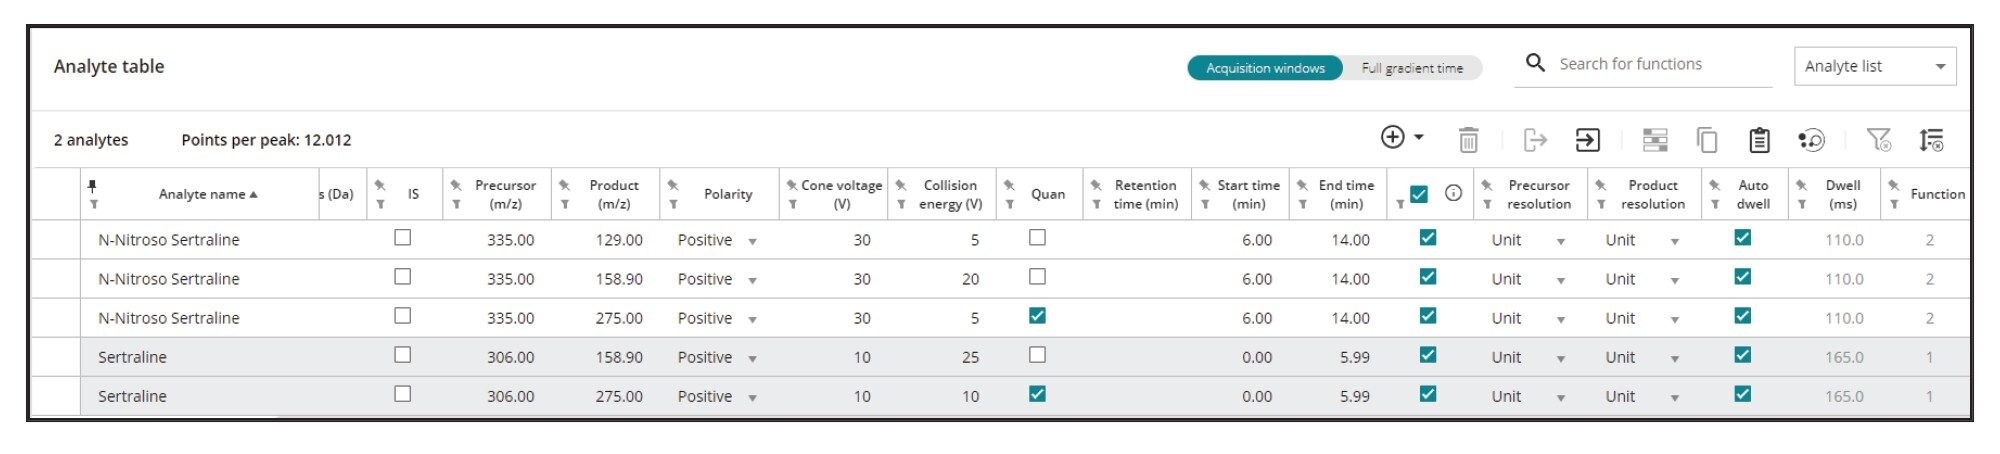
Cone voltage (V): |
Figure 2 |
|
Collision energy (eV): |
Figure 2 |
|
Source temperature (°C): |
150 |
|
Desolvation temperature (°C): |
300 |
|
Desolvation gas flow (L/hr): |
800 |
|
Acquisition and data processing: |
waters_connect for Quantitation Software |
Sample Preparation
Standards and reagents
Standards of N-nitroso-sertraline (CAS# 3006789–98–3) and sertraline hydrochloride (CAS# 79559–97–0) were supplied from LGC Standards subsidiaries, LGC-TRC and LGC-Mikromol respectively. Optima LC/MS grade solvents and formic acid were purchased from Fisher Scientific. A primary stock solution of N-nitroso-sertraline at 10 mg/mL was used to prepare the working solutions.
Sertraline (C17H17Cl2N) constitutes 89.8% of sertraline hydrochloride (C17H17Cl2N HCl). Aliquots of sertraline hydrochloride (5.09 mg=4.57 mg of sertraline) were weighed into scintillation vials and 0.91 mL of methanol was added to make 5 mg/mL of sertraline 10 mg N-nitroso-sertraline (C17H16Cl2N2O) was weighed, and 10 mL methanol was added to make a 1 mg/mL stock solution. A working solution of N-nitroso-sertraline was further diluted with methanol.
Recovery
Recovery was studied at two levels, threshold and 10% of threshold equating to 0.5 mg/kg, and 0.05 mg/kg N-nitroso-sertraline with respect to 5 mg/mL sertraline. Spiking solutions of N-nitroso-sertraline were prepared at 10 and 100 ng/mL with methanol. The spiking solutions were used to prepare two concentrations for the recovery calculations.
Pre-spikes
20 µL of each spiking solution concentration was pipetted into 6 tubes each containing 5.09 mg sertraline hydrochloride. They were made up to 1 mL with methanol to make final concentrations of 0.5 and 0.05 mg/kg (ppm).
Matrix Blanks
Matrix blanks were prepared by taking 5.09 mg sertraline hydrochloride and diluting to 1 mL with methanol.
Standard Solutions
Standard solutions at each test concentration level (0.25 and 2.5 ng/mL) were prepared in 20 mL scintillation glass vials using 20 µL spiking solutions in 980 µL methanol.
Tablet Preparation
6 tablets were crushed together and accurately weighed out to 52.36 mg (47.02 mg of sertraline) three times. After that 9.4 mL methanol was added to make 5 mg/mL.
Pre-spikes, matrix blanks, standard solutions, and tablet preparations were all subjected to the same extraction routine. They were extracted for 5 minutes, followed by 1-minute vortexing, and centrifuging at 15000 rpm for five minutes before transfer into LC-MS vials.
Calibration Curve Preparation
Standard Calibration Curve
An authentic standard of N-nitroso-sertraline (1 mg/mL) in methanol was sequentially diluted to create a calibration curve ranging from 0.25 to 50 ng/mL.
Results and Discussion
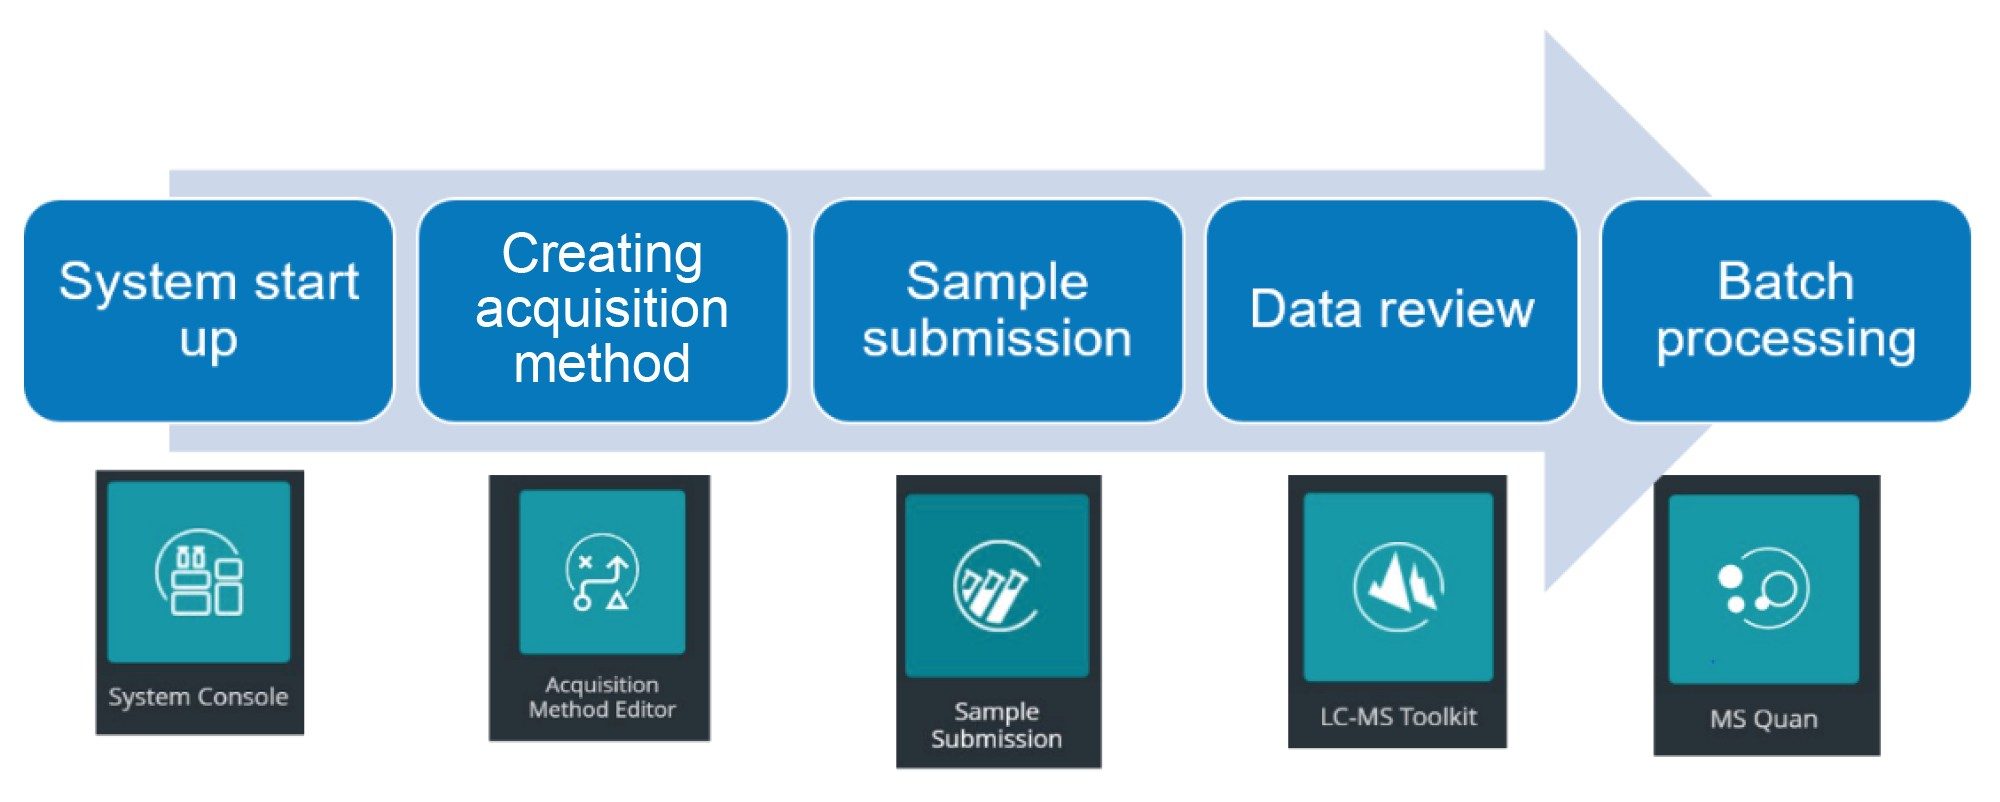
Data was acquired and processed using the applications within waters_connect for Quantitation Software. The quantitative workflow is outlined in Figure 4. The System Console application has system startup tools such as “MRM optimization” and others. Acquisition Method Editor (AME) supports the creation of combined and optimized LC, MS, and UV method parameters. After submitting acquisition batches via the Sample Submission application, data can be quickly viewed, via the LC-MS Toolkit application. Full quantitative batch processing and review is supported in the MS Quan application which incorporates efficiency driving XFR function and the calculation of ppm concentration of impurity relative to API and regulatory set AI.
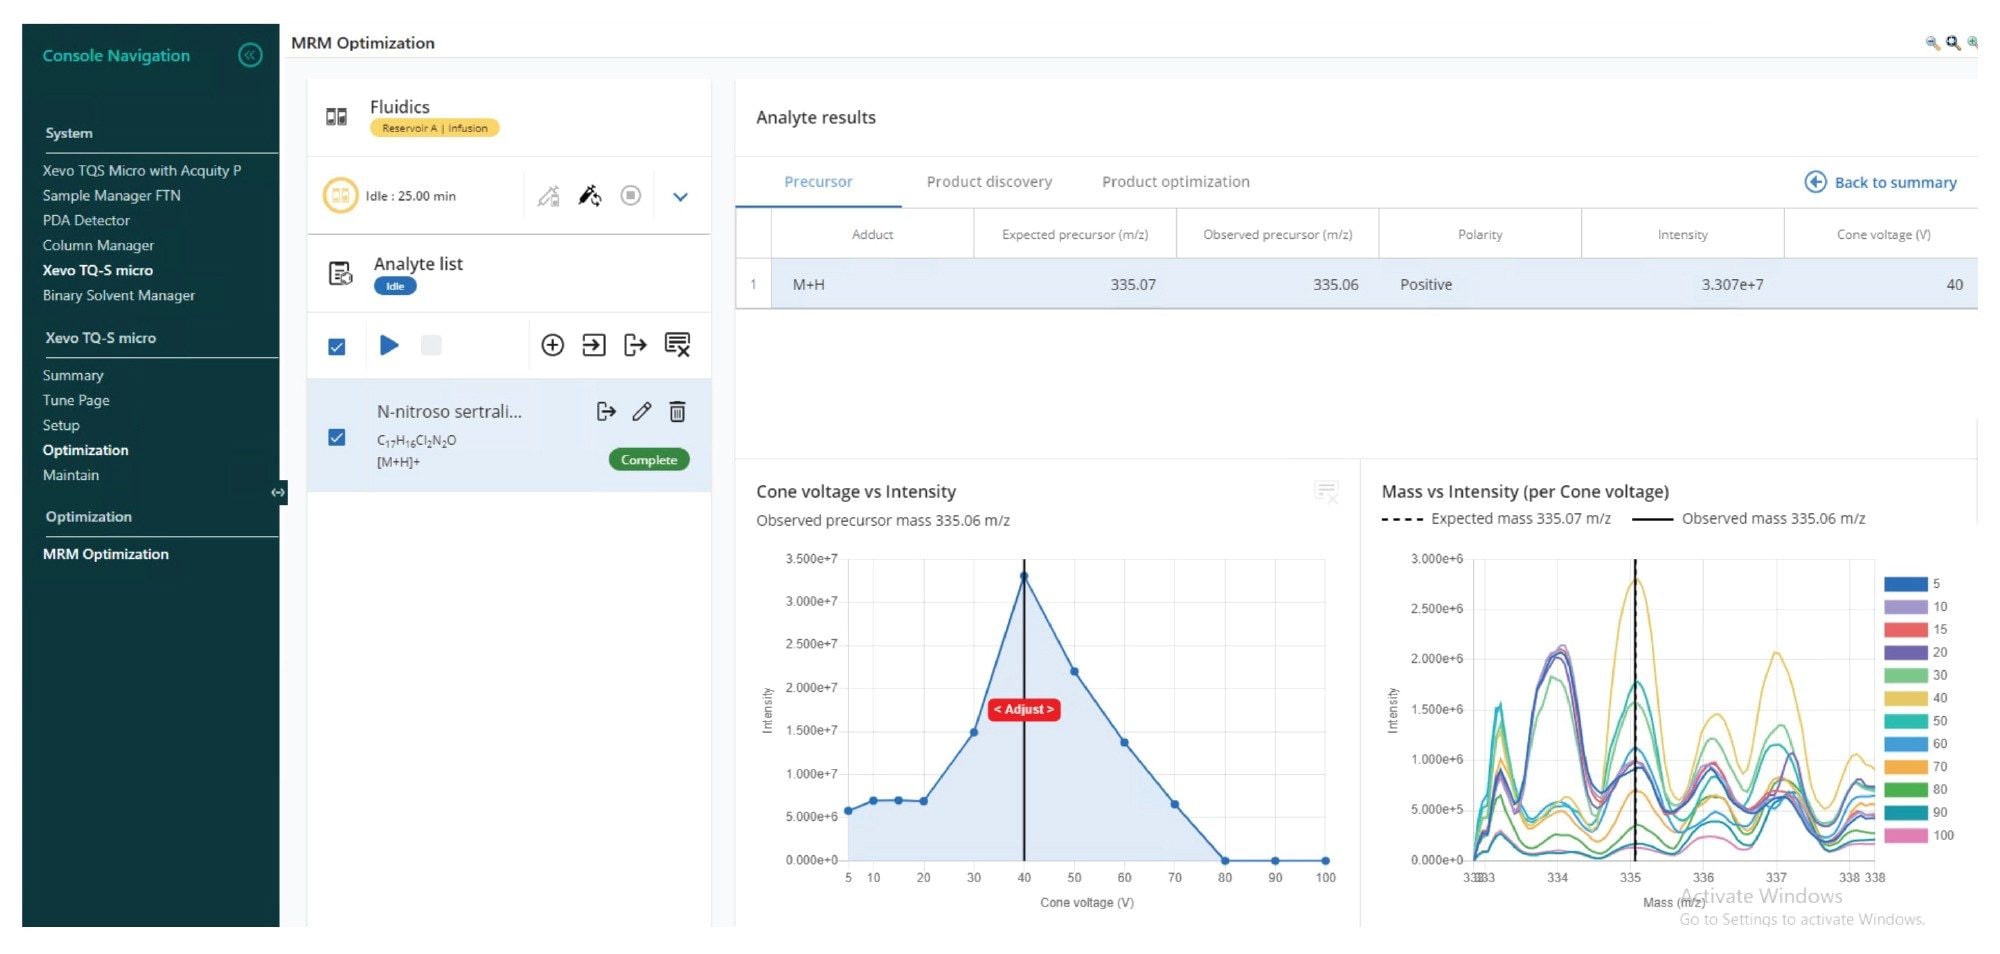
MRM Optimisation Via System Console
MRM transitions of N-nitroso-sertraline were optimized automatically with the “MRM Optimization” tool within System Console. Figure 5 shows the optimisation of the precursor ion through systematic ramping of cone voltages. After optimizing the cone voltage, the tool identifies various product ions, and their collision energies. Optimized results can be selected and exported into the AME where LC, MS, and PDA method related parameters reside.
Chromatographic Separation
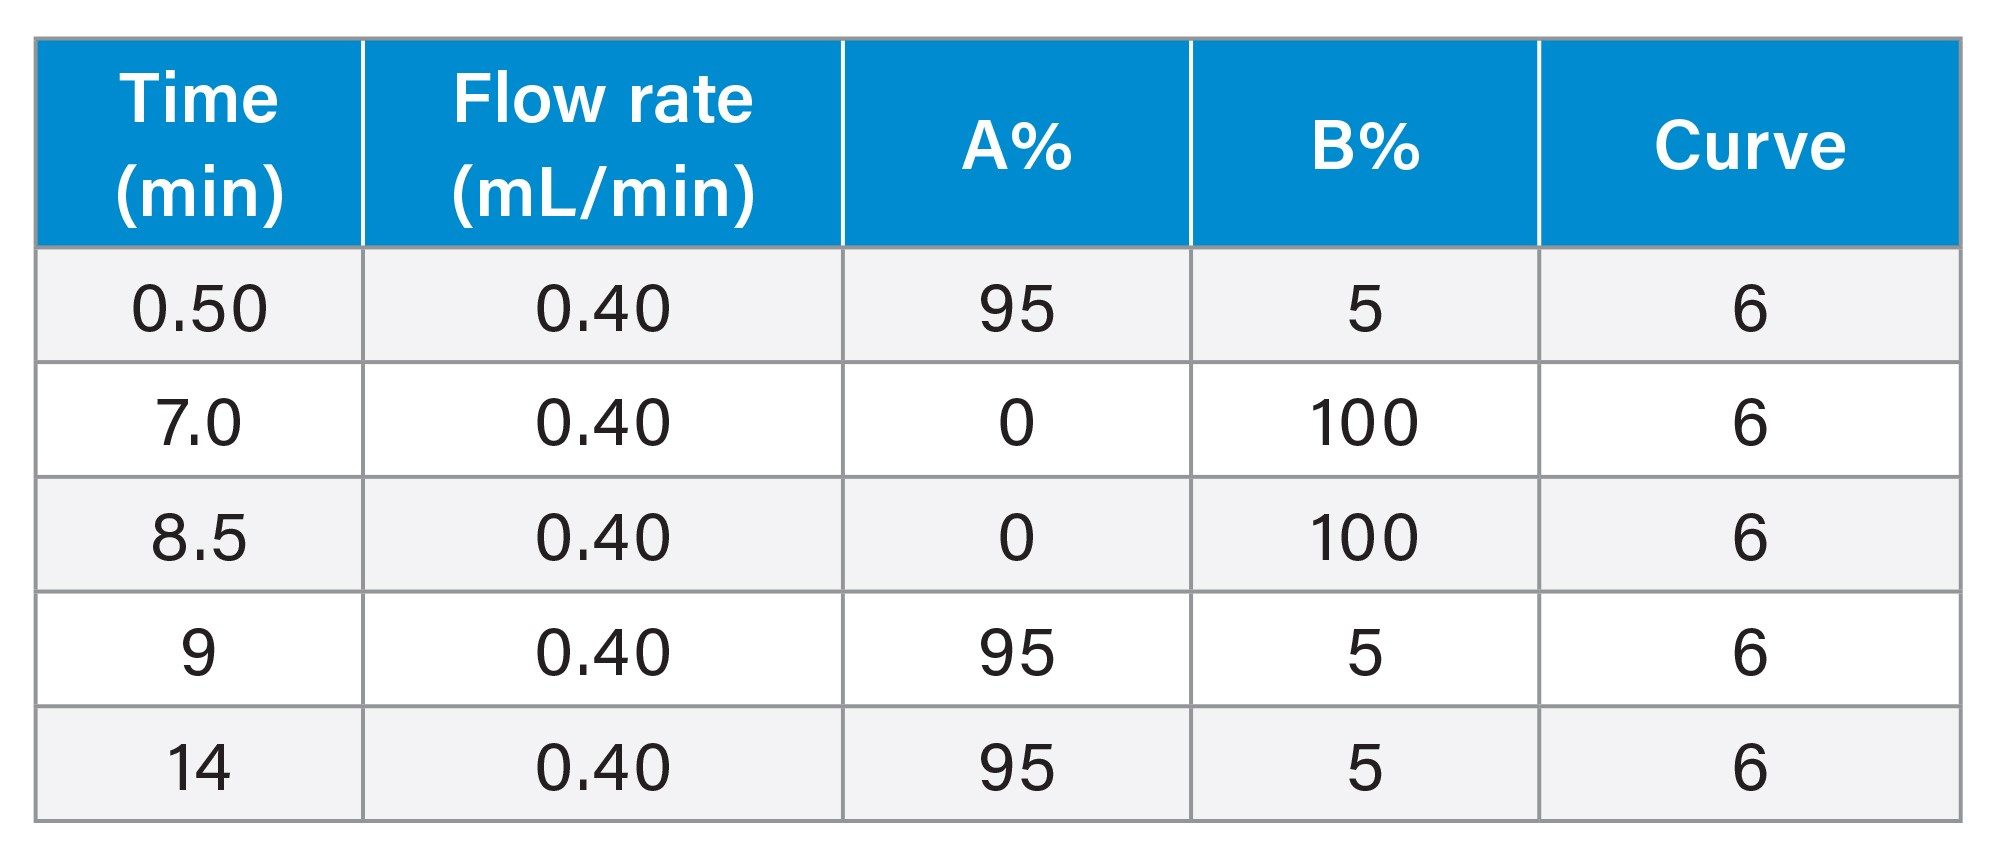
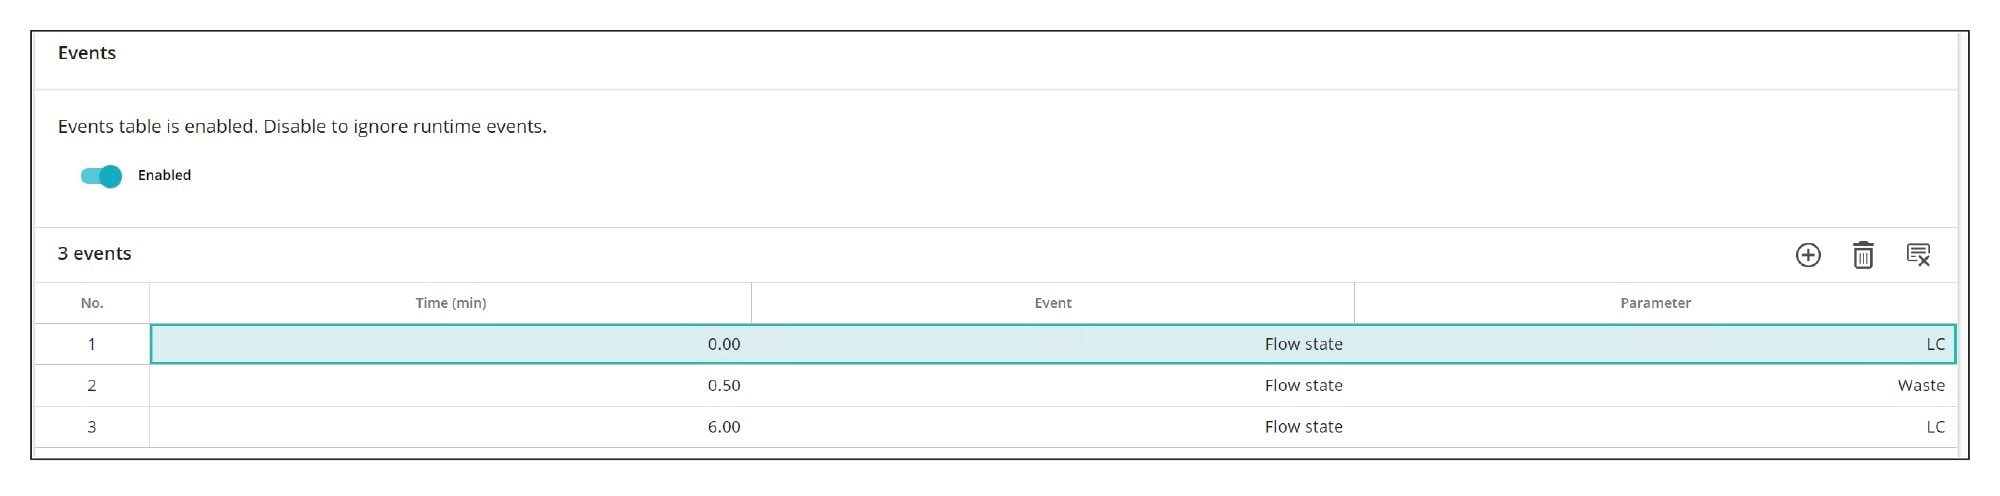
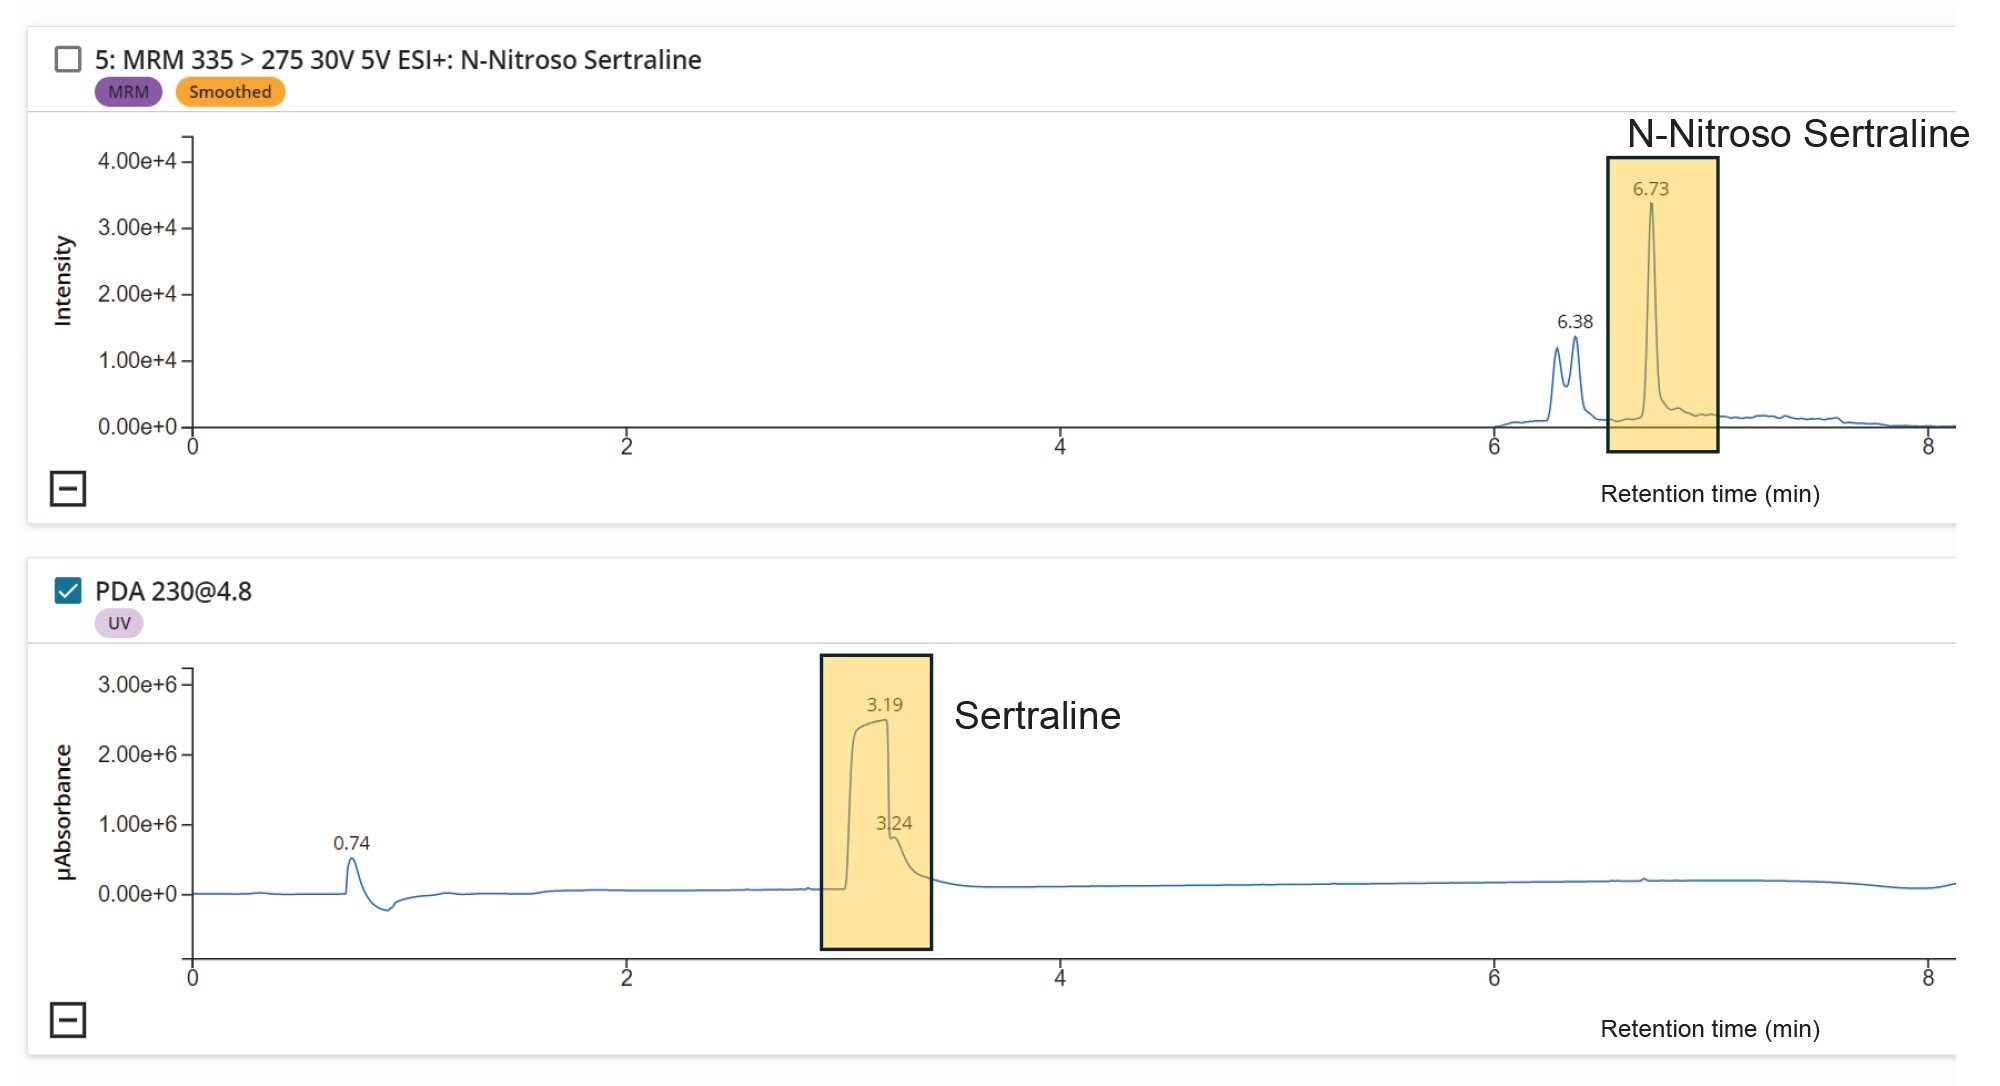
The chromatographic resolution and separation between sertraline (API), and N-nitroso-sertraline is vital to avoid any potential matrix effects that could occur due to the proximity of the high levels of API present in the samples and for accurate quantification of the impurity. As sertraline concentrations are considerably higher and to avoid saturation of the MS, the first 6.0 minutes of the chromatographic run was diverted to waste using the integrated solvent divert valve (see Figure 1) in AME.
Calibration curves, recovery samples, and tablet samples (drug product) were acquired within Sample Submission. The Sample Submission application also provides bi-directional LIMS integration where a sample set can be created via the import of a CSV file and results can be exported using the same format. Figure 6 shows the chromatogram of N-nitroso-sertraline with a retention time of 6.73 min in LC-MS Toolkit. The Atlantis Premier BEH C18 AX Column provides sufficient separation between the sertraline (RT 3.19 min) API and the N-nitroso-sertraline impurity (RT 6.73 min).
Limit of Quantitation (LOQ) and Linear Dynamic Range
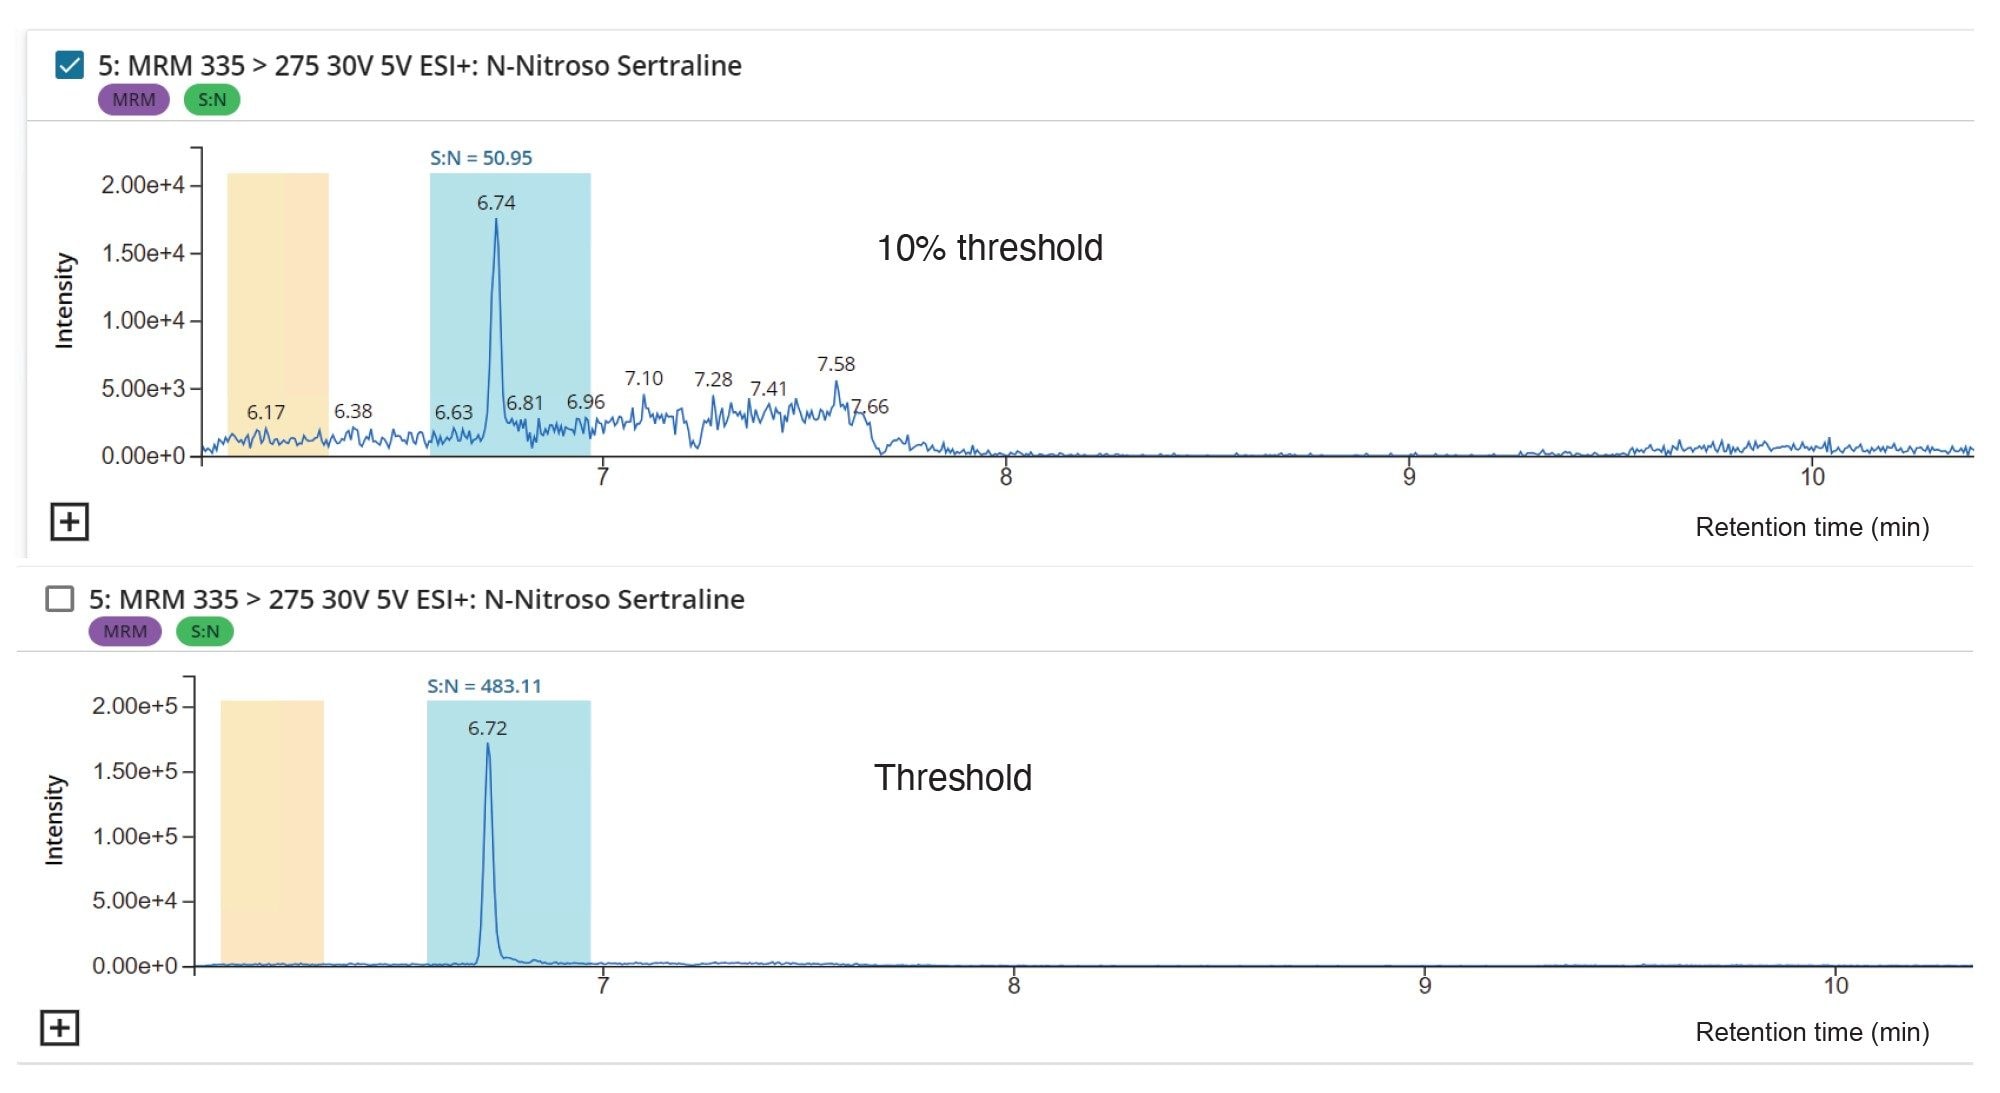
The quantitative limits of the assay were initially established using standards of N-nitroso-sertraline with the LOQ based on a 10:1 signal-to-noise (S/N) ratio using the RMS algorithm. The FDA regulatory set AI threshold level for detection of N-nitroso-sertraline was 2.5 ppb (µg/kg, 0.5 PPM) with respect to 5 mg/mL sertraline. The performance of the methods was assessed to a LOQ of the 10% of the regulatory set thresholds level 0.25 ppb (µg/kg, 0.05 PPM), illustrating a common requirement for demonstrating absence of the impurity at this level avoids the need for onward routine release batch testing.
The signal to noise ratio (RMS method) was calculated in LC-MS Toolkit where yellow and blue bars show the regions where noise and signal were selected for the calculation. The signal to noise ratio for N-nitroso-sertraline was 51 (RMS) at the 10% threshold. Figure 7 shows chromatograms at the threshold and the 10% threshold in LC-MS Toolkit.
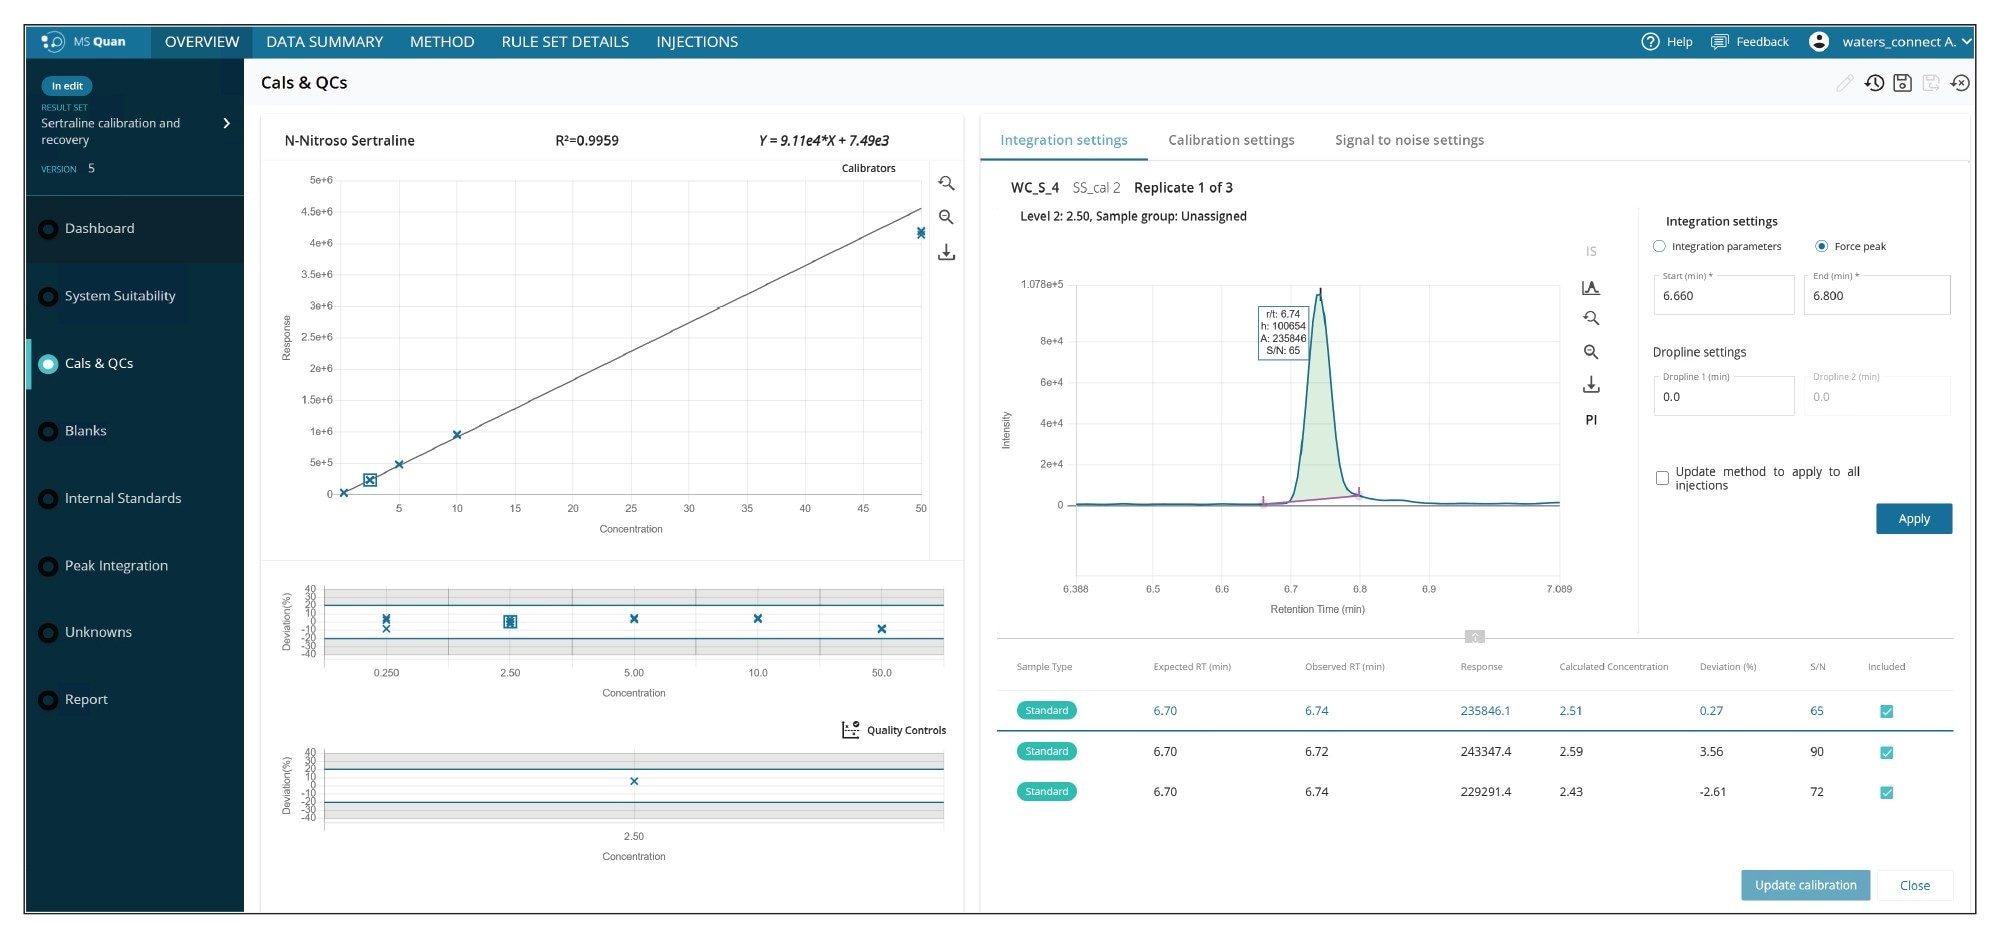
The quantitative batch was processed in the waters_connect MS Quan application which provides an optional but unique exception focused review (XFR) tool to support rapid data review based on acceptance criteria for results parameters determined by a user defined rule set. Data outside these criteria will flag in red as an exception. This helps in reviewing outliers quickly, improving the efficiency of data review process. The rule set allows users to specify criteria for Calibration and QCs, Blanks, Standards, Retention time, and Ion ratios, etc. Data can be review with or without a rule set.
The linear dynamic range was determined by evaluating a standard of N-nitroso-sertraline. The calibration standards were injected in triplicate and the curve was linear across the analyzed range, 0.25–50 ng/mL with R2 greater than 0.99 and <20% concentration deviations. Figure 8 shows the calibration curve, deviation across the calibration range, QC deviation, chromatogram, peak area, retention time, and signal to noise ratio of solvent standards all in one place all within the MS Quan application.
Recovery
The recovery experiments were performed at 0.5 ppm and 0.05 ppm (each level was prepared and injected six times) which equates to 0.25 and 2.5 ppb with respect to 5 mg/mL of API. Due to the presence of the endogenous level of N-nitroso-sertraline in the API, the recovery calculations were based on the corrected responses for the pre-spiked API samples using the average response for the N-nitroso-sertraline peak present in the API blank (n=6 replicates). The average response for the peak in the API was subtracted from each of the responses in the pre-spiked samples. The recovery was calculated using the following formula:
% Recovery = (Response Pre-spike corrected/Standard Response) * 100%
The calculated average recoveries were between 82–91% and %RSD for the recoveries at each concentration level were less than 7%.
Carryover
The highest standard of N-nitroso-sertraline was injected at 50 ng/mL and no carryover was observed in the first blank sample.
Quantification of Tablet Sample
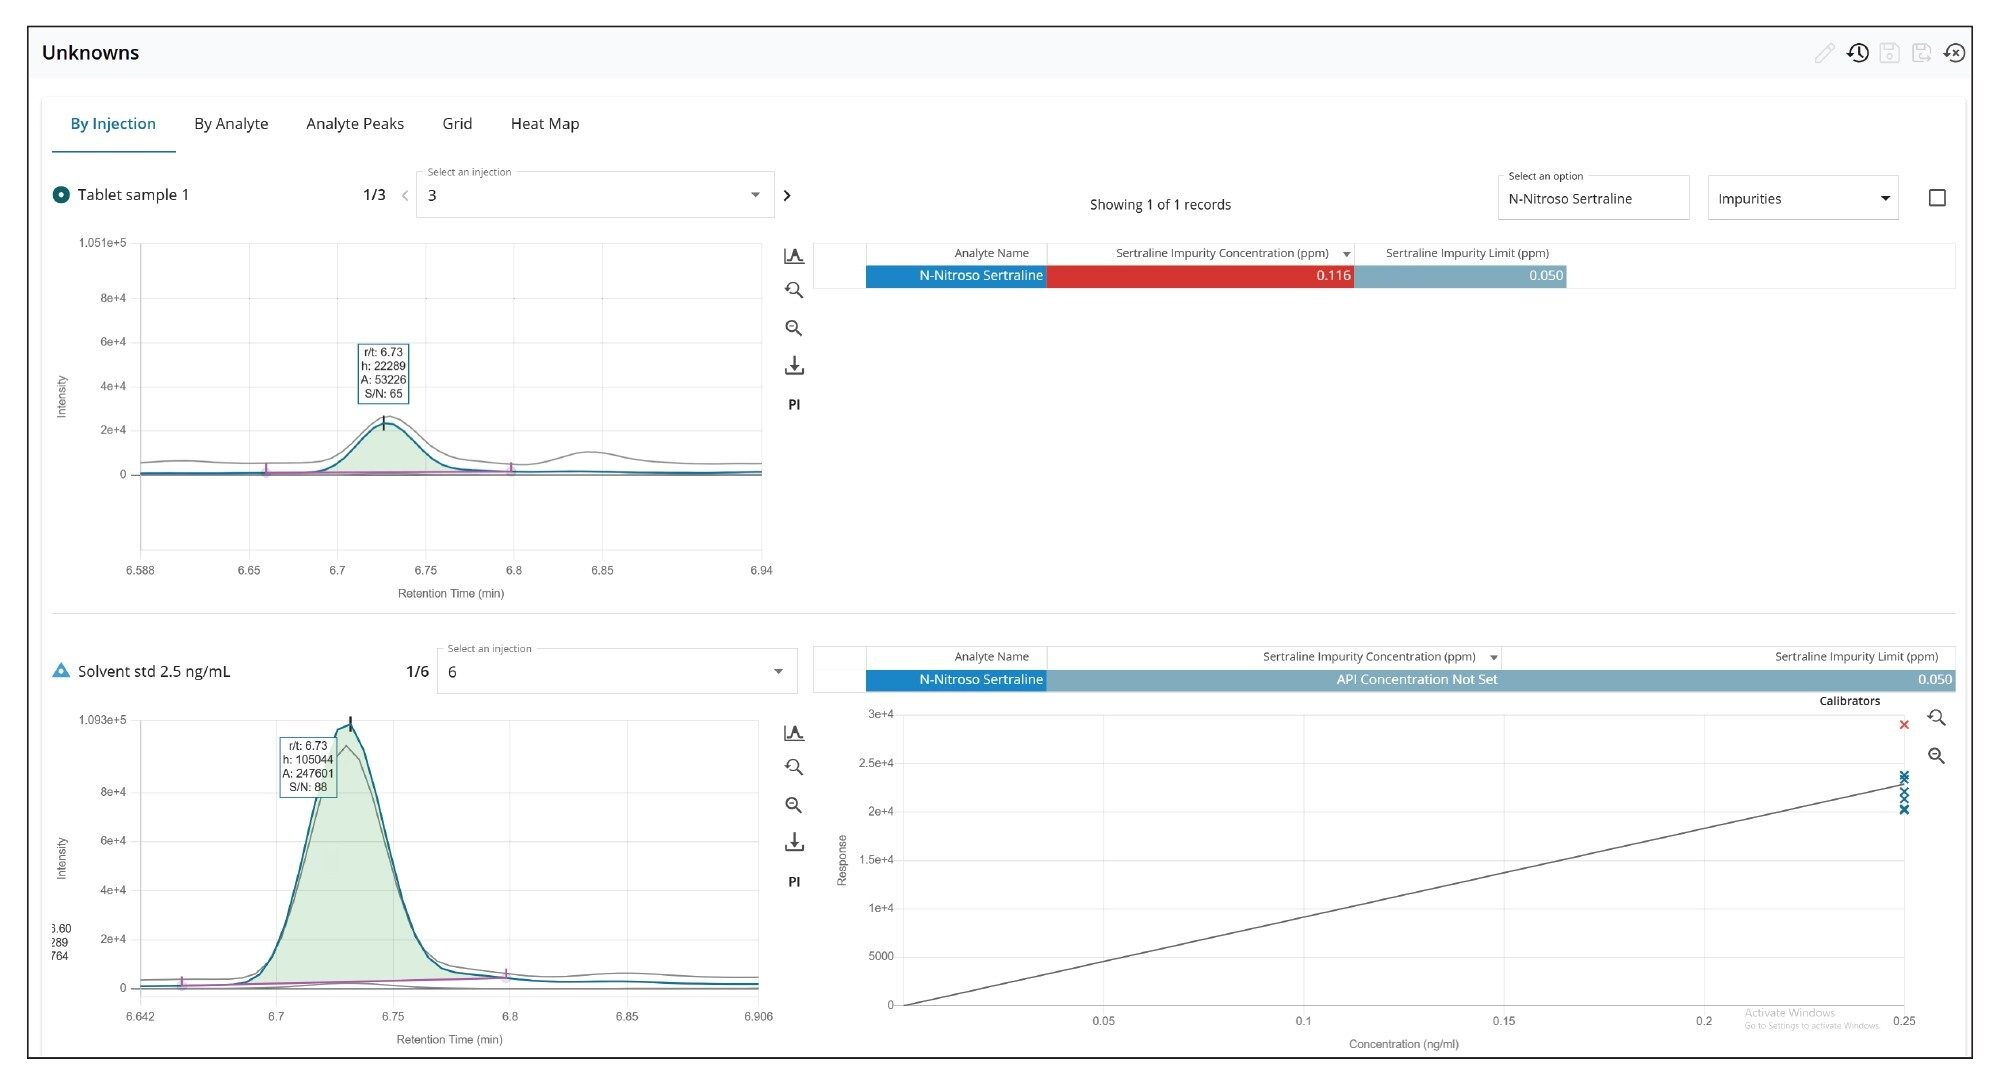
Sertraline hydrochloride tablets (each 50 mg) were analyzed for the N-nitroso-sertraline impurity. Two samples were prepared and injected in triplicate. N-nitroso-sertraline was found to be present in the sertraline hydrochloride tablet and was quantified with 6 replicates of 0.25 ng/mL of solvent standard.
Figure 9 shows chromatograms of N-nitroso-sertraline in sertraline hydrochloride tablet in the Unknowns page in MS Quan. Within this page, a simultaneous chromatogram view of the unknown sample (left side top) and reference standard (left side bottom) can be seen along with the calibration curve (right side bottom) and quantification result (right side top).
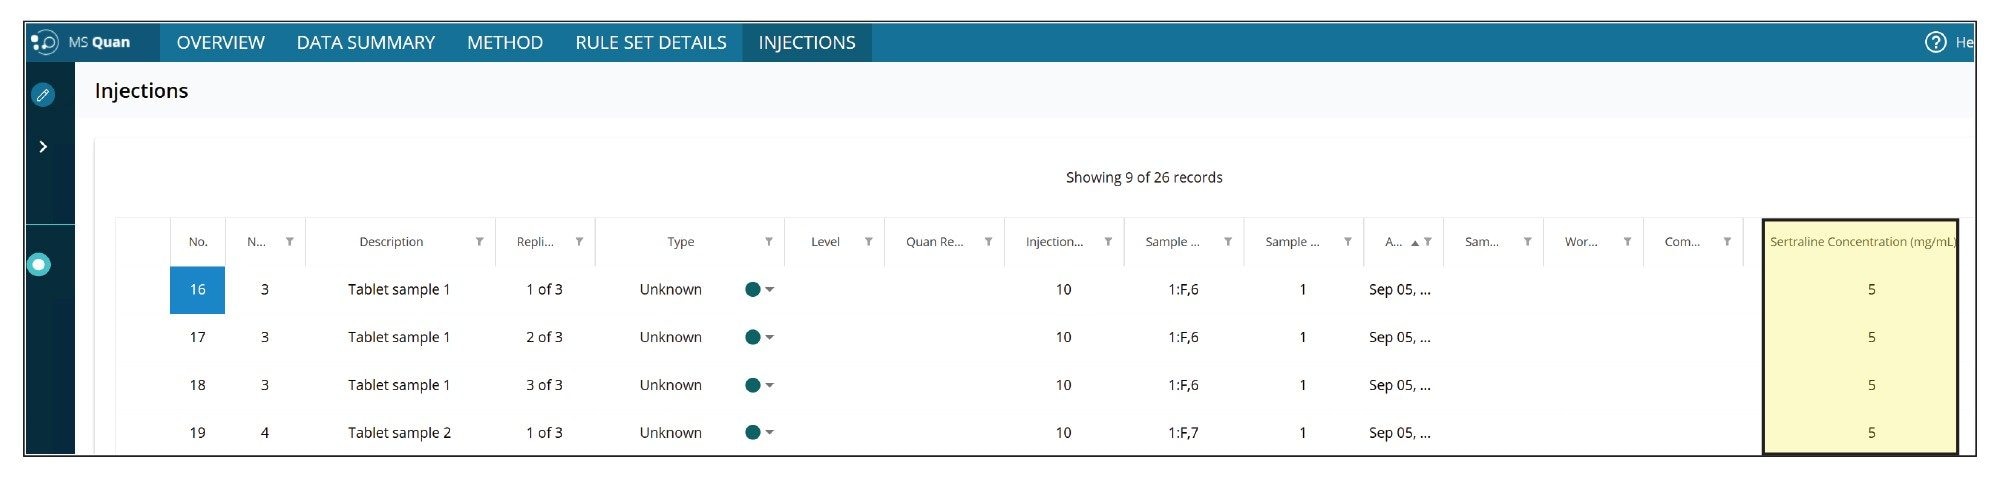
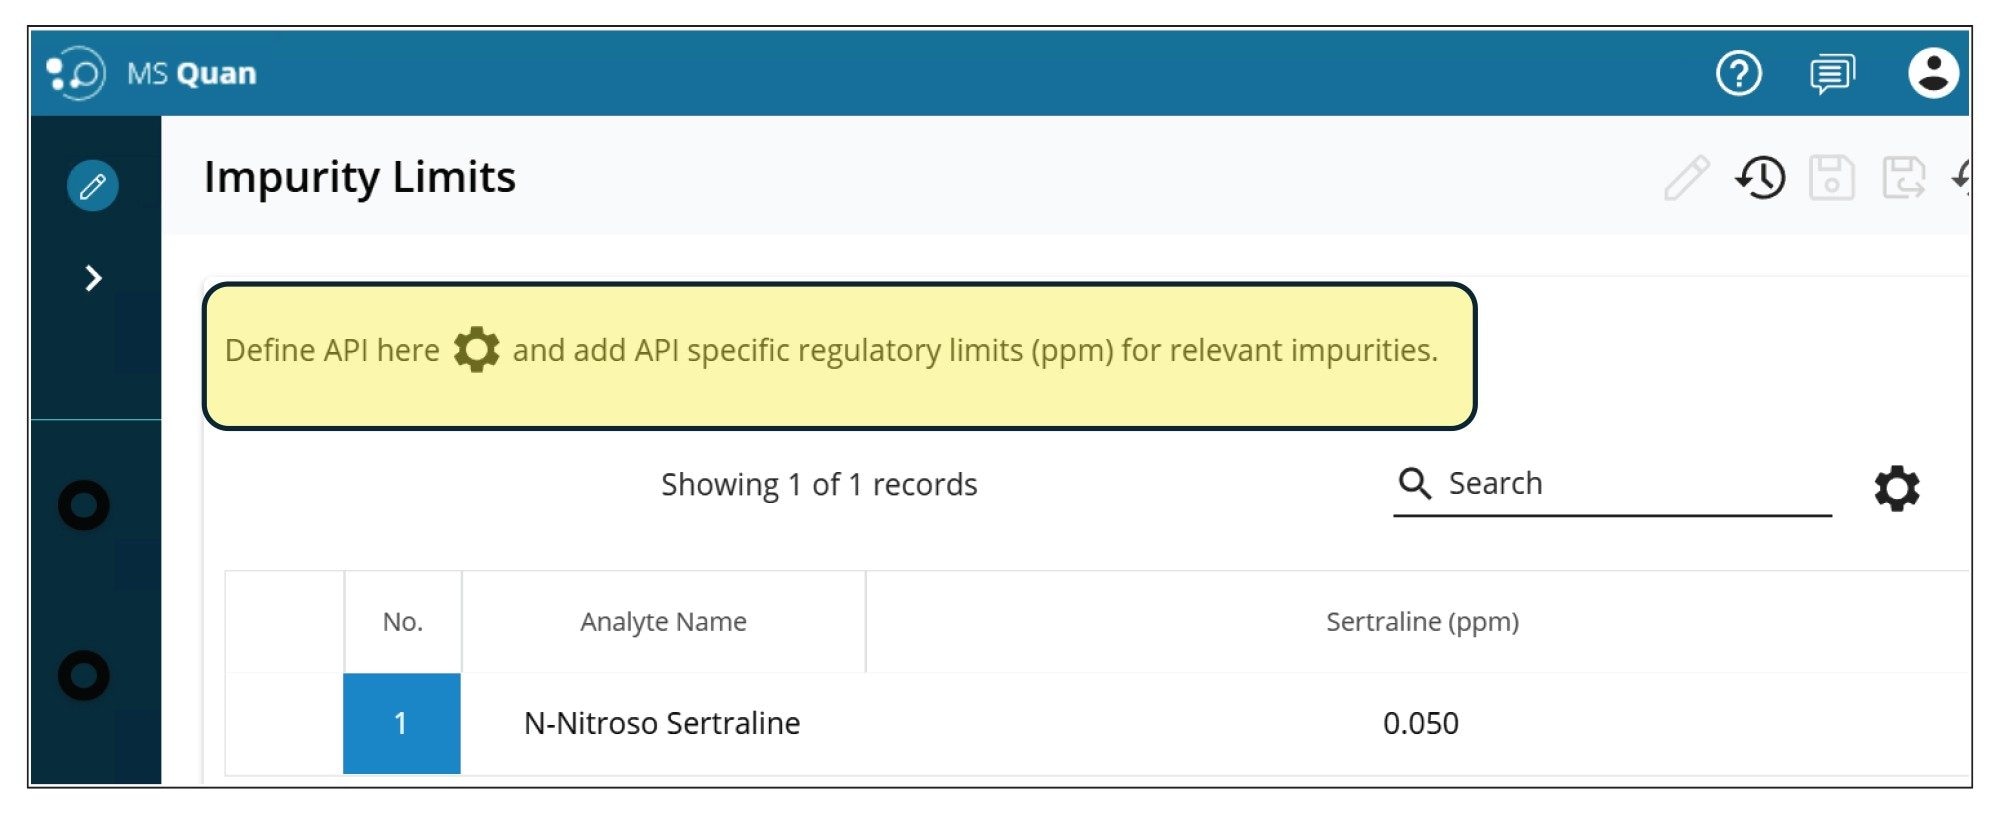
For the quantification of the impurity, the MS Quan application facilitates impurity calculations, where users can define “regulatory threshold limits” for the impurity (N-nitroso-sertraline), and the API (sertraline). For this application, the API concentration was defined as 5 mg/mL. Figure 10 shows the injection view in MS Quan where the API concentration was defined (highlighted in yellow). Figure 11 shows the regulatory threshold limit (0.05 ppm at 10% threshold) setup for N-nitroso-sertraline in the method.
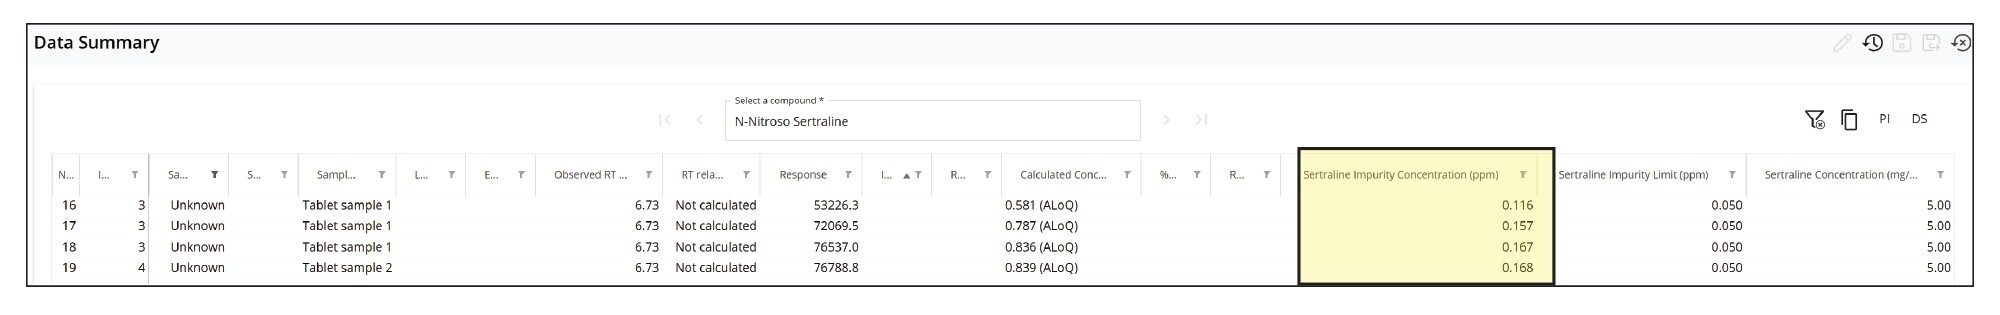
The calculated concentrations of N-nitroso-sertraline in tablet samples are shown along with retention time, peak area, impurity threshold limit, and API concentration in a table view under Data Summary in MS Quan (Figure 12). The average concentration was found to 0.14 ppm with %RSD <15% between 2 preparation batches. The quantification results show the presence of N-nitroso-sertraline was above the 10% threshold (0.05 ppm) but below the threshold level (0.5 ppm).
Conclusion
This study demonstrates a quantitative workflow for the analysis of N-nitroso sertraline in drug substance and drug product using the ACQUITY UPLC I-Class PLUS and Xevo TQ-S micro with waters_connect for Quantitation Software.
The method can achieve the regulatory thresholds for detection and quantification of N-nitroso-sertraline, as determined by the CPCA.6 It showed accuracy with excellent linearity (0.25–50 ppb, R² >0.99), high recovery rates (82–13%), precision (%RSD <15%), and no detectable carryover.
waters_connect for Quantitation Software provides a compliant-ready software including efficiency benefiting expectations focused data review and software impurity calculations, networked informatics platform, bi-directional LIMS integration, for the routine quantitative analysis of impurities in a regulated environment.
References
- U.S. Food and Drug Administration (FDA). (2019). Nitrosamine Impurities in Human Drugs.
- https://www.fda.gov/drugs/drug-safety-and-availability/fda-updates-and-press-announcements-angiotensin-ii-receptor-blocker-arb-recalls-valsartan-losartan.
- Răzvan C. Cioc, Ciarán Joyce, Monika Mayr, and Robert N. Bream. Formation of N-Nitrosamine Drug Substance Related Impurities in Medicines: A Regulatory Perspective on Risk Factors and Mitigation Strategies.
- European Medicines Agency (EMA). (2020). Nitrosamine impurities.
- Nitrosamines EMEA-H-A5(3)-1490 - QA Art. 5(3) Implementation_ QA10_revision 18_Oct23 (europa.eu) [accessed October 16th, 2023].
- Updated Information | Recommended Acceptable Intake Limits for Nitrosamine Drug Substance-Related Impurities (NDSRIs) | FDA [accessed October 16th, 2023].
- Burns, M. J.; Ponting, D. J.; Foster, R. S.; Thornton, B. P.; Romero, N. E.; Smith, G. F.; Ashworth, I. W.; Teasdale, A.; Simon, S.; Schlingemann, J. Revisiting the Landscape of Potential Small and Drug Substance Related Nitrosamines in Pharmaceuticals. Journal of Pharmaceutical Sciences. DOI: 10.1016/j.xphs.2023.10.001 (accessed October 16th, 2023).
- Dimple D. Shah, Marian Twohig, Matthew Gregory, Joe Lackey, Moritz Perscheid, Amy Bartlett, and Peter Hancock. Analysis of N-Nitroso-Sertraline in Drug Substance and Tablet Using LC-MS/MS. Waters Application Note. 720008455. September. 2024.
720008675, February 2025