Automated Solid-Phase Extraction (SPE) and UPLC-MS/MS Analysis of PFAS in Milk
Daniel Ng, Marcus Devakishen, Kai Xiang Kuah, Stuart Adams, Simon Hird, Joanne Ho
Waters Corporation, United States
Published on June 04, 2025
Abstract
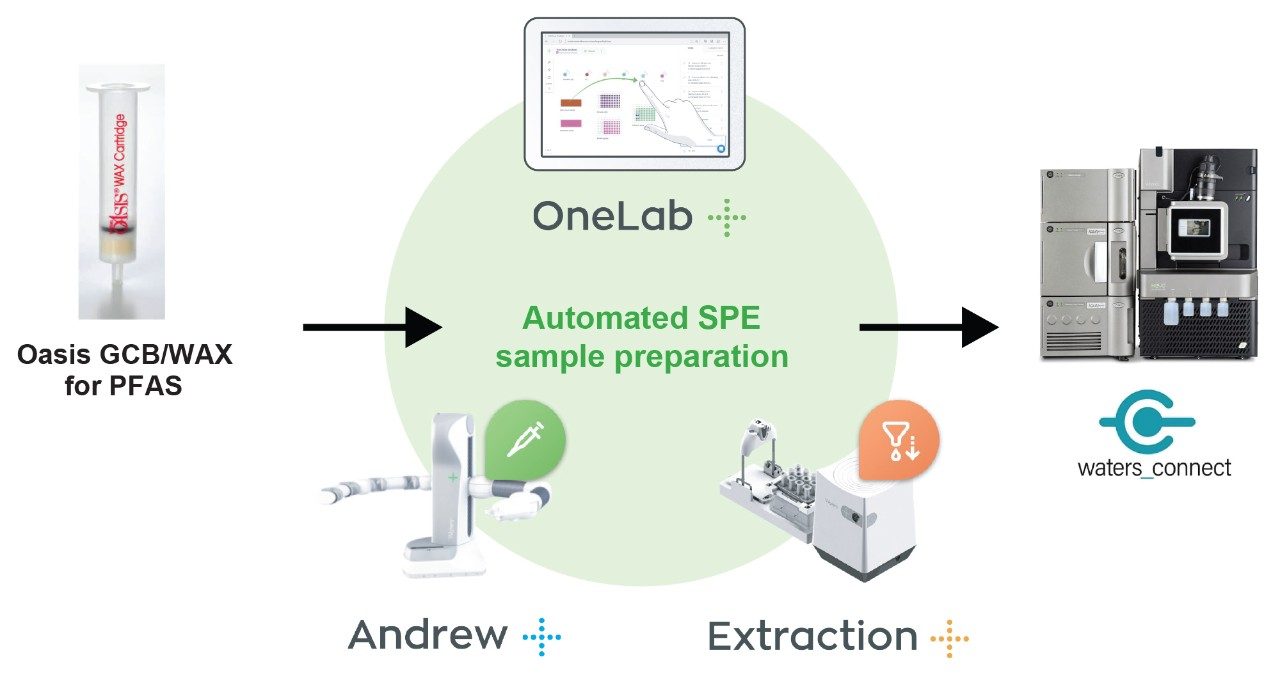
This work presents an automated workflow for the solid-phase extraction of per- and polyfluoroalkyl substances (PFAS) in milk samples using the Andrew+™ Pipetting Robot and the Extraction+™ connected device. The automation significantly reduces analyst time, minimizes experimental errors, and enhances reproducibility across users. The comprehensive PFAS workflow integrates the high sensitivity of the ACQUITY™ Premier UPLC™ System and the Xevo™ TQ Absolute MS System. Combined with the automated Andrew+ Extraction+ Robot and Oasis™ GCB/WAX SPE, the method achieved excellent recoveries of 98–110% for PFOA, PFOS, PFNA, and PFHxS. The limit of quantification (LOQ) was validated at 0.005 µg/kg in milk, meeting the requirements of EU Commission Recommendation 2022/1431.
Benefits
- Simplified creation of automation protocols through OneLab™ for consistently producing calibration standard solutions and PFAS extractions through SPE.
- Deployable OneLab automation protocol for PFAS extractions from food using bilayer GCB/WAX SPE.
- Automation of PFAS workflow saves analyst time, improves reproducibility and reduces procedural errors across multiple operators.
- Low limits of quantification (down to 0.005 µg/kg) in milk, adhering to EURL POP guidelines, and meeting EU 2022/1431.
Introduction
PFAS are a group of synthetic chemicals that have multiple fluorine atoms attached to an alkyl chain. Due to their unique properties such as high heat and chemical stability, ability to reduce surface tension of aqueous solutions, and surfactant and oleophobic nature, PFAS are used in many areas for various applications such as packaging, surfactants, and firefighting fluids. However, studies have shown potential links between PFAS exposure and detrimental health effects on humans and animals.1 Therefore, it is crucial to decrease the use and presence of PFAS in materials, particularly those that could inadvertently contaminate food. As PFAS compounds are resistant to degradation and bioaccumulate in the tissues of mammals2, they can be transferred from food products to humans through consumption. The European Food Safety Authority (EFSA) predicts food to be a predominant channel for PFAS exposure, and regulatory bodies around the world have been placing increasingly stringent regulations on the testing and monitoring of PFAS in food. Milk, being the staple food product for toddlers and children, would affect them disproportionately compared to adults, and as such it has been argued that there is a need to monitor PFAS levels in milk matrices.3
The European Recommendation 2022/2388 has set maximum levels of PFAS for PFOS, PFOA, PFNA, and PFHxS in eggs, fish meat, crustaceans, bivalve mollusks, meat and offal.4 As PFAS analysis in fruits, vegetables, milk, and baby food require sensitive methods for complex samples, the European Commission has adopted European Recommendation 2022/1431 to monitor PFAS at indicative levels in fruits, vegetables, milk, and baby food. In milk, the indicative levels are 0.020 µg/kg for PFOS, 0.010 µg/kg for PFOA, 0.050 µg/kg for PFNA, and 0.060 µg/kg for PFHxS.5
Preparing milk samples for PFAS analysis using LC-MS/MS requires many pipetting tasks and is time-consuming. Therefore, automating as many parts of the workflow as possible is beneficial for enhancing throughput and minimizing human experimental errors. Recent methods have established optimized analytical methods for the quantification of PFAS in fish, vegetable, fruit and baby food as per European Commission recommendations.6,7 Solid-phase extraction (SPE) with dual-phase graphitized carbon black (GCB) and weak anion exchange (WAX) was used to extract and concentrate PFAS in food extracts and these sample clean-up steps are amenable to automation. The use of the Andrew+ Pipetting Robot, along with the Extraction+ connected device has been used elsewhere to automate bioanalytical solid phase extraction sample preparation8, hence a similar automated workflow can be developed for the extraction of PFAS in food. The focus of this study is to build on previous work for quantifying PFAS in food matrices by incorporating automation with the Andrew+ Pipetting Robot coupled with an Extraction+ vacuum manifold and vacuum pump, with a focus on milk samples.
Experimental
Standards and Solutions
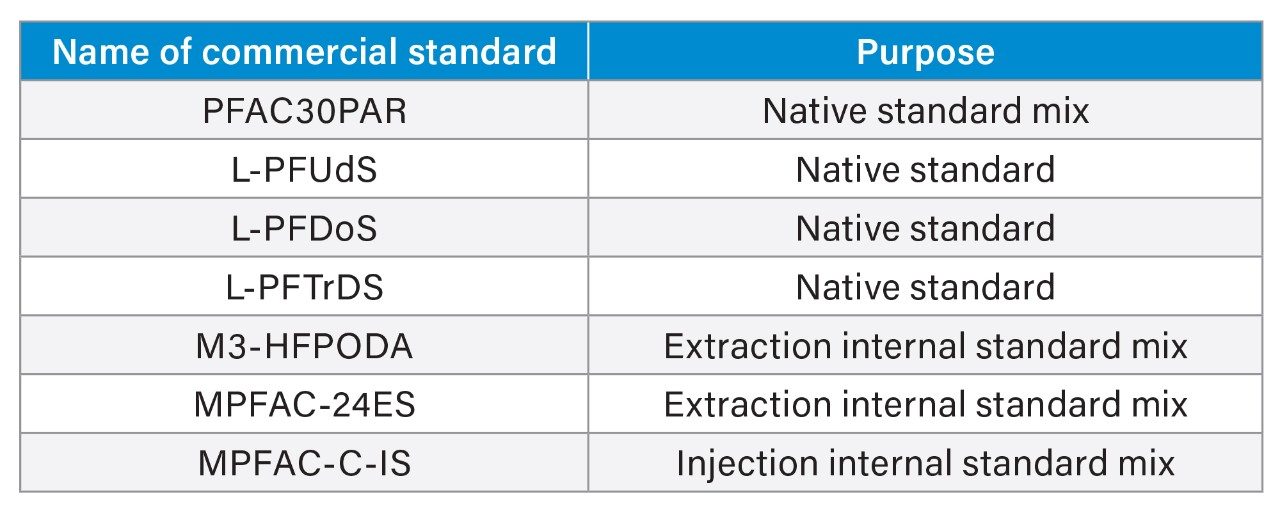
All standards were purchased from Wellington Laboratories. Standards in Table 1 were used to prepare stock solutions.
A solvent calibration curve in the range of 0.00125–5 ng/mL (equivalent to 0.00025–1 µg/kg in actual sample) was prepared and used for sample analysis.
Sample Preparation
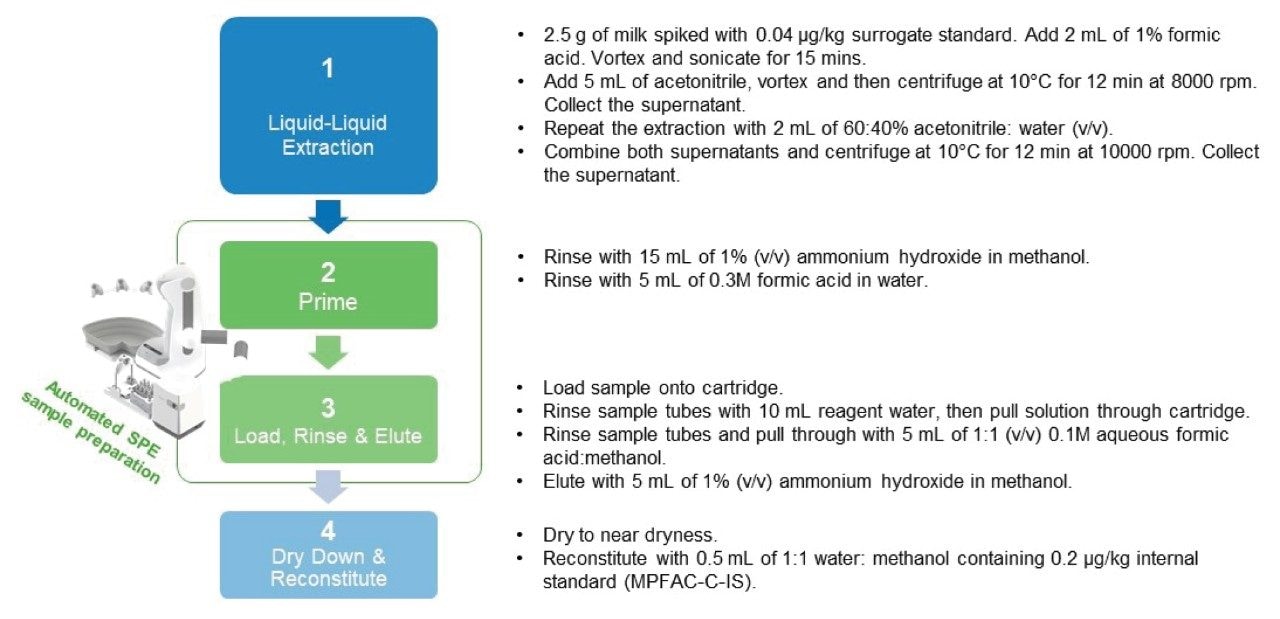
Sample preparation was carried out as shown in Figure 2. Liquid-liquid extraction of milk samples was carried out as per Rawn et. al. with slight modifications.9 2.5 g of milk samples was placed in a 15 mL centrifuge tube and spiked with Extraction internal standard (EIS) mix at a concentration of 0.04 µg/kg. 2 mL of 1% formic acid (v/v) was added, and the mixture vortexed for a few seconds, followed by sonication for 15 mins. 5 mL of acetonitrile was added, and the mixture vortexed for a few seconds followed by centrifugation at 10 °C for 12 min at 8000 rpm, and the supernatant collected. The extraction was repeated with 2 mL of 60:40% acetonitrile: water (v/v). Both supernatants were combined and centrifuged at 10 °C for 12 min at 10000 rpm. The supernatant was collected.
Oasis GCB/WAX cartridges (p/n: 186011113) were used for sample clean-up. Cartridges were primed with 15 mL of 1% methanolic ammonium hydroxide followed by 5 mL of 0.3 M formic acid in water. Milk extract was then loaded onto the cartridge. The cartridge was washed with 10 mL water and 5 mL of 1:1 0.1 M formic acid:methanol. Finally, analytes were eluted with 5 mL of 1% methanolic ammonium hydroxide, collecting the eluate in a clean 5 mL collection tube.
The eluent was evaporated to near dryness, and reconstituted with 0.5 mL of 1:1 water:methanol. Internal standards were spiked into each vial at a concentration of 0.20 µg/kg. The analytical sequence of each batch was composed of two different sets for solvent calibrants (≥6 points per each curve, excluding blank) bracketing both the incurred and fortified samples.
LC Conditions
|
LC system: |
ACQUITY Premier System with PFAS Analysis Kit |
|
Vials: |
Polypropylene autosampler vial (p/n: 186005230) |
|
Analytical column: |
ACQUITY Premier UPLC BEH™ C18, 2.1 x 50 mm, 1.7 µm (p/n: 186009452) |
|
Isolator column: |
Atlantis™ Premier BEH C18 AX 2.1 x 50 mm, 5.0 µm (p/n: 186009407) |
|
Column temperature: |
35 °C |
|
Sample temperature: |
10 °C |
|
Injection volume: |
5 µL |
|
Flow rate: |
0.3 mL/min |
|
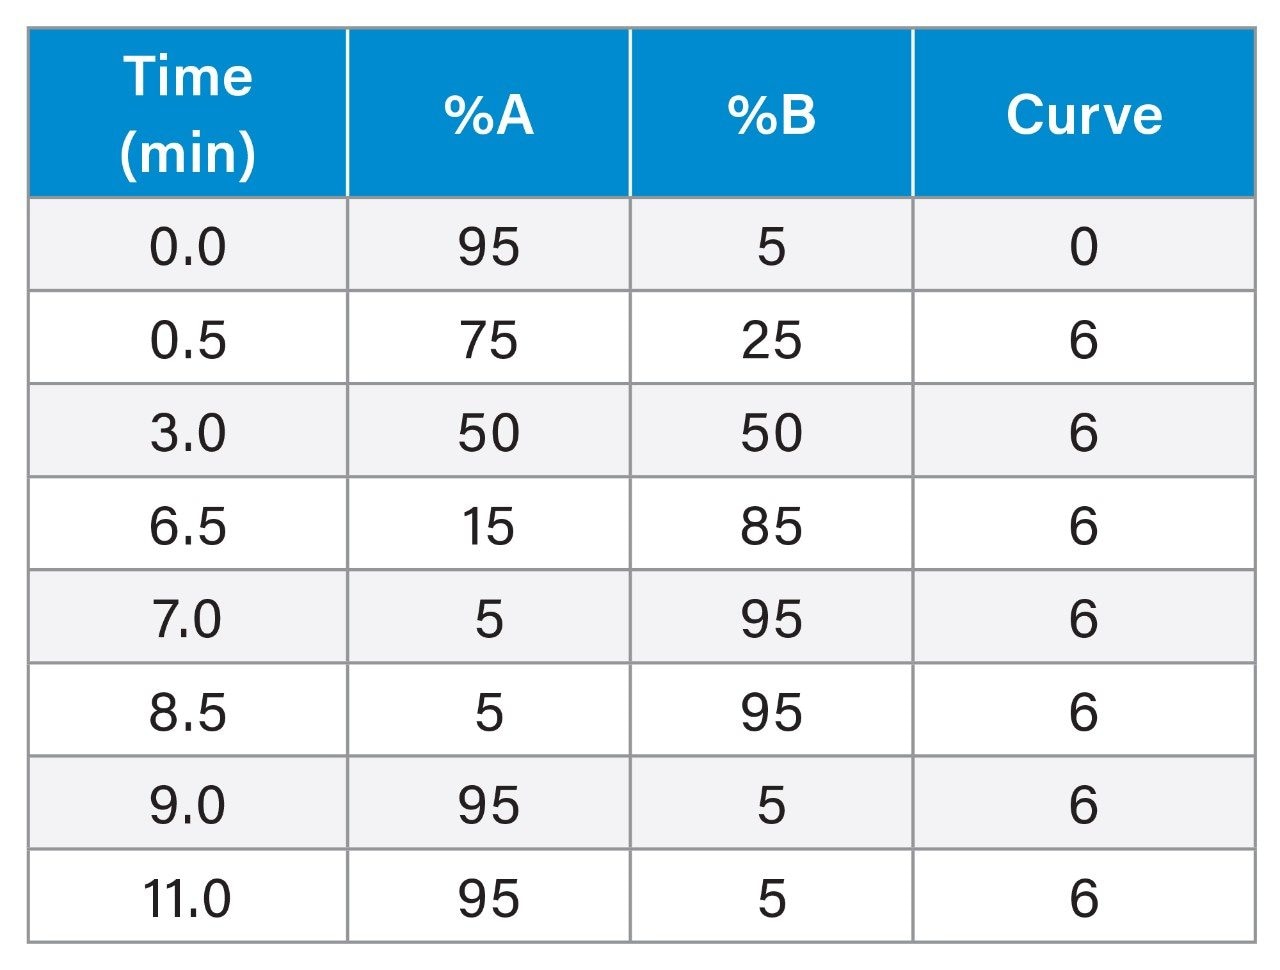
Mobile phase A: |
2 mM ammonium acetate in water |
|
Mobile phase B: |
2 mM ammonium acetate in methanol/acetonitrile 1/1 (v/v) |
MS Conditions
|
MS system: |
Xevo TQ Absolute Mass Spectrometer |
|
Ionization mode: |
Electrospray negative |
|
Source temperature: |
100 °C |
|
Capillary voltage: |
0.5 kV |
|
Desolvation temperature: |
350 °C |
|
Desolvation flow rate: |
900 L/hr |
|
Cone flow rate: |
150 L/hr |
MRM transitions were as previously described by Dreolin et. al.7
Data Management
waters_connect™ for Quantitation was used to acquire LC-MS/MS data and for processing.
Results and Discussion
Preparation of Solvent Standards for Calibration Curve with Andrew+ Pipetting Robot
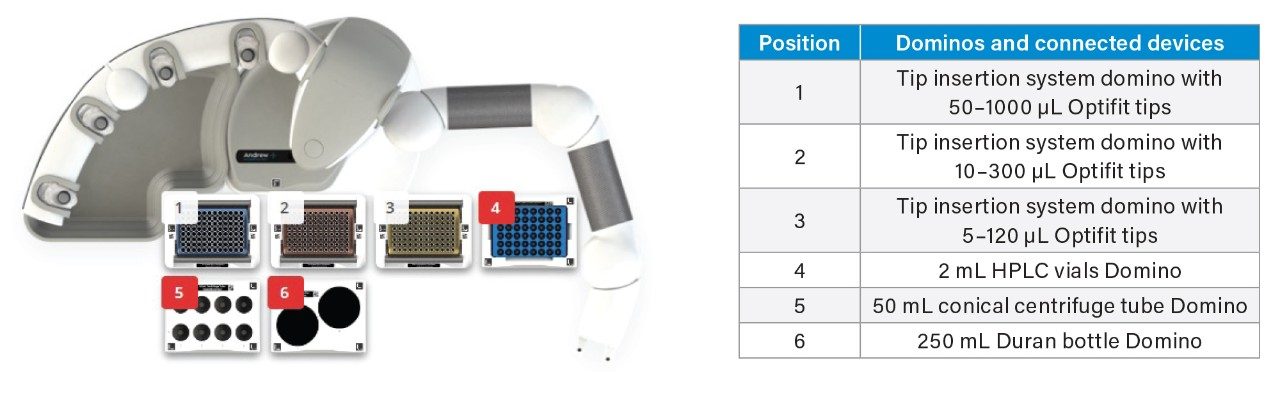
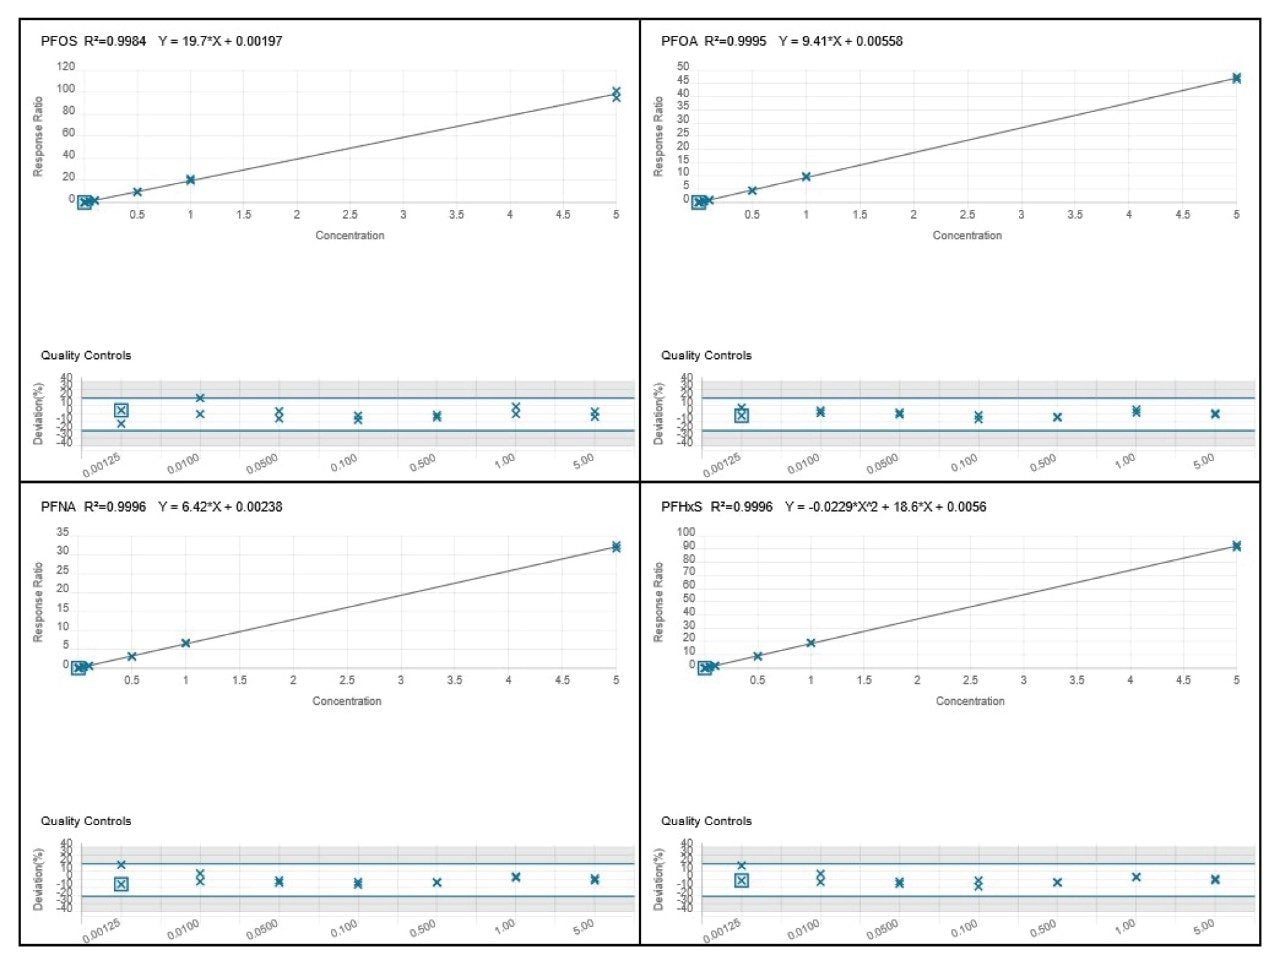
A OneLab deck setup (Figure 3) and protocol was developed to dilute stock solutions of native PFAS, and a mixture of surrogate and internal standards to create calibration standards, blanks and QC samples.10 Altogether, 101 pipetting steps were automated saving approximately 1 hr 28 mins of laboratory time. Figure 4 shows the coefficients of determination (R2) for all the calibration curves were >0.99 and residuals within ±20% for EU mandatory PFAS (PFOS, PFOA, PFNA, and PFHxS), and within ±35% for all other PFAS to be monitored, adhering to EURL POPs PFAS guidelines.11
Automated PFAS Extraction with Andrew+ Extraction+ Robot and Oasis GCB/WAX
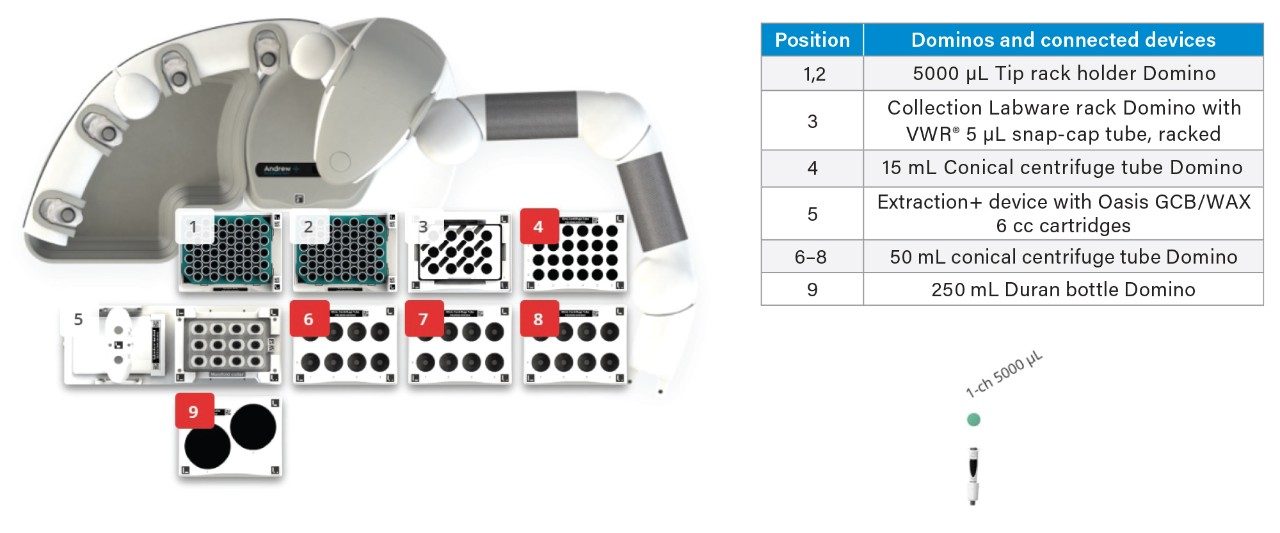
A OneLab deck setup (Figure 5) and protocol was developed to automate priming, loading, rinsing, and eluting of the sample from Oasis GCB/WAX cartridges.10 236 steps were automated, saving approximately 2 hours of laboratory time when 12 milk samples are prepared by SPE.
PFAS Contamination Minimization with Automated PFAS Extraction Workflow
Environmental PFAS contamination is minimized through the design of the extraction manifold, and automated steps programmed into the workflow. Eluent from Oasis GCB/WAX cartridges drip straight into collection tubes with no contact with surfaces, therefore minimizing surface transfer of PFAS contamination. In addition, methanol rinse steps for all pipette tips are programmed into the automated workflow which ensures that tips are clean of PFAS before pipetting solutions. A comparison between automated and manual extractions was done on process blanks and spiked water to evaluate the suitability of the Andrew+ Extraction+ Robot for PFAS extractions (Figure 6). No notable differences were seen in process blanks and water spiked with 0.005 ug/kg native PFAS. As previously reported, PFBA is present in process blank samples at high levels and is attributed to solvent contamination. PFBS, PFHxA, PFPeA, PFOA, and ADONA contamination, attributed to solvent purity, were observed in process blanks for both Andrew+ Extraction+ and manual extractions but was less than 30% of 0.005 µg/kg native spiked PFAS, adhering to EURL POPs PFAS guidelines.11
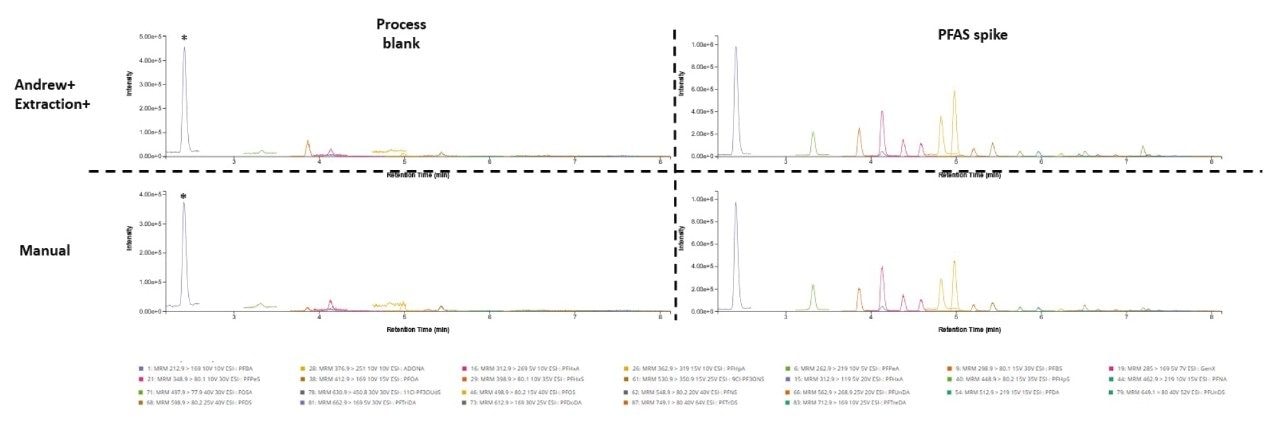
* denotes PFBA contamination in process blank
Maximizing PFAS Recovery with Automated PFAS Extraction Workflow
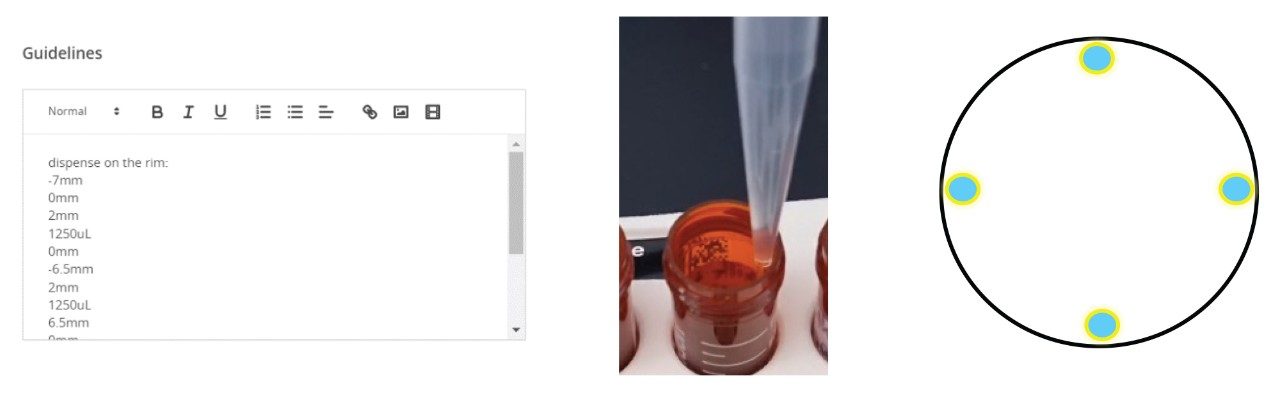
To maximize the recovery of PFAS that might adhere to the walls of the sample tube, the protocol makes use of a script within ‘Guidelines’ to wash the inside of the sample tubes (Figure 7). By specifying 4 points along the inside of the sample tubes, solvent is dispensed at these points allowing wash solvents to run down the sides of the tubes to collect as much PFAS as possible. Thereafter, a mixing step is introduced to allow wash solvents to be thoroughly agitated in the sample tube, and the wash solvents are then applied to the Oasis GCB/WAX cartridge to be pulled through.
Optimizing Extraction+ Negative Pressure Profile to Maintain Consistent Flow
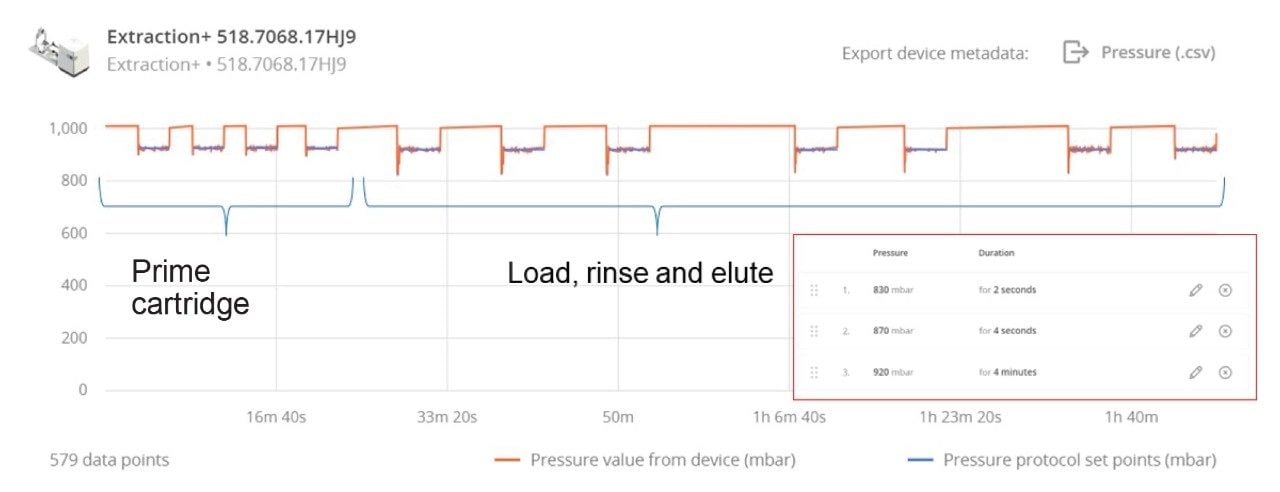
Each solvent pull-through step is programmed to have a stepwise pressure differential with a higher pressure difference at the beginning, which is then reduced after a few seconds (Figure 8). This kickstarts the solvent pull-through and allows it to be pulled through in a drip-wise manner. During sample loading and the subsequent solvent addition steps, matrix build up hinders flow through the Oasis GCB/WAX cartridge. The OneLab software allows different pressure differentials to be specified at each stage of the extraction, therefore after sample are loaded onto the cartridges, a higher-pressure differential is applied at the beginning of the pull-through step and the total amount of time for the pull-through is increased to maintain flow through the cartridges (Figure 8). This combination of pressures was found to attain the optimal flow through the cartridges.
Method Validation
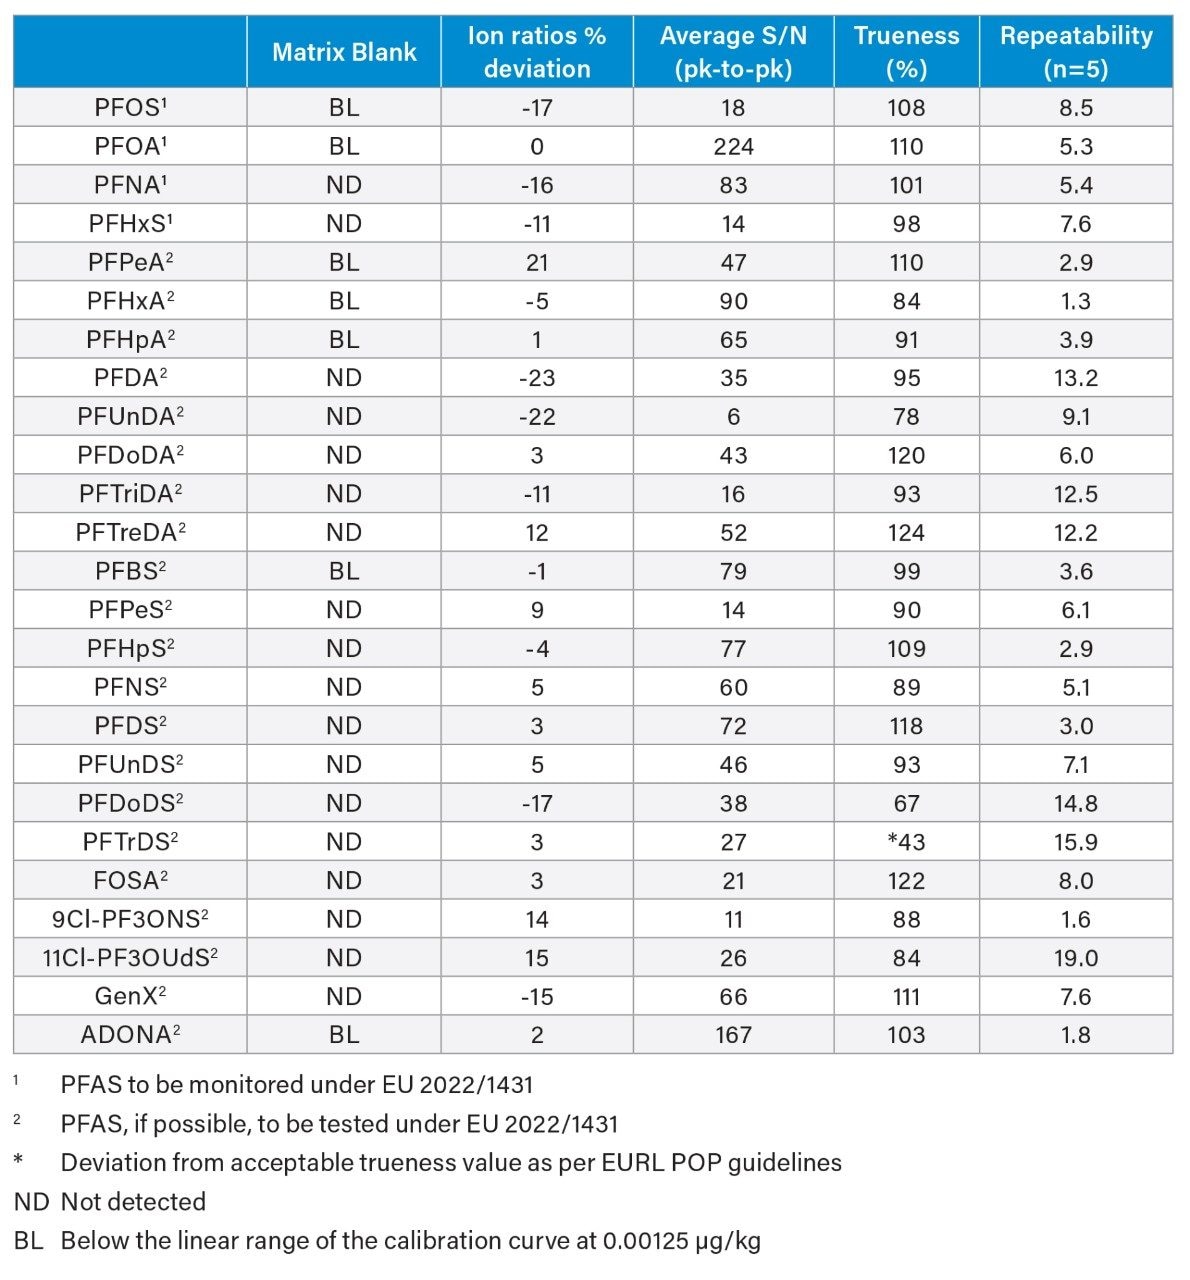
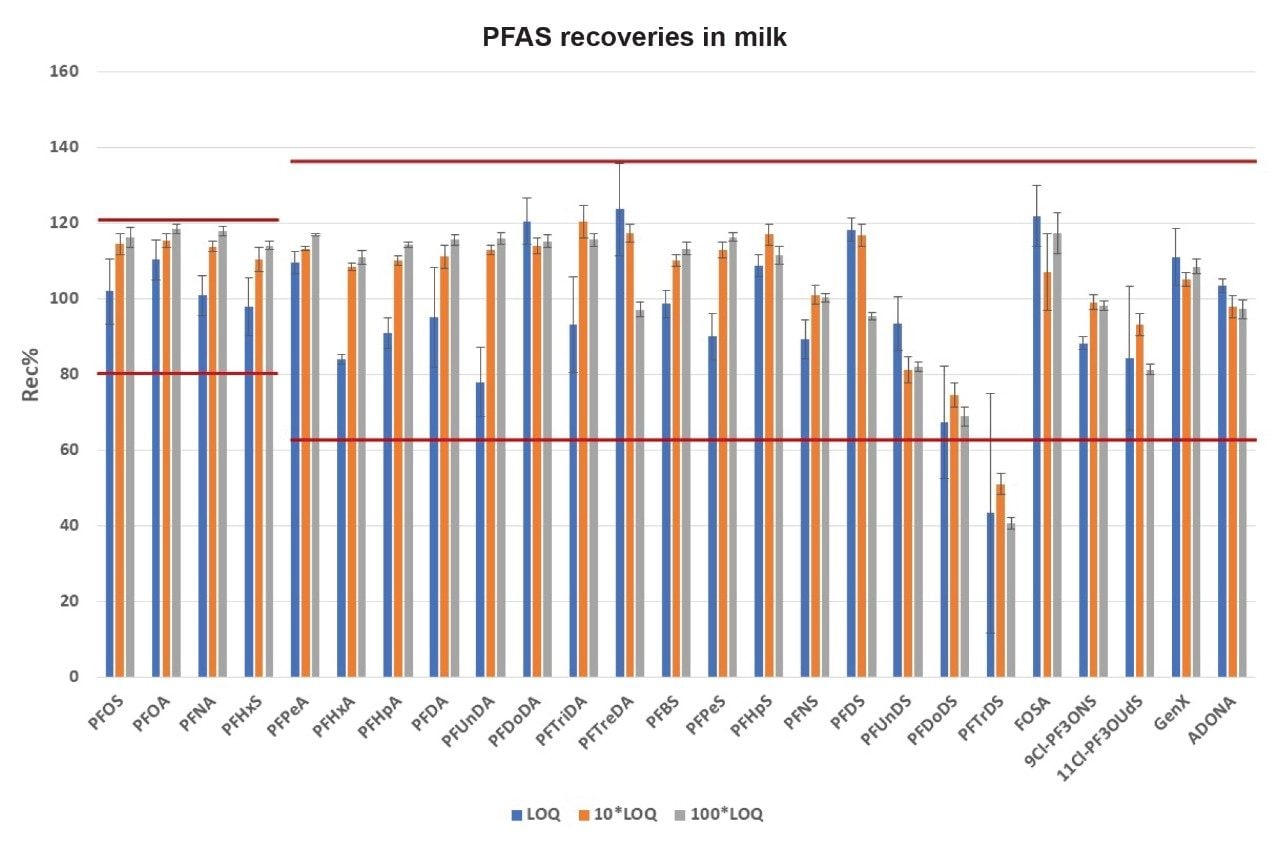
In EU 2022/1431, indicative levels for PFOS, PFOA, PFNA, and PFHxS in milk are 0.020, 0.010, 0.050, and 0.060 µg/kg, respectively. A recent application note has shown that the method LOQs in vegetable, fruit, and baby food range from 0.0005 to 0.005 µg/kg.7 Building on that work, milk matrices were validated at an LOQ of 0.005 µg/kg using the EURL POP Guidance document on PFAS in Food and Feed for the following parameters for identification, trueness and precision: Identification using 2 product ions with ion ratio within ± 30% of calibration standards and signal-to-noise ratio ≥ 3; trueness ± 20% for compliance testing and ± 35% for monitoring purposes ; and precision ≤ 20% for compliance testing and ≤ 25% for monitoring purposes. Fresh cow’s milk was fortified with PFAS at 1x target LOQ (0.005 µg/kg), 10x target LOQ (0.05 µg/kg) and 100x target LOQ (0.5 µg/kg). All PFAS species, apart from PFTrDS, fulfilled the validation requirements at 0.005 μg/kg (Table 3). When considering the entire panel of native PFAS together, mean percentage recovery across all fortification levels was 102 ± 18% for milk (min = 40.6%, max = 123.6%). For the four mandatory compounds for monitoring, PFOS, PFOA, PFNA, and PFHxS, apparent recoveries were between 98 and 118%. (Figure 9). The poor apparent recovery of PFTrDS for all conditions was due to M2 PFTreDa being used as an extraction internal standard, with both analytes responding differently in milk matrix during extraction, indicating the need for corresponding stable labelled isotopes for all PFAS species.
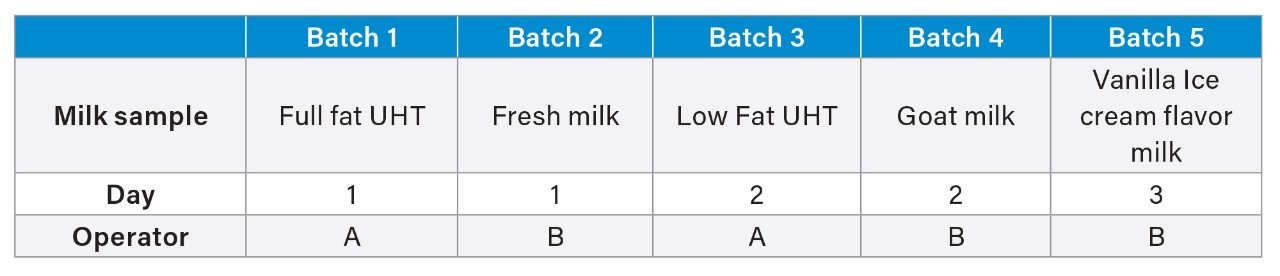
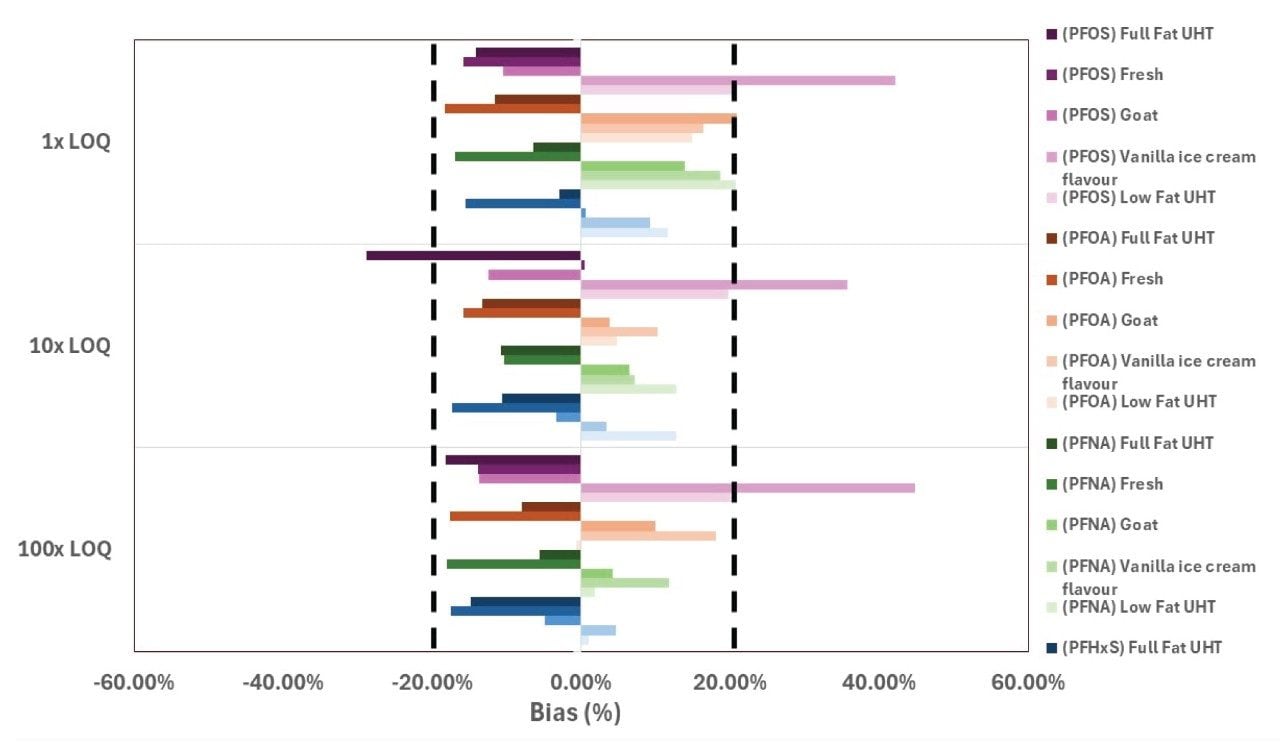
The use of automation improves efficiency and reduces errors especially in laboratories with multiple operators. A within-laboratory matrix group validation was carried out with 2 operators, over 3 non-consecutive days, and with 5 different milk matrices (Table 4). Each milk matrix was fortified at 1x target LOQ (0.005 µg/kg), 10x target LOQ (0.05 µg/kg), and 100x target LOQ (0.5 µg/kg) in duplicates. Where PFAS compounds were found in matrix blanks, blank subtraction was used to calculate recoveries. For PFOS, PFOA, PFNA, and PFHxS, most of the apparent recovery values were within ±20% of the expected values. However, PFOS at 10x target LOQ in full fat UHT milk (71.1%), and 1x target LOQ (142.2%), 10x target LOQ (135.7%) and 100x target LOQ (144.8%) in vanilla ice-cream flavor milk were not within ±20% of the expected values (Figure 10). Vanilla ice cream flavor milk is heavily processed, and the results suggests that heavily processed milk will need extra sample pre-preparation steps to reduce any potential interferences with PFAS.
Conclusion
In this study, an automated workflow using the Andrew+ pipetting Robot coupled with the Extraction+ vacuum manifold and vacuum pump was developed to extract PFAS in milk samples using Oasis GCB/WAX bilayer cartridges. It was shown that automation improves efficiency in sample preparation and reduces errors associated with repetitive processes in laboratories with multiple operators. The automated workflow includes creating calibration standard solutions, blanks and QC samples, and PFAS extraction through Oasis GCB/WAX SPE cartridges. Automated steps are programmed to minimize environmental PFAS contamination and maximize recovery of PFAS from samples. For 12 milk samples, approximately 337 pipetting steps are automated, saving approximately 3.5 hours of analyst time. In addition, the use of automation improves efficiency and reduces errors especially in laboratories with multiple operators. The extracted samples were analysed with enhanced sensitivity using an ACQUITY Premier UPLC System coupled with Xevo TQ Absolute MS System, which gave excellent recoveries of 98–110% for PFOA, PFOS, PFNA, and PFHxS, and the LOQ was validated at 0.005 µg/kg in milk that meets EU Commission Recommendation 2022/1431.
References
- National Toxicology Program (2016). NTP monograph on immunotoxicity associated with exposure to perfluorooctanoic acid or perfluorooctane sulfonate. https://ntp.niehs.nih.gov/sites/default/files/ntp/ohat/pfoa_pfos/pfoa_pfosmonograph_508.pdf
- Xing Y., Zhou Y., Zhang X., Lin X., Li J., Liu P., Lee H.K., Huang Z. The sources and bioaccumulation of per- and polyfluoroalkyl substances in animal-derived foods and the potential risk of dietary intake. Sci Total Environ. 905:167313. doi: 10.1016/j.scitotenv.2023.167313. Epub 2023 Sep 22. PMID: 37742961.
- LaKind J.S. Invited Perspective: PFAS in Breast Milk and Infant Formula-It's Time to Start Monitoring. Environ Health Perspect. 131(3):31301. doi: 10.1289/EHP12134. Epub 2023 Mar 2. PMID: 36862173.
- Commission Regulation (EU) 2022/2388, amending Regulation (EC) No 1881/2006 as regards maximum levels of perfluoroalkyl substances in certain foodstuffs, L 316/38, 8.12.2022.65.
- Commission Recommendation (EU) 2022/1431, on the monitoring of perfluoroalkyl substances in food. L 221/105, 26.8.2022.
- Adams S., Dreolin N., Organtini K., Hancock P. Analysis of Per- and Polyfluoroalkyl Substances (PFAS) in Animal Products with an Enhanced Sensitivity LC-MS/MS Method using Fish Reference Materials as a Case Study. Waters Application Note. 720008108, October 2023.
- Dreolin N., Adams S., Organtini K., Hird S., Burt O. Analysis of 28 EU Regulated and Recommended PFAS in Food via LC-MS/MS – Part 1: Vegetable, Fruit, and Baby Food. Waters Application Note. 720008219, February 2024.
- Danaceau J.P, Trudeau M. Fully Automated Bioanalytical Solid Phase Extraction Sample Preparation, using Extraction+ Connected Device with the Andrew+™ Pipetting Robot. Waters Application Note. 720007712, September 2022.
- Rawn D.F.K, Dufresne G., Clément G., Fraser W.D., Arbuckle T.E. Perfluorinated alkyl substances in Canadian human milk as part of the Maternal-Infant Research on Environmental Chemicals (MIREC) study. Sci Total Environ.831:154888. doi: 10.1016/j.scitotenv.2022.154888. Epub 2022 Mar 30. PMID: 35367260.
- Automation of PFAS Samples in Milk Matrices using SPE. OneLab Library Protocol.
- EURL for halogenated POPs in feed and food: Guidance Document on Analytical Parameters for the Determination of Per- and Polyfluoroalkyl Substances (PFAS) in Food and Feed, version 1.2 of 11 May 2022.
720008740, April 2025