Analysis of mRNA Cap Impurity Profiles and Capping Efficiency Using RapiZyme™ MC1 Ribonuclease
Balasubrahmanyam Addepalli, Tatiana Johnston, Catalin Doneanu, Jamuna Vaishnav, Alexandre Gomes, Christian Reidy, Ying Qing Yu, Matthew A. Lauber
Waters Corporation, United States
Published on June 03, 2025
Abstract
Messenger RNA is an emerging modality to treat human diseases through gene therapy applications and novel cancer treatments. Identity, nucleotide sequence and modifications at the 5’-cap and 3’ poly(A) tail are among several CQAs (critical quality attributes) that determine the functional success of an mRNA drug substance. The 5’-cap directly affects the mRNA translation efficiency and stability of the molecule. While the nucleotide sequence can be determined through both direct (oligonucleotide mapping) and indirect (next generation sequencing - NGS) methods, the extent of 5’-capping in the mRNA population requires a direct method and very often a separate step of sample preparation. This time consuming and specialized procedure involves RNase H or DNAzyme mediated cleavage of RNA combined with the purification of the 5’ digestion component impurities in the resulting sample is then subsequently analyzed by liquid chromatography coupled with UV detection and/or mass spectrometry (LC-MS). Such a time consuming procedure hinders speedy characterization of an mRNA molecule during development and QC release testing. Here, we demonstrate the utility of RapiZyme MC1 for characterization of 5’-cap species with high confidence, so that the capping efficiency of the drug substance can be easily assessed along with oligonucleotide mapping.
Benefits
- Identification of 5’-capped oligonucleotides including their impurities in the RapiZyme MC1 digest of mRNA
- Simple and reproducible protocol for detection of 5’-capped oligonucleotides
- No separate sample preparation procedure involving sequence-specific probes or specialized procedures
- Capability to obtain capping efficiency information from oligonucleotide mapping data using the INTACT Mass and CONFIRM Sequence applications in the waters_connect™ Software
- Ability to decipher manufacturer/technology specific mRNA-capping impurity profiles
Introduction
Development of RNA therapeutics to treat human diseases was accelerated by the successful use of mRNA vaccines against SARS-CoV-2. Faster and effective deployment of mRNA for various treatments requires analytical labs to keep pace with improved methods for confirming identity, purity, and sequence modifications of drug substance. The 5' end of mRNA is modified to include a 7-methylguanosine nucleotide in a 5’-5’ linkage to a penultimate nucleotide that itself is also methylated at the 2’ position of the ribose sugar (Figure 1a). The entire structure m7GpppNm is referred to as the 5’-cap.1–3 The cap is added either to the previously synthesized transcript or incorporated by co-transcriptional capping to produce modified mRNA. The presence of the 5’- cap is an essential functional requirement for efficient translation of the protein coding sequence and minimizing a patient’s immune response. Thus, it is important to measure the extent of cap incorporation, in addition to confirming identity, sequence and poly(A) tail length/distribution. An mRNA drug substance can contain fully capped, incomplete cap or no cap, and documentation of their amounts is a requirement for regulatory approvals.
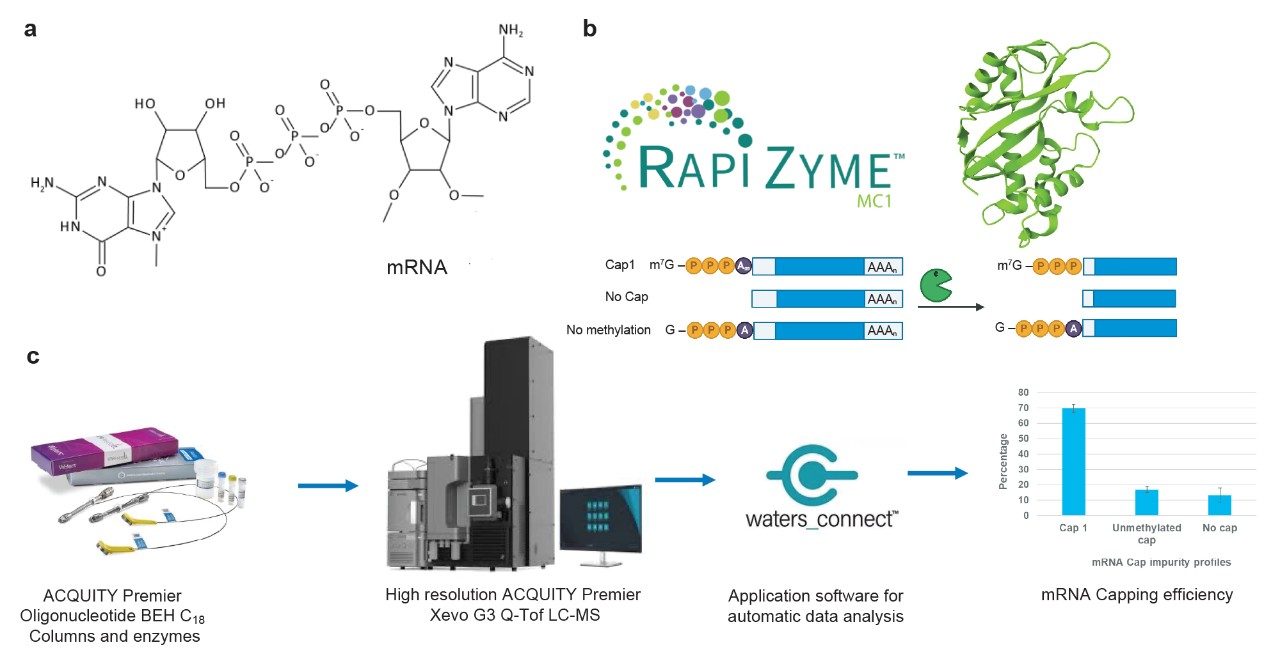
Traditionally, mRNA cap analysis is performed via the selective generation and enrichment of 5’ end digestion products, and their subsequent analysis by LC-UV and/or LC-MS (liquid chromatography coupled with mass spectrometry). This process involves the use of a custom-designed ribozyme/DNAzyme or RNase H guided by a DNA hybridization probe.4 The resulting digestion products (ranging from 5 to 30 nt) are subsequently analyzed by denaturing gel electrophoresis or LC-MS.5 RNA sequence identification through oligonucleotide mapping can theoretically be applied to detecting capped digestion products. However, a comprehensive analysis can be impractical to achieve if an analyst is restricted to using RNase T1, because it generates undesirably short digestion products (<5 nt) throughout the G-rich sequences common to 5’ untranslated regions (5’ UTRs) sequences. Here, we report the use of RapiZyme RNase MC1 (Figure 1b) to determine the capping efficiency of enzymatically synthesized mRNA from data originally generated for sequence confirmation.6,7 RapiZyme RNase MC1 facilitates an all-in-one analysis because its uridine-specific cleavages generate longer digestion product from the G-rich sequences near the 5’-cap (Figure 1b). As such, MC1-mediated cleavages preserve the cap structure and the associated cap impurities in RNA digestion products that are easily retained and detected via IPRP-LC-MS. Acquiring data through a reversed phase column with bioinert high performance surface to prevent nonspecific adsorption, high mass accuracy data through a high resolution mass spectrometry, and faster data analysis with a waters_connect based applications enable quicker characterization of mRNA cap profiles (Figure 1c) in the mRNA oligo mapping experiments . Being able to determine capping efficiency while also confirming identity, sequence and polyA tail lengths should provide a boost in project efficiency and the industry’s ability to further accelerate the development of mRNA therapeutics.
Experimental
Dipropylethylamine (DPA, 99% purity, catalog# D214752-500ML, Millipore Sigma (St Louis, MO)) and 1,1,1,3,3,3-hexafluoro-2-propanol (IonHanceTM HFIP, Waters PN:186010781) were used. Methanol (LC-MS grade, catalog# 34966-1L) was obtained from Honeywell (Charlotte, NC). HPLC grade Type I deionized (DI) water was purified using a Milli-Q™ system (Millipore, Bedford, MA). Mobile phases were prepared fresh on the day of usage. Ultrapure nuclease-free water (catalog# J71786.AE) for mRNA digestions was purchased from Thermo Fisher Scientific (Waltham, MA).
mRNA digestion:
mRNA: A custom-made mRNA (mRNA 1) with a proprietary sequence was synthesized and purified by Biosynthesis (Lewisville, TX). The sequence contains all the elements of therapeutic mRNA such as a 5’-cap, 5’ UTR (untranslated sequence), open reading frame (ORF, with start and stop codon), 3’ UTR and a poly(A) tail. The mRNA was shipped to the analysis facility after purification, aliquoting and lyophilization. Partial sequence of mRNA1 with the 5’-cap is: 5’-m7GpppAmGGGAGACCCAAGCUUGGUAC----.
GFP mRNA sequence with unmodified uridine (SC8888) was purchased from GenScript (Pisctaway, NJ) and used after resuspension in RNAse free water.
Digestion of mRNA with RNase T1:
10 µg (1 µg/µL) of mRNA 1 was exposed to 90 °C for 2 min and cooled on ice for 2 minutes. Approximately 250 U of RNase T1 (Worthington p/n: LSO1492) in 10 µL of 200 mM ammonium acetate was added to the RNA sample, mixed by vortexing and centrifugation. After incubation at 37 °C for 90 min, the digestion mix was subjected to LC-MS analysis.
Digestion of mRNA with RapiZyme RNase MC1 (Waters p/n: 186011190):
10 µg (1 µg/µL) of mRNA 1 or GFP mRNA was exposed to 90 °C for 2 min and cooled on ice for 2 minutes. Approximately 150 U of RNase MC1 (Waters p/n: 186011190) in 10 µL of 200 mM ammonium acetate was added to the RNA sample, mixed by vortexing and centrifugation. After incubation of the digestion mix at 30 °C for 60 min, the enzyme was inactivated by heating at 70 °C for 15 min before subjecting it to LC-MS analysis. Both mRNAs share the identical 5’-UTR and the sequence is proprietary.
Ion pairing Liquid Chromatography (IP-RP-LC) conditions
|
LC-MS system: |
Xevo G3 QTof LC-MS with ACQUITY Premier System with binary solvent manager |
|
Column: |
ACQUITY Premier Oligonucleotide BEH C18 FIT Column 130 Å, 1.7 µm, 2.1 x 150 mm, (p/n: 186010687) |
|
Column temperature: |
60 °C |
|
Flow rate: |
300 µL/min |
|
Mobile phases: |
Mobile phase (MP) A: 10 mM DPA (dipropylethylamine), 40 mM HFIP (1,1,1,3,3,3-hexafluoroisopropanol) in DI water, pH 8.5 MP B: 10 mM DPA, 40 mM HFIP in 50% methanol |
|
Sample temperature: |
8 °C |
|
Sample vials: |
QuanRecovery™ Vials with MaxPeak™ HPS (p/n: 186009186) |
|
Injection volume: |
5 µL |
|
Wash solvents: |
Purge solvent: 50% MeOH Sample Manager wash solvent: 50% MeOH Seal wash: 20% acetonitrile in DI water |
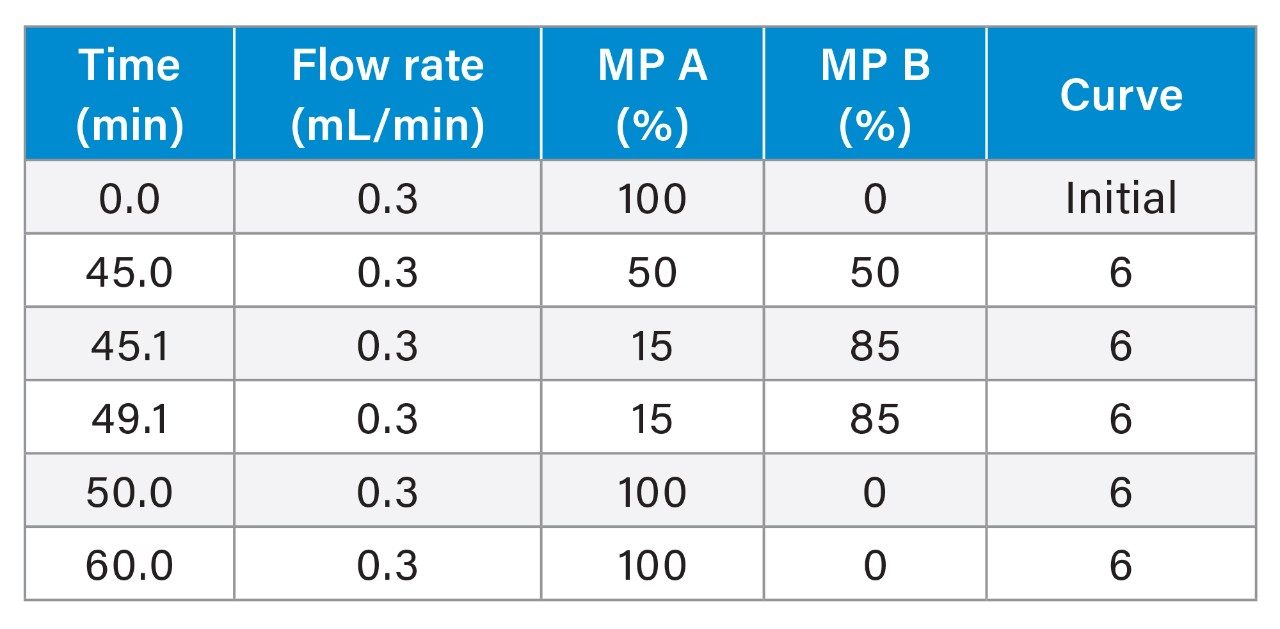
Gradient Table
Other Mobile phase conditions used in the study
|
Mobile phase A: |
0.1% N,N-diisopropylethylamine (DIPEA), and 1% (v/v) IonHance HFIP (p/n:186010781) in DI water |
|
Mobile phase B: |
0.0375% DIPEA and 0.075% (v/v) IonHance HFIP in 55:10:35 Acetonitrile:Methanol:DI water |
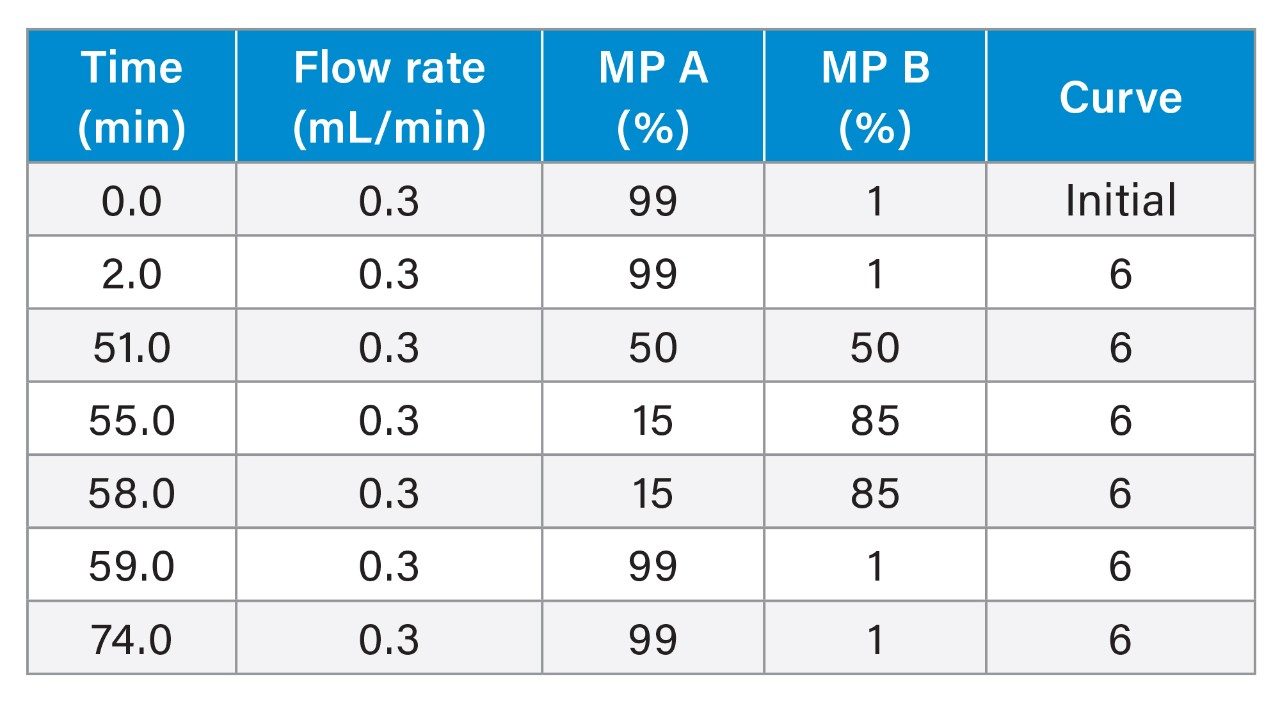
Gradient Table
MS Conditions
|
MS system: |
Xevo G3 QTof Mass Spectrometer or Vion™ IMS QTof MS |
|
Ionization mode: |
ESI- |
|
Acquisition mode: |
MSE |
|
Acquisition rate: |
1 Hz |
|
Capillary voltage: |
2.5 kV |
|
Cone voltage: |
40 V |
|
Source offset: |
60 V |
|
Source temperature: |
120 °C |
|
Desolvation temperature: |
550 °C |
|
Cone gas flow: |
50 L/h |
|
Desolvation gas flow: |
600 L/hr |
|
TOF mass range: |
340–4000 (MSE acquisition) |
|
Low energy CE: |
6 V |
|
High energy CE ramp: |
25 to 50 V or 10–80 V |
|
Lock-mass: |
50 pg/µL Leu Enk |
|
Data acquisition: |
waters_connect Software 3.6.0.21 |
|
Data processing: |
waters_connect Software 3.6.0.21 mRNA Cleaver 1.1.0 |
Data analysis
In silico digestion of mRNA sequences was performed with mRNA cleaver by choosing a cap 1 (m7GpppNm) as a modification and AGGGAGACCCAAGCUUGGUACCGA as the input sequence. Similarly, other cap impurities including unmethylated cap impurity GpppN and other intermediate species for 5’-end oligonucleotide as well as no cap were evaluated for their presence in the LC-MS data. Minimum length of digestion product was 1 for RNase T1 and 3 for RNase MC1. A mass error of <20 ppm was chosen to score the presence of the identified digestion product in the MS1 analysis. CONFIRM sequence application (waters_connect Software) was also employed to reconstruct the nucleotide sequence of the oligomer from fragmentation products. INTACT Mass application was also employed to identify the oligonucleotides.
Results and Discussion
Cap Oligonucleotides Detection in RNase T1 Digest
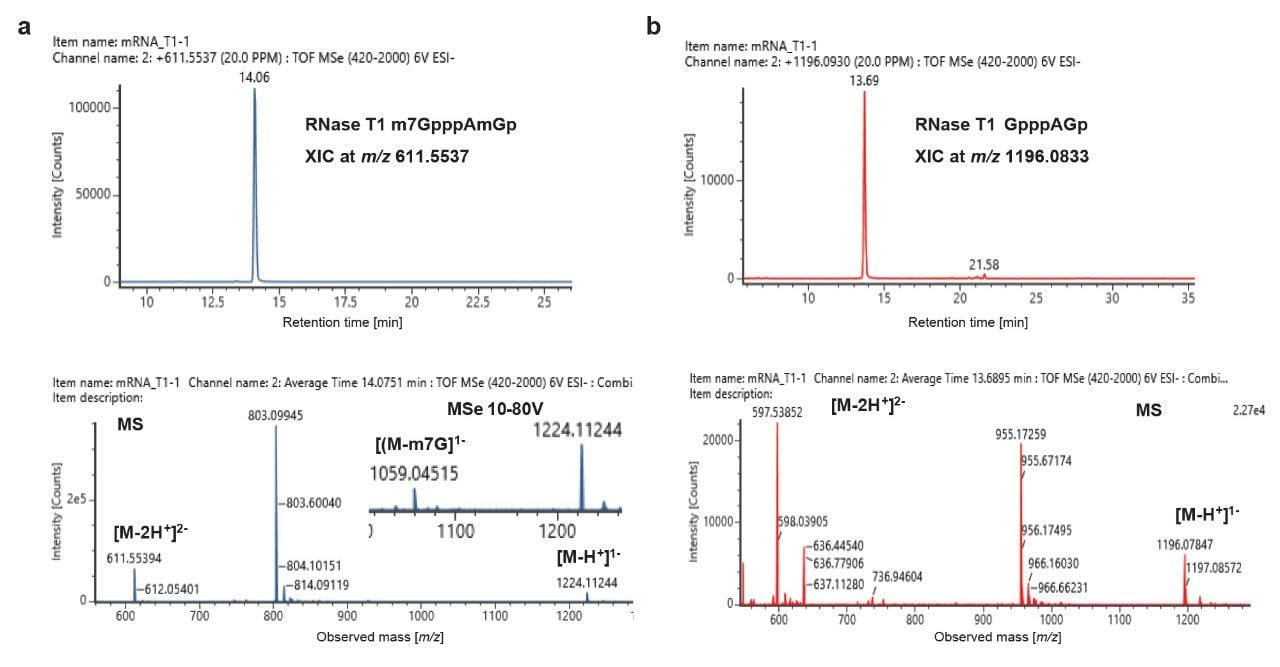
The presence of the 5’ cap in mRNA1 was initially confirmed by scoring the cap-specific RNase T1 digestion product, m7GpppAmGp (p stands for linear phosphate) with m/z 1224.112 (z = -1) and 611.5539 (z = -2) at 14.06 min (Figure 2a top panel). Further, a signature fragment ion with m/z 1059.0534 corresponding to the loss of m7G (M-165 Da) was also confirmed, which is useful approach for confirming the identification of a capped oligonucleotide precursor. (Figure 2a bottom panel). Similarly, an unmethylated cap analog of this same digestion component, GpppAGp, was identified with m/z 1196.0833 (z = -1), 597.3752 (z = -2) at 13.69 min (Figure 2b). This is labeled as cap impurity 1. The uncapped digestion component cannot be determined in the RNase T1 digest, because the resulting product is a single nucleotide (Gp) and is indistinguishable from digestion components generated from multiple other locations in the mRNA sequence. Thus, the capping efficiency or the extent of cap incorporation into the mRNA cannot be deciphered from the LC-MS data of RNase T1 digest.
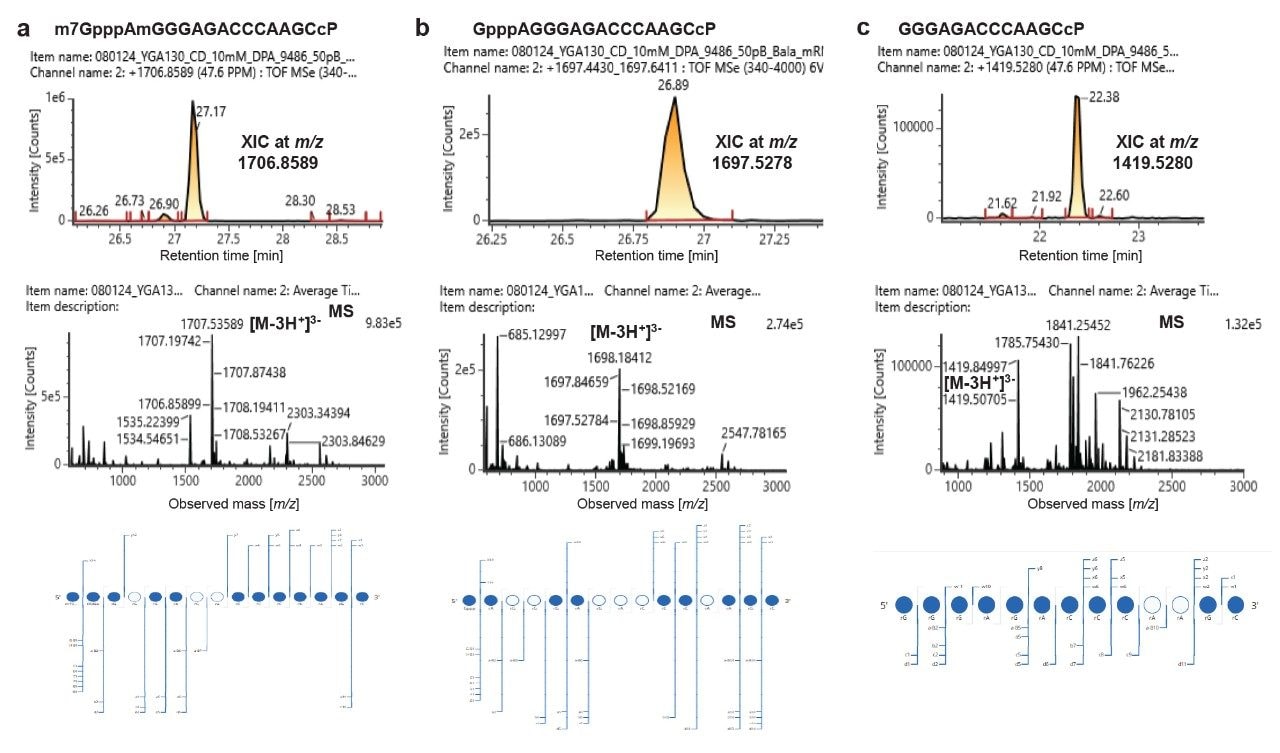
5’ Cap Digestion Components Comprehensively Detected in RNase MC1 Digests
LC-MS analysis of the RNase MC1 digest of mRNA 1 revealed the presence of three different forms of this molecule’s 5’ terminus (Figure 3). The first one corresponds to a fully capped digestion component with m/z 1706.8589 (z = 3), which can be attributed to m7GpppAmGGGAGACCCAAGCcP at 27.17 min (Figure 3a). Meanwhile, an unmethylated cap species (GpppAGGGAGACCCAAGCcP; m/z 1697.5278) was detected at 26.89 min (Figure 3b) and an no cap form (GGGAGACCCAAGCcP; m/z 1419.5280) was identified at 22.38 min (Figure 3c). The observed retention time for each oligo is consistent with the inherent hydrophobic nature of the oligonucleotide where the methylated version of the cap is predicted to be retained longer than the unmethylated version. The digestion component containing no cap eluted earlier than the other forms, as is consistent with the lack of the triphosphate bond and reduced ion pair mediated retention. Importantly, this sequence is unique to the 5’-end of mRNA and is not represented in the rest of the sequence, so unambiguous relative quantitation can be performed. These 5’ termini digestion products are the result of efficient cleavage of a CpU bond (indicated by an arrow: m7GpppAmGGGAGACCCAAGC↓UUGGU NNN). Interestingly, the digestion product, m7GpppAmGGGAGACCCcP corresponding to C↓A cleavage was not detected in the LC-MS injection. No other cap impurities were detected. The detection of the above mentioned digestion components supports the suitability of RapiZyme RNase MC1 for 5’-cap analysis of mRNAs.
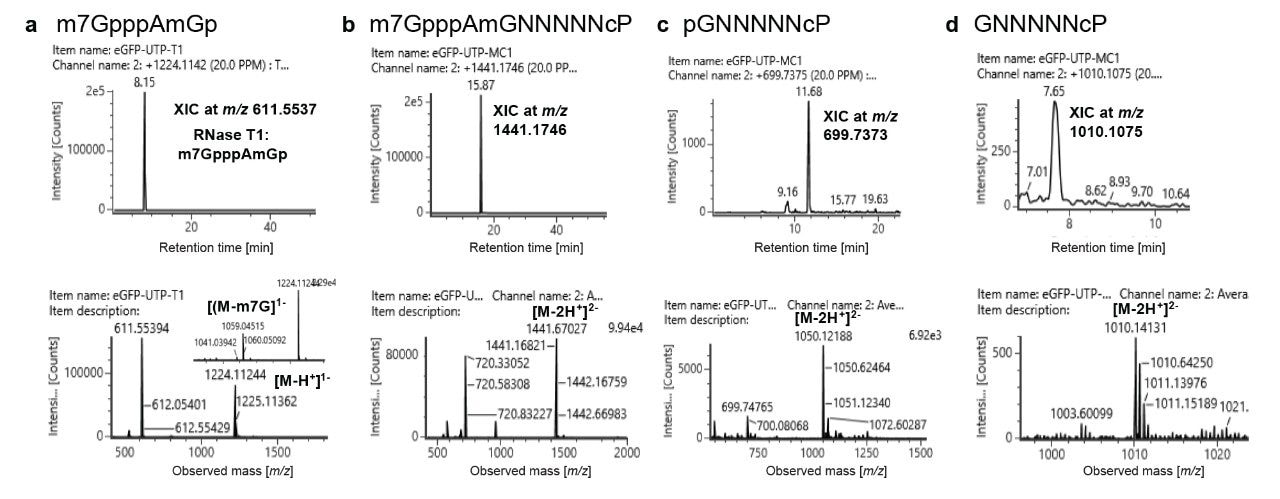
5’ Cap Characterization of a Catalog GFP mRNA
To further test the applicability of the above-described approach for 5’-cap analysis, GFP (Green Fluorescent Protein) mRNA was analyzed in the same fashion by digesting each with RNase T1 and RNase MC1 (Figure 4). Since the 5’-UTR sequence is proprietary in this example, only the observed m/z values corresponding to fixed oligonucleotide size are indicated. Each nucleotide is represented by N. Digestion with RNase T1 revealed the capped oligonucleotide (m7GpppAmGp) with identical mass values as shown in Figure 2a. Interestingly, an unmethylated version of the cap was not detected in these mRNAs. Digesting the mRNA with RNase MC1 revealed the presence of capped oligonucleotide m7GpppAmGNNNNNcP with m/z 1441.1746 (Figure 4b). No mass values corresponding to the unmethylated version was detected in these mRNA digests. Notably, two versions of uncapped oligonucleotide differing in the presence or absence of 5’-phosphate were identified in the digest. They include pGNNNNNcP with m/z 1050.1218 (Figure 4c) and GNNNNNcP with m/z 1010.1075 (Figure 4d). No other intermediate forms of cap were identified in the RNase MC1 digest. These data indicate the presence of vendor-specific cap impurities in the mRNA.
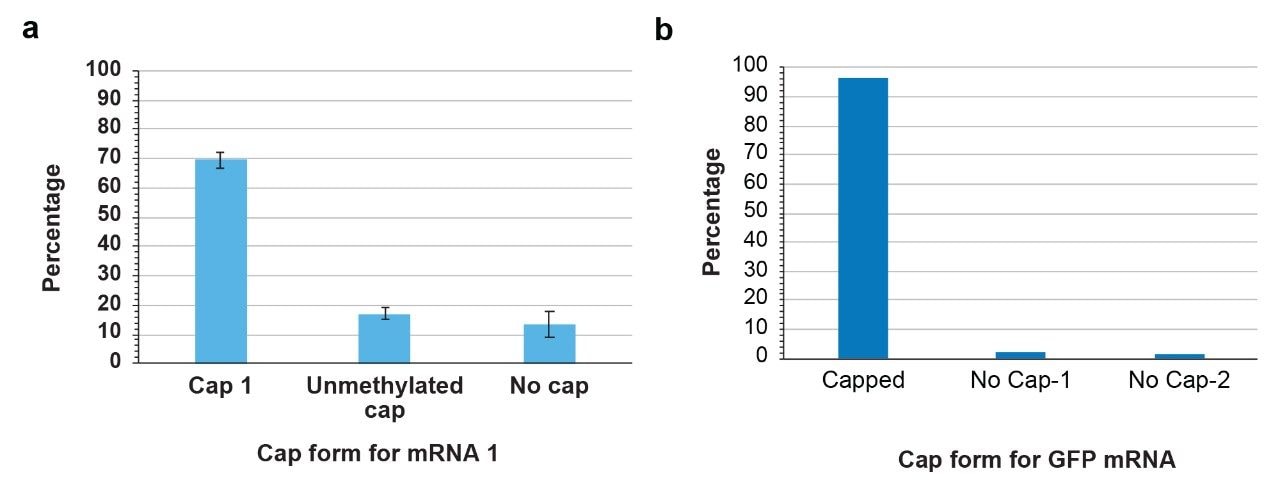
Next, we computed the capping efficiency for each mRNA by considering the peak areas of both capped and uncapped oligonucleotides for mRNA1 and GFP. For mRNA 1 the extent of cap1 (m7GpppAm) incorporation was ~70%, unmethylated cap was around 20% and the uncapped version of oligonucleotide is around 10% (Figure 5). The catalog GFP mRNA on the other hand exhibited higher percentage i.e. 96.3% of cap1 incorporation. Two types of uncapped oligonucleotides that differ in phosphorylation (pGNNNNNcP, and GNNNNNcP at 2.4% and 1.3%) were detected in the digest. In this study, LC-MS peak areas of cap species have been considered for computing the capping efficiency. Alternatively, LC-UV peak areas can also be used for such exercise after adjusting the LC-gradient in such a way that interference from non-cap oligonucleotides is minimized. Taken together, characterization of capped and uncapped versions of the 5’-end of mRNA can easily be investigated by RNase MC1 digestions and IP-RP-LC-MS without the need to employ DNA probes or ribozyme-based tools.
Conclusion
In this work, we have established a robust analytical method for characterization of capped and uncapped versions of the 5’-end sequences of mRNA. Relative quantitation of the 5’ cap species is achieved with an all-in-one oligonucleotide mapping procedure involving RNase MC1 and IP-RP-LC-MS.
- mRNA from two different vendors was reproducibly digested using RNase T1 and RapiZyme MC1
- Detection of capped and uncapped versions of 5’ termini digestion components could be achieved with RapiZyme MC1 but not RNase T1, due to its G-specific cleavages
- The RNase MC1 oligonucleotide mapping approach does not require sequence-specific probes and RNase H or ribozyme/DNAzyme Capping efficiency and cap impurity percentage determination were relatively straightforward once an appropriate enzyme tool was applied
- Our analysis facilitated the identification of vendor-specific differences in cap impurity profiles
Waters, RapiZyme, waters_connect, Xevo, ACQUITY, IonHance, BEH, QuanRecovery, MaxPeak, and Vion are trademarks of Waters Technologies Corporation. Milli-Q is a trademark of Merck KGaA.
References
- Furuichi Y and Shatkin AJ (2000) Viral and cellular mRNA capping: past and prospects. Adv Virus Res 55:135–84. doi: 10.1016/s0065–3527(00)55003–9.
- Gonatopoulos-Pournatzis T and Cowling VH (2013) Cap-binding complex (CBC). Biochem J 457:231–242. doi: 10.1042/BJ20131214.
- Webb ALJ et al. (2025) Characterization and analysis of mRNA critical quality attributes using liquid chromatography methods. Journal of Chrom A 1745:465724.
- Chan SH et al. (2022) RNase H-based analysis of synthetic mRNA 5′ cap incorporation. RNA 28:1144–1155. doi: 10.1261/rna.079173.122.
- Beverly M et al. (2016) Label-free analysis of mRNA capping efficiency using RNase H probes and LC-MS. Anal Bioanal Chem 408:5021–30. doi: 10.1007/s00216–016–9605–x.
- Doneanu CE et al. (2025) Oligo mapping of mRNA digests using a novel informatics workflow. Waters application note 720008677. Jan 2025.
- Addepalli B et al. (2024) Tunable digestions of RNA using RapiZyme RNases to confirm sequence and map modifications. Waters application note 720008539. Sep 2024.
Featured Products
720008793, May 2025