Metabolomic and Lipidomic Profiling of Extracellular Vesicles with the Xevo™ G3 QTof
Apenas para utilização em pesquisas. Não se destina à utilização em procedimentos de diagnóstico.
Abstract
Lipidomic and metabolomic LC-MS workflows are widely used for determining potential biomarkers of disease and gaining a greater understanding of the underlying biology of the system being studied. Typically, biomarkers are present in a variety of formats and are routinely isolated from biological fluids such as plasma, serum, or urine. More recently however, extracellular vesicles (EVs) have generated interest as potential biomarker candidates. In this application note, we assess different sample preparation buffers which can be applied to EVs, allowing for optimal lipidomic and metabolomic extracts.
Benefits
- Comprehensive metabolomic and lipidomic profiling, combined with relative, label-free quantification using the data independent workflow, MSE
- Xevo G3 QTof allows for deep profiling of the lipidome and metabolome, demonstrating 5-orders of in-sample dynamic range
- Utilization of the ACQUITY™ Premier LC provides enhanced recovery of polar metabolites/lipids (e.g., phosphorylated species), which is particularly critical for low abundant, biologically relevant compounds
- Data processing and compound identification was achieved using in-house software tools (i.e., waters_connect™) in addition to being compatible with third party solutions such as Lipostar and MARS
- Compatibility of outputs from in-house and third-party software tools with statistical/data visualization tools such as MetaboAnalyst, highlights the flexibility of the workflow, providing greater statistical and compound identification coverage
Introduction
Extracellular vesicles (EVs) are a group of heterogeneous, non-proliferating, nanoparticles with a lipid bilayer membrane. EVs are shed from almost all cells and carry a cargo of DNA, RNA, lipids, proteins, and metabolites that reflect cellular origin. Circulating EV’s in a range of biological fluids, including peripheral blood, can be readily monitored and are physiologically representative of their parental cell. The concentrations at which they are found in these biological fluids also appears to be disease-state dependent.1 Recently, EVs have been identified as potential biomarkers of disease, particularly for areas including oncology and neurology for example.2–3 Subsequently, omic studies investigating vesicle communication pathways have been conducted. The aim of the work outlined here was to optimize a multi-omic sample preparation method for EV enriched samples, which would be compatible with LC-MS analyses.
Experimental
Sample Preparation
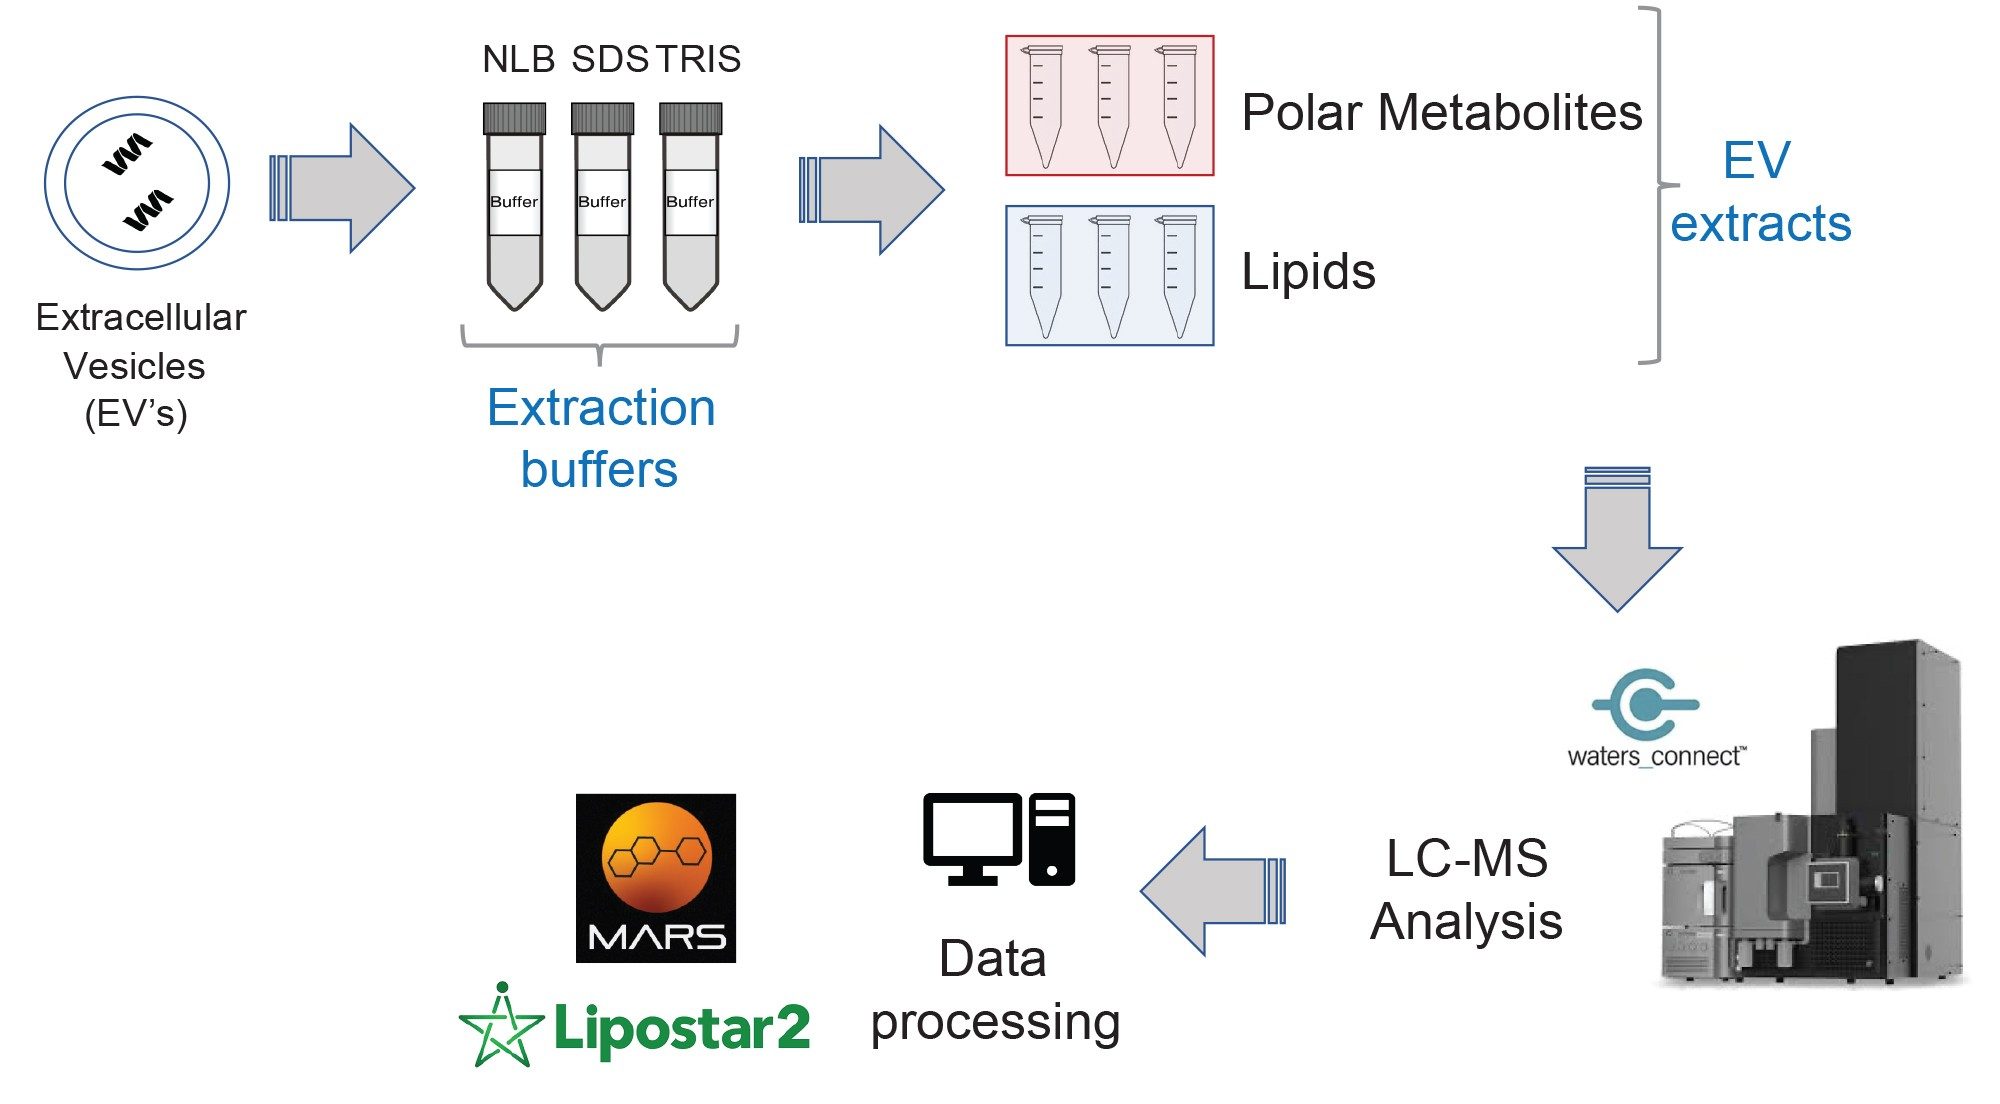
C2C12 murine myoblasts cells were proliferated to confluence and then differentiated into myotubes following the American Type Culture Collection (ATCC) guidelines.4 EVs were then isolated from the media using a differential ultracentrifugation process. Three different lysis buffers were used to assess the extraction viability for LC-MS analysis. These buffers consisted of (i) 2% sodium dodecyl sulfate (SDS); (ii) 2% SDS with 20 mM Tris; (iii) No lysis buffer (NLB).
LC Conditions (Metabolomics - HILIC)
|
LC system: |
ACQUITY Premier FTN |
|
Columns: |
ACQUITY UPLC™ BEH™ Amide (2.1 mm x 100 mm, 1.7µm; p/n: 186009505) |
|
Column temperature: |
40 ˚C |
|
Injection volume: |
2 µL partial loop |
|
Flow rate: |
0.7 mL/min |
|
Mobile phase A: |
5:95 Acetonitrile:Water + 0.1% Formic Acid, 10 mM Ammonium Formate |
|
Mobile phase B: |
95:5 Acetonitrile:Water + 0.1% Formic Acid, 10 mM Ammonium Formate |
|
Gradient: |
Initial 100% B; 100-80% B, 0.1-5.0 min; 80-50% B, 5.0-6.0 min; 50% B, 6.0-6.5 min; 50-100% B, 6.5-7.0 min; re-equilibrate to initial conditions 7.0-10.0 min. |
LC Conditions (Lipidomics – Reversed Phase)
|
LC system: |
ACQUITY Premier FTN |
|
Columns: |
ACQUITY Premier CSH™ C18 (2.1 mm x 100 mm, 1.7µm; p/n: 186009461) |
|
Column temperature: |
55 °C |
|
Injection volume: |
2 µL partial loop |
|
Flow rate: |
0.4 mL/min |
|
Mobile phase A: |
600:390:10 Acetonitrile:Water:1 M Ammonium formate, 0.1% formic acid |
|
Mobile phase B: |
900:90:10 IPA:Acetonitrile:1 M Ammonium formate, 0.1% formic acid |
|
Gradient: |
Initial 50% B; 50-53% B, 0.5 min; 53-55% B, 0.5-4.0 min; 55-65% B, 4.0-7.0 min; 65-80% B, 7.0-7.5 min; 80-99% B, 7.5-10 min; 99% B, 10-11 min; re-equilibrate to initial conditions 11-12 min. |
MS Conditions
|
MS system: |
Xevo G3 QTof |
|
Source: |
ESI |
|
Ionization mode: |
ESI+/- |
|
Capillary voltage: |
2.8 (+)/1.5 (-) kV |
|
Sampling cone: |
40 V |
|
Source temperature: |
150 °C |
|
Desolvation temperature: |
500 °C |
|
Cone gas flow: |
150 L/hr |
|
Desolvation flow: |
900 L/hr |
|
Collision energy: |
Ramp applied from 20–45 eV |
|
Scan time: |
0.1 sec |
Informatics
Data were processed using a variety of software platforms, including Lipostar and MARS (Mass Analytica, Barcelona, Spain). Statistical analysis was conducted using the embedded statistical tools within the software platforms used to process the data, in addition to MetaboAnalyst.5 Further data visualization was performed using Spotfire (Tibco, Palo Alto, CA, USA).
Results and Discussion
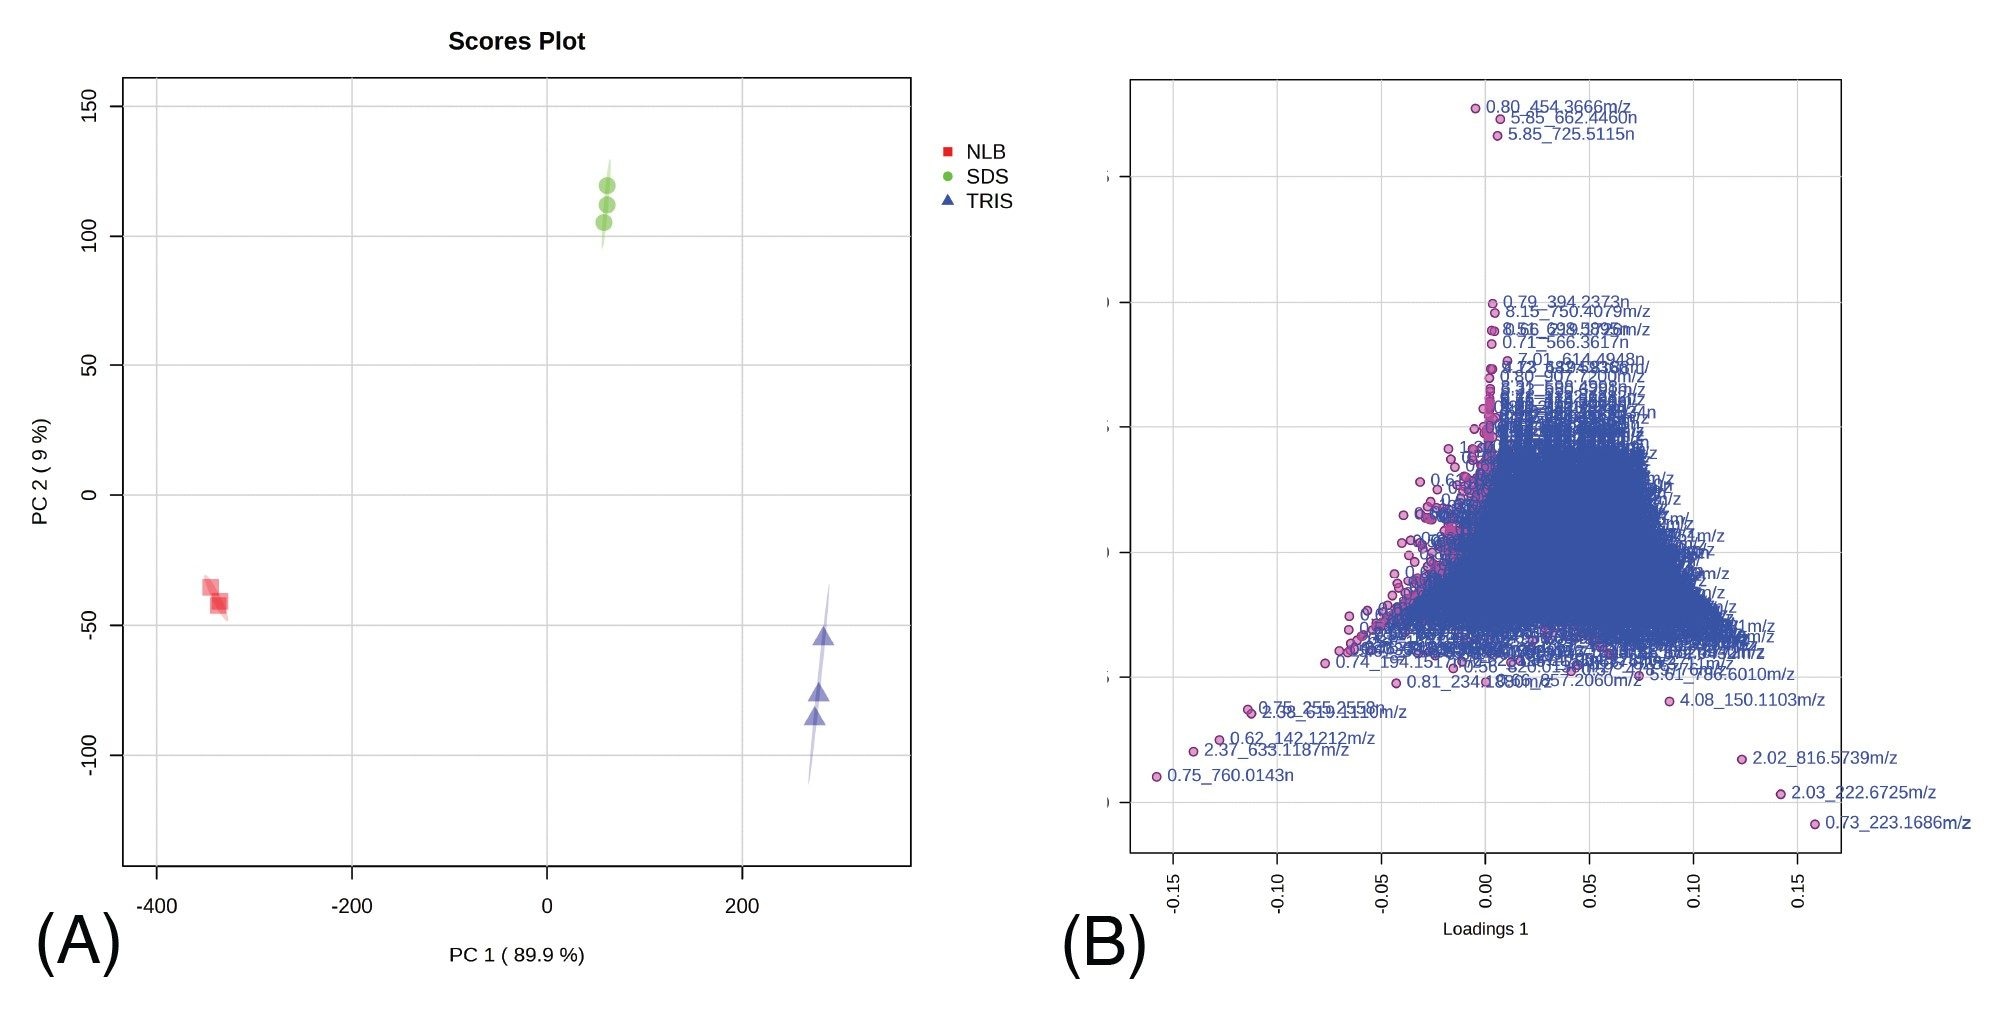
Data corresponding with EV related metabolomic and lipidomic extracts based on different extraction protocols were acquired with the data independent acquisition (DIA), MSE, using the Xevo G3 QTof. The subsequent data were then processed using a variety of informatic tools (Figure 1). Statistical analysis of the processed data relating to the lipidomic extracts, highlighted significant differences between the various extraction methods. Unsupervised principal component analysis (PCA) representing the reversed-phase (RP) analysis (ESI+) is provided in Figure 2. The technical replicates (n=3) for each extraction method are tightly clustered, indicating high technical reproducibility of the system (also observed for the ESI- data). Clear separation between the three extraction protocols suggests significant differences in the analytes extracted and/or the quantity in which they are extracted. The associated loadings plot represents the features responsible for the observed differences from the PCA, which were subject to database searching.
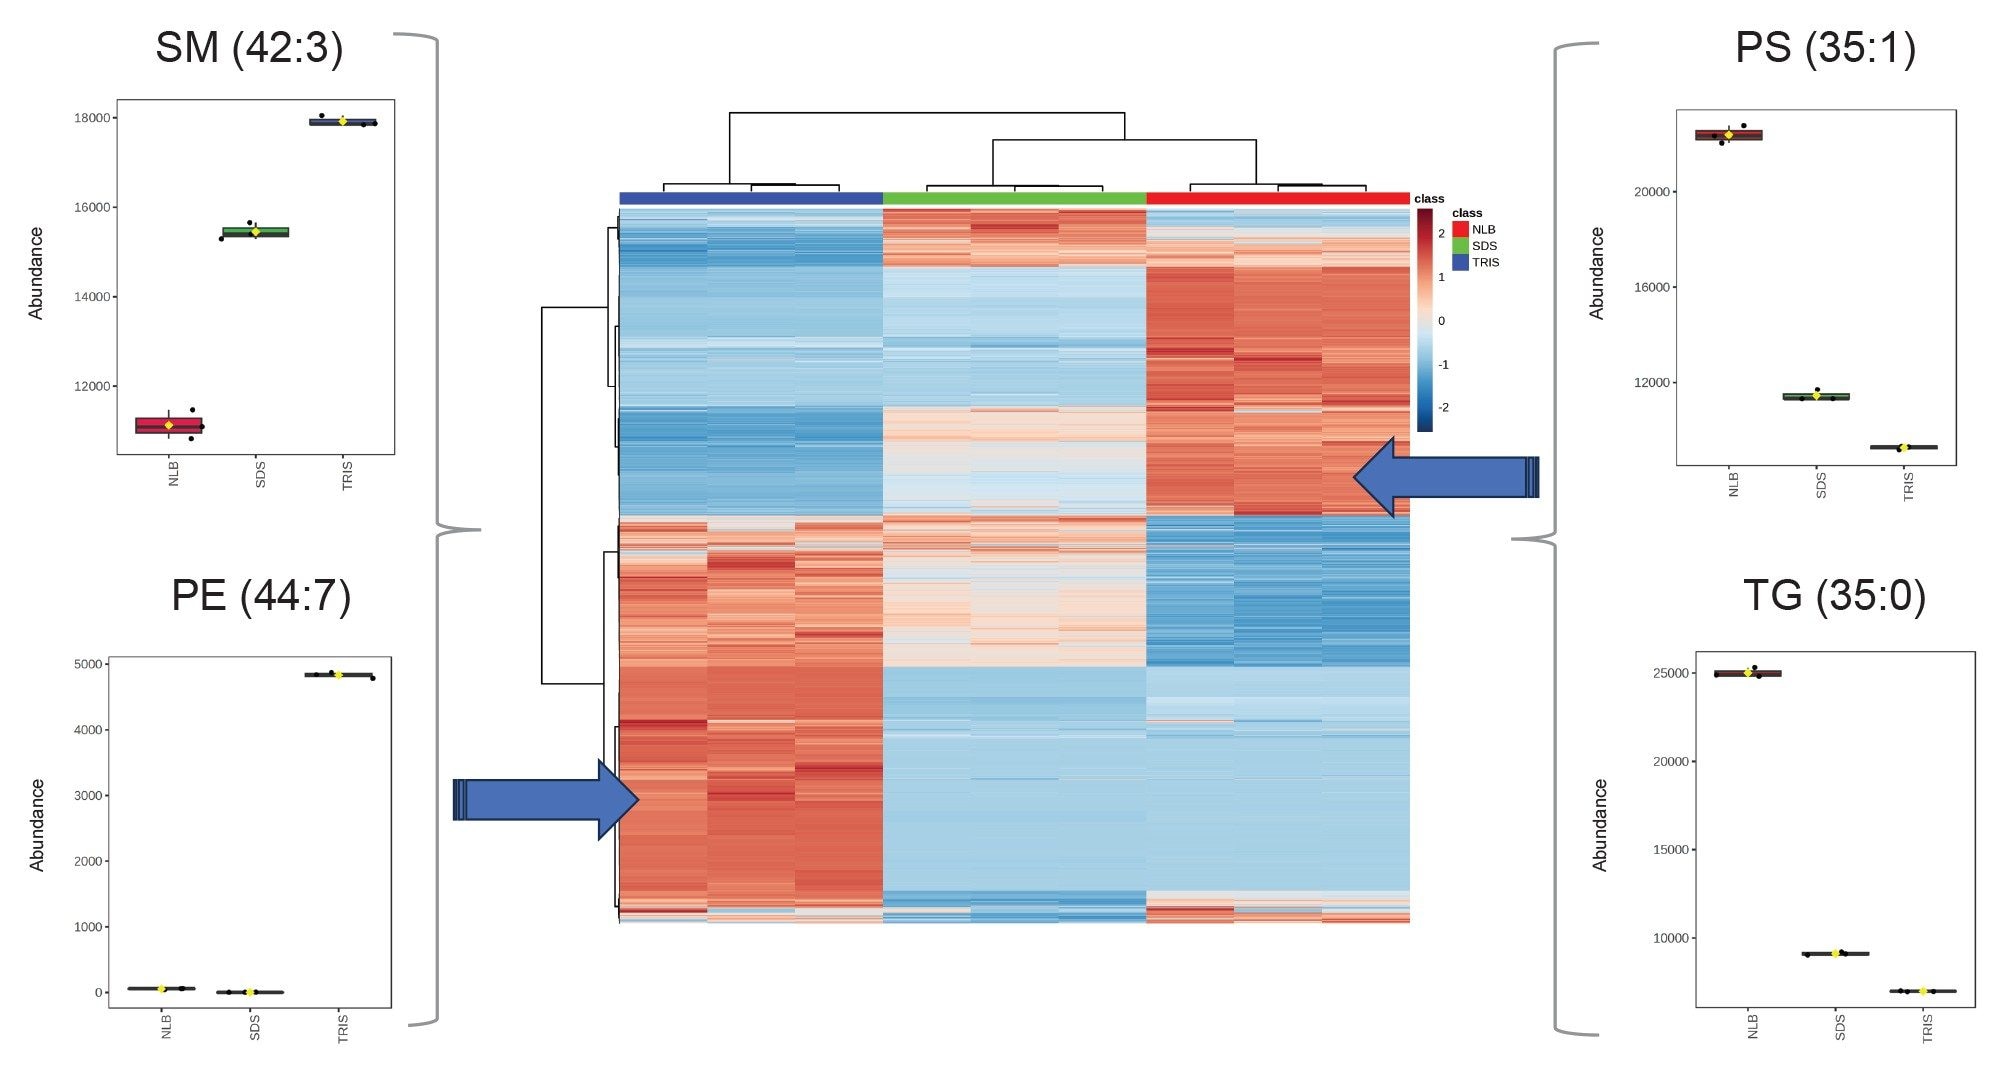
Comparing the most statistically relevant lipids, the classes which were predominantly identified included triglycerides, sphingomyelins, and phospholipids (Figure 3). Comparing across the three buffer conditions, the majority of the phospholipids/sphingomyelins were shown to be present at higher abundance with the tris buffer, whilst a smaller proportion of phospholipids were more highly abundant when using NLB conditions, (Figure 3 – Heatmap/box-whisker plots).
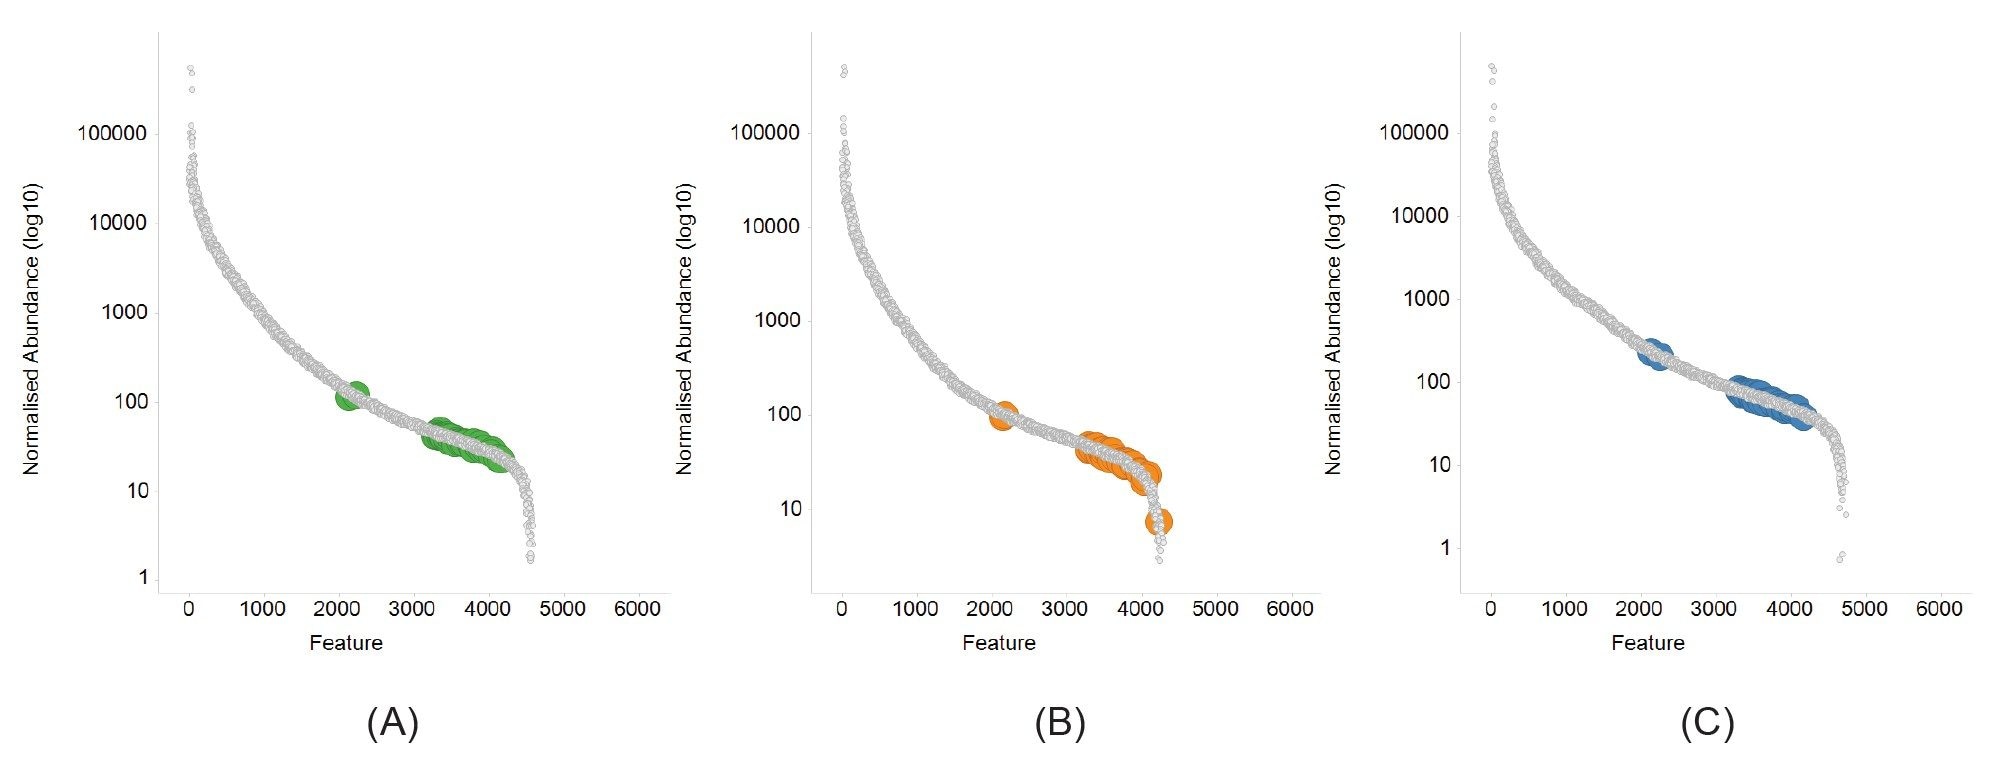
The presence of phospholipids is evident for all three buffer conditions and the level at which these key phospholipids are present is of relatively low abundance, hence requiring the high levels of sensitivity and dynamic range provided by the Xevo G3 QTof. Normalized abundance curves (Figure 4) demonstrate the wide in-sample dynamic range that is achieved (approx. 5-orders) with the tris buffer providing a slightly higher abundance for the bulk of the phospholipids identified.
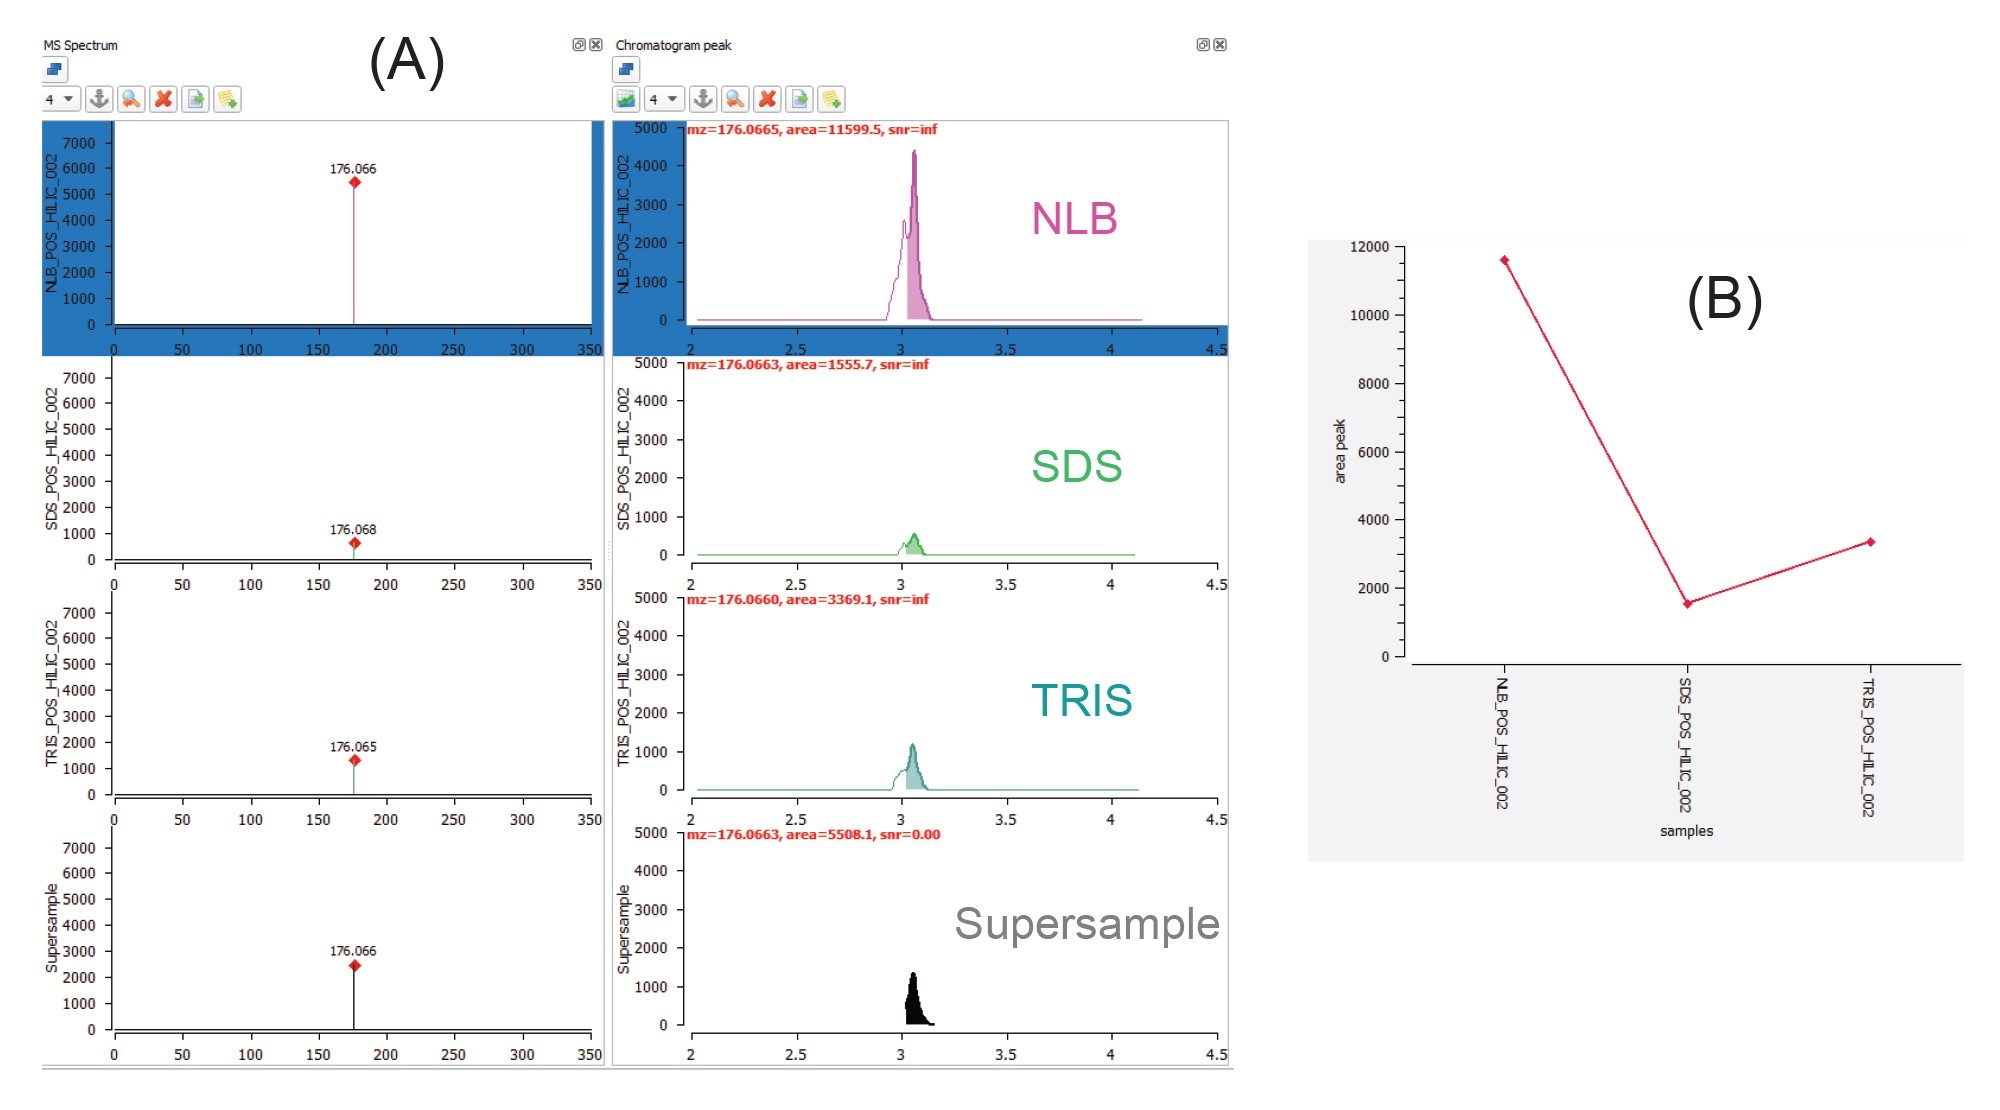
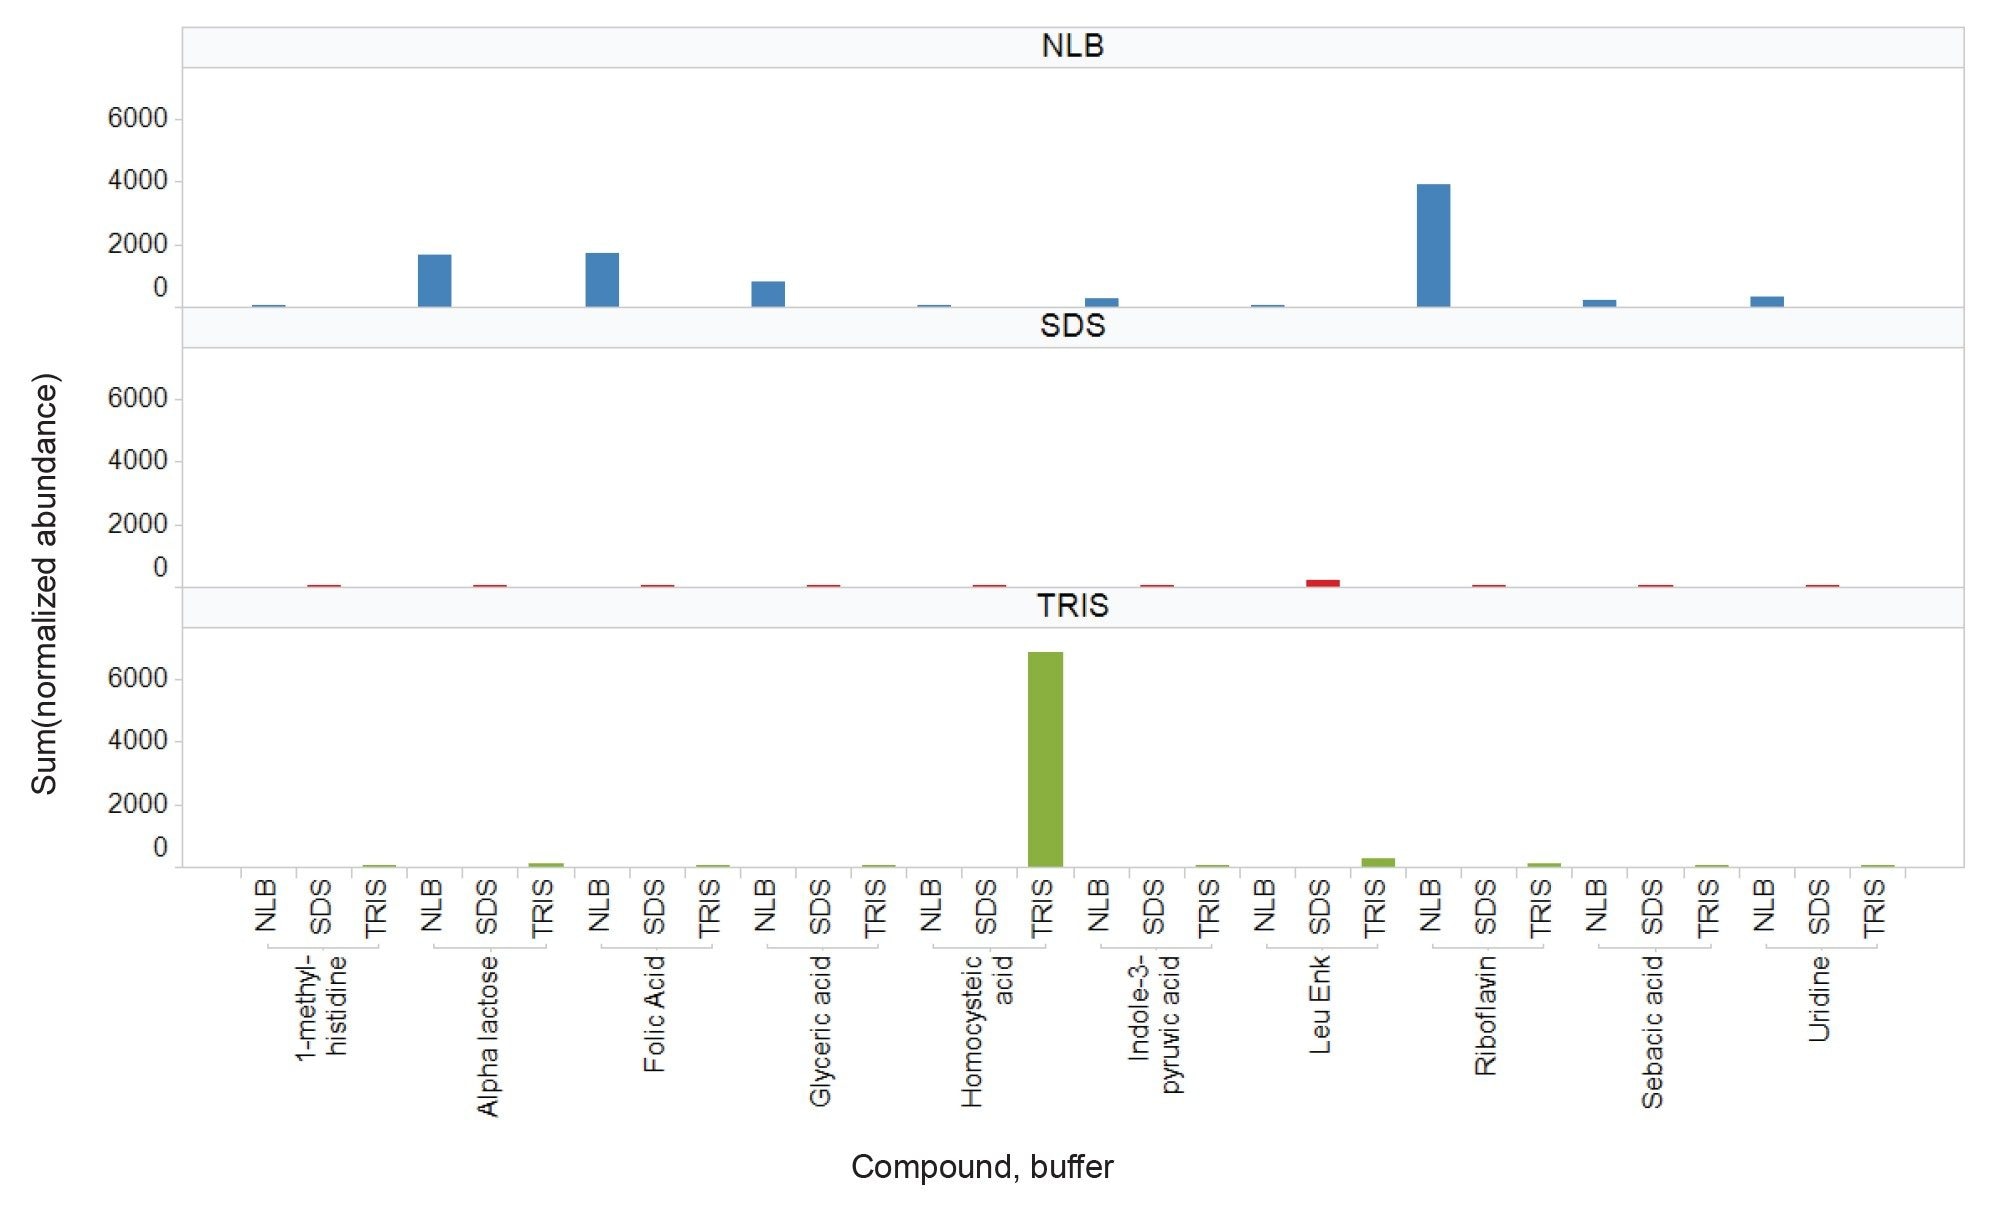
The number and variety of polar metabolites extracted from EV enriched samples appears to be highly influenced by the type of extraction buffer used as part of the sample preparation. Generally, utilizing the NLB conditions results in (i) unique metabolites being identified or (ii) for metabolites common to all three buffers, NLB often results in higher recoveries. Utility of the waters_connect API, provides additional flexibility, allowing for data to be interrogated using third party informatic tools. The MARS metabolomic informatic package was used to peak pick and search for compound identifications, whilst also providing relative quantification. Guanidinosuccinic acid (Figure 5) serves as an example metabolite that is extracted with all three buffer conditions; however, its abundance is at least four times higher in the NLB extracts (as shown by the extracted chromatograms (Figure 5A) and associated trend plot (Figure 5B)). These compound classes have previously been reported as being involved in cancer derived cells.6 Figure 6 further highlights this observation for several other compound classes (apart from homocysteic acid).
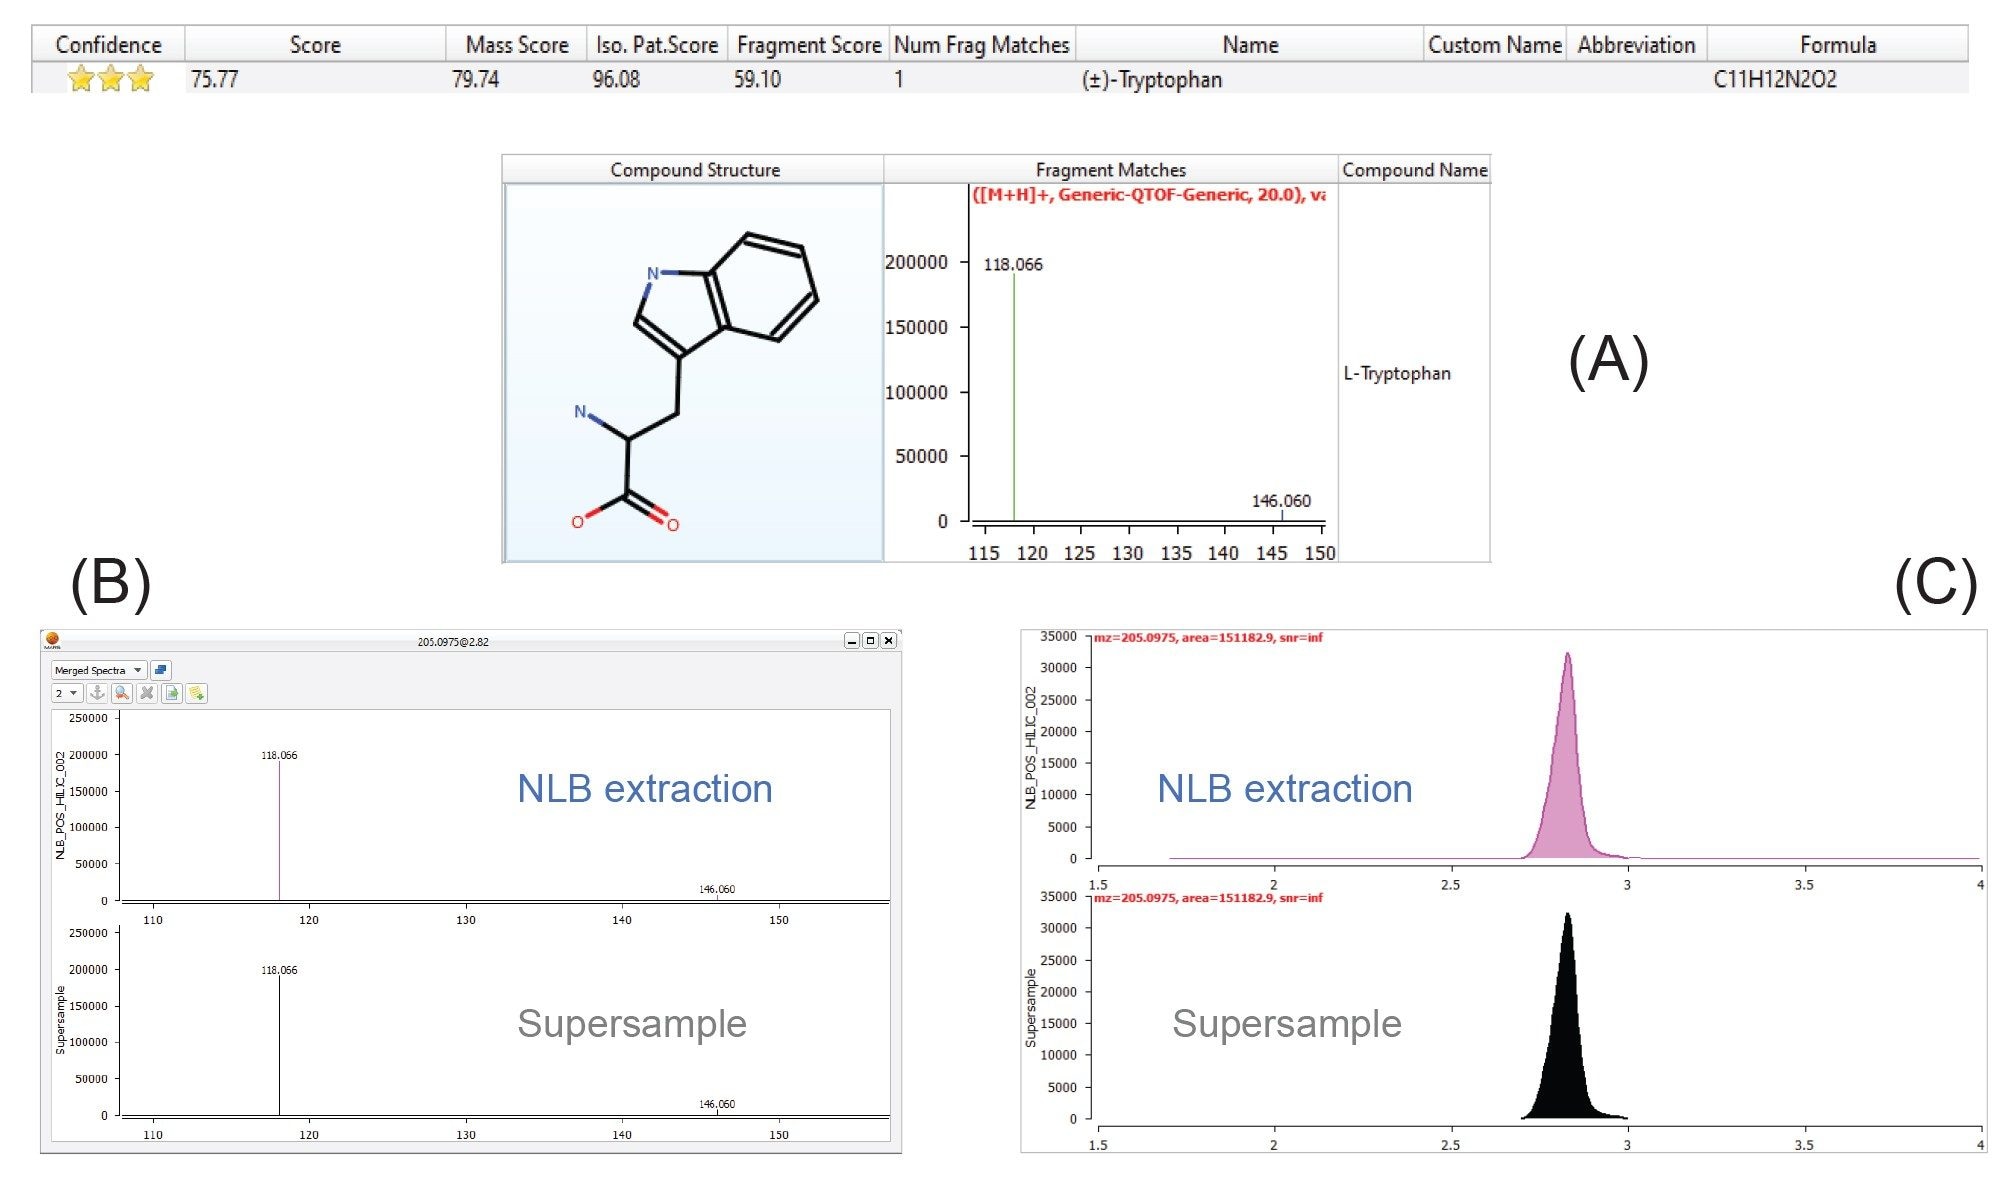
Using the MARS workflow, several significant, biologically relevant polar metabolites were identified, which included amino acids, fatty acids, pyridines, and indoles. Tryptophan (Figure 7) is a highly confident compound identification, which was identified only from the NLB extract and has previously been identified as playing a key role in signaling pathways for skeletal muscle.7 A combination of mass accuracy (precursor and fragment ion), isotope pattern, fragment ion matches, and retention time all contribute to the overall confidence score.
Conclusion
The LC-MS analysis of lipids and polar metabolites from EVs has been demonstrated using three different buffer conditions (NLB, SDS, and Tris). Overall, the choice of extraction buffer influenced the class of lipids detected and their abundance, whilst from a polar metabolome perspective, the choice of buffer appeared to have a more considerable effect (i.e., for abundance and the detection of unique polar metabolites). Implementing the Xevo G3 QTof enabled the detection of low-level compounds over a wide dynamic range. Integration with third-party informatic tools such as MARS via the API, provided highly confident compound identifications with relative quantification, demonstrating a flexible data analysis workflow for discovery, small molecule OMIC analyses.
References
- Rikkert, L.G., Beekman, P., Caro, J., Coumans, F.A.W., Encisco-Martinez, A., Jenster, G., et al. Toward Identification of Cancer by Tumor-Derived Extracellular Vesicles in Blood. Front. Oncol. (2020) (doi: 10.3389/fonc.2020.00608).
- Liu, L., Kawashima, M., Sugimoto, M., Sonomura, K., Pu, F. et al. Discovery of Lipid Profiles in Plasma-Derived Extracellular Vesicles as Biomarkers for Breast Cancer Diagnosis. Cancer Science (2023) (doi: 10.1111/cas.15935).
- Blommer, J., Pitcher, T., Mustapic, M, Eren, E., Yao, P.J., Vreones, M.P. et al. Extracellular Vesicle Biomarkers for Cognitive Impairment in Parkinson’s Disease. Brain (2023) (doi:10.1093/brain/awac258).
- https://www.atcc.org/resources/culture-guides/animal-cell-culture-guide.
- Pang, Z., Zhou, G., Ewald, J., Chang, L., Hacariz, O., Basu, N., and Xia, J. Using MetaboAnalyst 5.0 for LC-HRMS Spectra Processing, Multi-Omics Integration and Covariate Adjustment of Global Metabolomics Data. Nature Protocols (2022) (doi: 10.1038/s41596–022–00710–w).
- Harmati, M., Bukva, M., Bőrőczky, T., Buzás, K., Gyukity-Sebestyén, E. Cancer and Metastasis Reviews (2021) (doi: 10.1007/s10555–021–10014–2).
- Dukes, A., Davis, C., Refaey M.E., Upadhyay, S., Mork, S., Arounleut, P., Johnson, M.H., Hill, W.D., Isales, C.M., Hamrick, M.W. The Aromatic Amino Acid Tryptophan Stimulates Skeletal Muscle IGF1/p70s6K/Mtor Signaling in Vivo and the Expression of Myogenic Genes in Vitro. Nutrition (2015) (doi: 10.1016/j.nut.2015.02.011).
Featured Products
720008142, December 2023