Peak Shape Changes Over Time

Peak Shape Changes Over Time

Peak Shape Changes Over Time

Peak Shape Changes Over Time

As discussed in the first three parts of this series, peak shape issues are a common problem in HPLC analyses. Ideally, peaks should be symmetrical, with a Gaussian shape [D. R. Stoll, LC-GC N. Am. 39 (2021) 353–362]. The symmetry of a peak may be quantified by calculating the USP tailing factor (T), as illustrated in Figure 1. A tailing factor of 1 indicates perfect symmetry, while values less than 1 are referred to as fronting and values greater than 1 as tailing. Many methods require that the tailing factors for all peaks must be within a specified range. Tailing factors that deviate significantly from 1 may decrease the resolution of peaks that elute close together, making integration more difficult [D. R. Stoll, LC-GC N. Am. 39 (2021) 353–362]. Also, when the peak symmetry is poor the peak is generally wider than it should be, which decreases the peak height. In applications involving the detection and quantification of analytes present at low concentrations, this may decrease the precision of the results as well as the limits of quantitation and detection.

Calculation of the USP tailing factor; W0.05 is the peak width measured at 5% of the peak height and f is the width of the front section of the peak
Figure 1. Calculation of the USP tailing factor; W0.05 is the peak width measured at 5% of the peak height and f is the width of the front section of the peak.

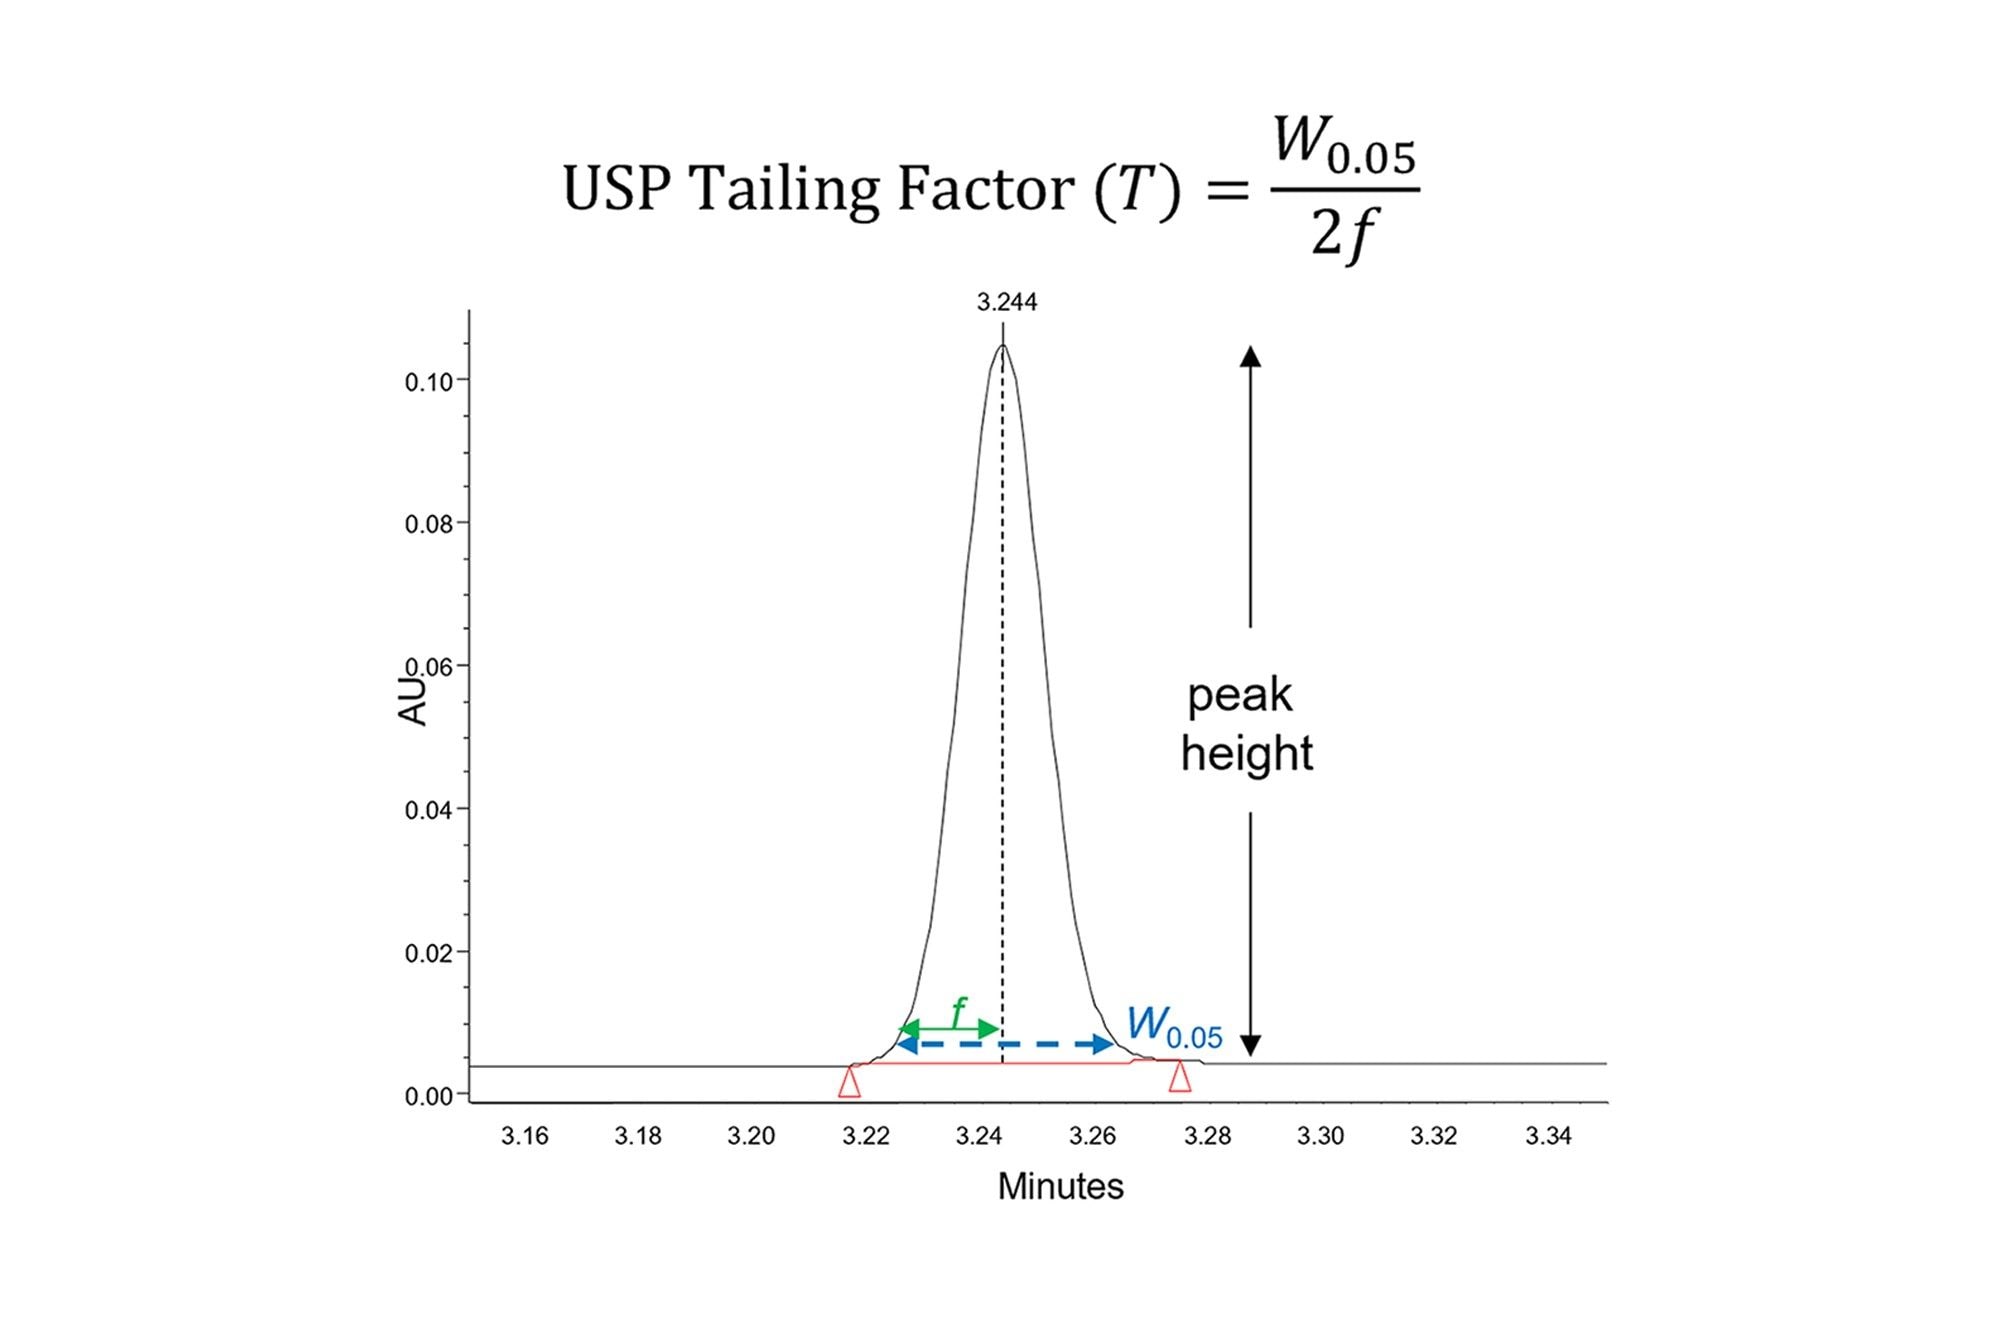
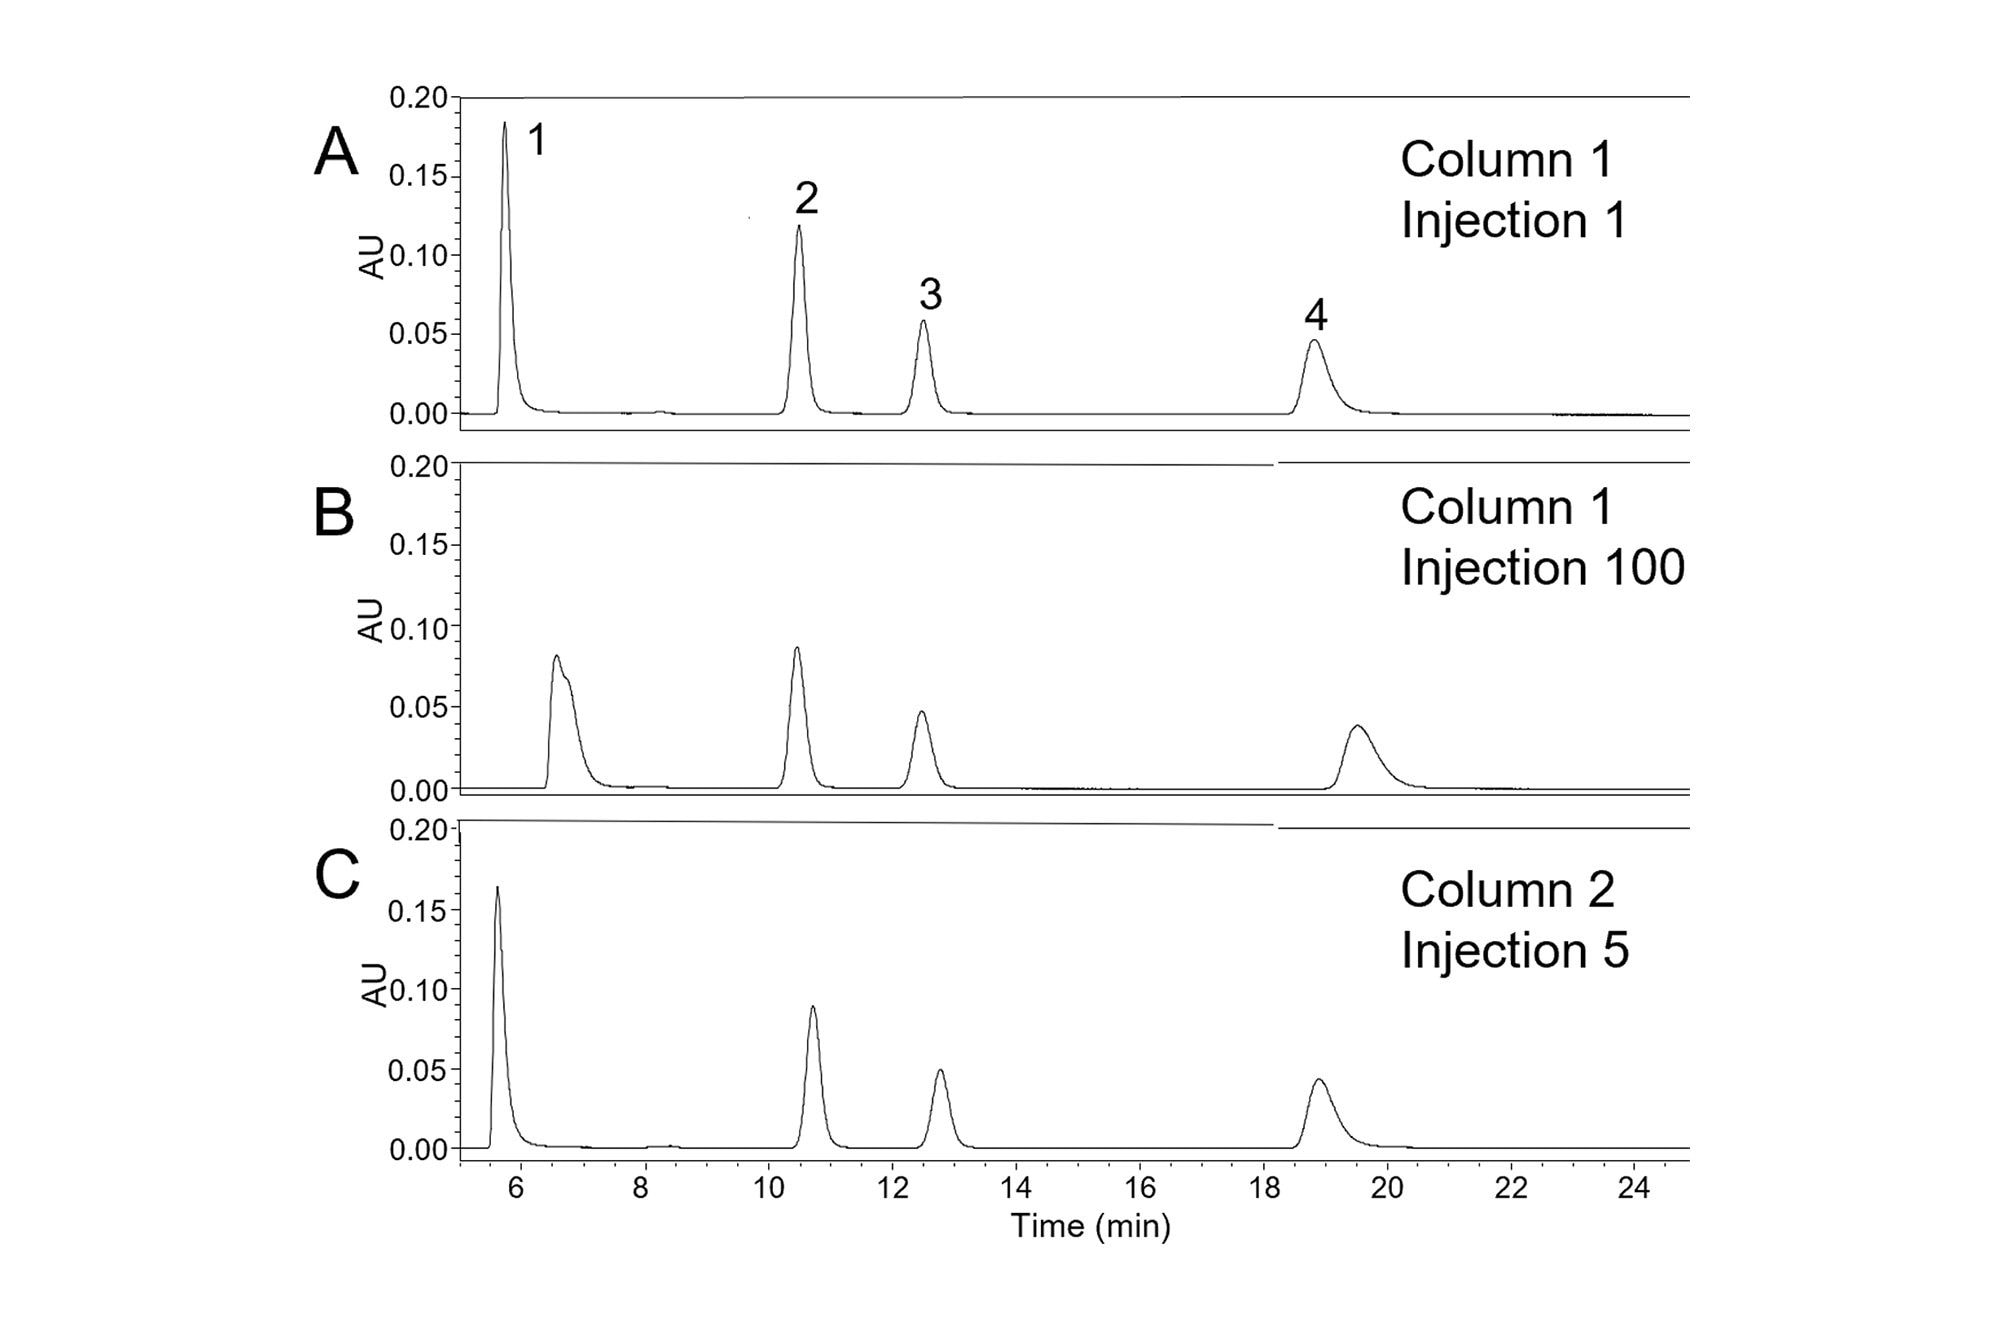
In many applications, a method is used repeatedly to analyze a group of samples. To ensure that accurate results are obtained it’s important for the column to give consistent peak widths and tailing factors for the duration of the set of analyses. However, this may not always be achieved in practice. In the example shown in Figure 2, an isocratic separation of four compounds showed changes in peak width and peak symmetry after 100 injections. A C18-silica column was used with a mobile phase containing a pH 7.0 potassium phosphate buffer and methanol (35:65 v/v) and a column temperature of 40 °C. As discussed in the first three parts, there are several possible causes of changes in peak symmetry, including issues with the HPLC system, the mobile phase, the sample, and the column [J. W. Dolan and L. R. Snyder, Troubleshooting LC Systems, Springer Science+Business Media, New York, 1989, pp. 385–420]. As previously discussed, a good starting point for troubleshooting is to carefully analyze the chromatograms to observe whether the change in peak shape is seen for all the peaks, or only some of them. In the chromatograms shown in Figure 2, the largest change is seen for nortriptyline (peak 1), while a smaller change is seen for amitriptyline (peak 4). Significant increases in retention time are also evident for these two peaks. The other two peaks (peak 2 , 2-methylnaphthalene and peak 3, acenaphthene) show smaller changes. Notably, nortriptyline and amitriptyline are basic compounds, while 2-methylnaphthalene and acenaphthene are non-ionizable. When only the peaks from basic compounds show increased tailing and retention times, as in Figure 2B, likely causes include a change in the mobile phase or in the column. To determine which of these caused the changes seen in the chromatogram in Figure 2B, the column was replaced with a new column of the same type. Using the same mobile phase, the chromatogram shown in Figure 2C was obtained. This chromatogram shows a separation similar to that initially obtained on the original column, indicating that the cause of the increased tailing at injection 100 was a change in the column.

Chromatograms for the first (A), and 100th injection (B) on a C18-silica column and the fifth injection on a new C18-silica column (C); peak identifications: nortriptyline (1), 2-methylnaphthalene (2), acenaphthene (3), amitriptyline (4)
Figure 2. Chromatograms for the first (A), and 100th injection (B) on a C18-silica column and the fifth injection on a new C18-silica column (C); peak identifications: nortriptyline (1), 2-methylnaphthalene (2), acenaphthene (3), amitriptyline (4).

USP Tailing Factor

Peak

A

B

C

1

1.90

2.54

2.12

2

1.14

1.19

1.11

3

1.11

1.17

1.08

4

1.55

1.58

1.59

Since the column was used within the recommended ranges for temperature (20–45 °C) and pH (2–8), this relatively rapid deterioration was not expected. However, it’s important to consider that the pH of the aqueous buffer changes when the organic solvent (methanol) is added. It has been reported that dilution of a pH 7.05 aqueous phosphate solution with an equal volume of methanol caused the pH to increase to 8.29 [I. Canals, J. A. Portal, E. Bosch, M. Roses, Anal. Chem. 72 (2000) 1802–1809]. Because the mobile phase used to produce the chromatograms of Figure 2 contained 65% methanol, the pH of the mobile phase would be expected to be even higher, and above the recommended limit of 8. Using a mobile phase pH above the recommended limit may lead to hydrolysis of the stationary phase, causing the loss of bonded groups and the formation of additional silanols, as well as a loss of efficiency [J. J. Kirkland, M. A. van Straten, H. A. Claessens, J. Chromatogr. A 691 (1995) 3–19]. This is likely the reason for the changes in peak shape and retention seen in Figure 2B.

Chromatograms for the first (A) and 120th injection (B) on a hybrid C18 column; peak identifications
Figure 3. Chromatograms for the first (A) and 120th injection (B) on a hybrid C18 column; peak identifications same as in Figure 2.

USP Tailing Factor

Peak

A

B

1

1.01

1.02

2

1.05

1.05

3

1.05

1.04

4

1.07

1.07

When using mobile phases with a pH greater than 8, a more robust choice than a C18-silica column is a column packed with hybrid organic-inorganic particles [K. D. Wyndham, J. E. O’Gara, T. H. Walter, K. H. Glose, N. L. Lawrence, B. A. Alden, G. S. Izzo, C. J. Hudalla, P. C. Iraneta, Anal. Chem. 75 (2003) 6781–6788]. To demonstrate this, the same method was used with a hybrid particle column (XBridge BEH C18), giving the results shown in Figure 3. With the improved alkaline stability of the hybrid particle column, no significant changes in peak shape were observed over 120 injections. These results show that peak shape changes over time may be caused by bonded phase hydrolysis, particularly when using a column near its recommended pH and temperature limits. Importantly, the effect of the organic solvent on the pH of the aqueous buffer should be taken into account when checking whether the mobile phase pH is within the recommended range for the column.

Related

Colunas de HPLC líderes do setor apoiadas por tecnologias e recheios inovadores. Maximize o desempenho de seu laboratório, otimizando a purificação ou o desenvolvimento de métodos.

Obtenha flexibilidade total de desenvolvimento de métodos com as colunas de HPLC/UHPLC XBridge projetadas com tecnologia BEH para oferecer estabilidade e vida útil, mesmo em pH alto/baixo, altas temperaturas e outras condições operacionais adversas.

Maximize a resolução e a capacidade de pico para separações de LC com colunas de núcleo sólido CORTECS em 1,6 e 2,7 µm para 7 recheios de coluna

Obtenha seletividade e simetria de pico superiores para compostos básicos com as Colunas XSelect HPLC e UHPLC. Conheça nossas colunas CSH e de sílica de alta resistência.

Obtenha um desempenho analítico previsível e garanta a reprodutibilidade de lote a lote com colunas de HPLC Symmetry à base de sílica de alta pureza.

Obtenha um carregamento de massa alta excepcional para colunas analíticas e preparativas com as Colunas SunFire HPLC. Conheça as colunas SunFire Sílica, C8 e C18.

Aumente a retenção de analitos polares em uma faixa de pH mais ampla e reduza as interações indesejadas entre analitos e superfícies com as Colunas Atlantis Premier.
Voltar ao início Voltar ao início