

For research use only. Not for use in diagnostic procedures.
- Main
-
For research use only. Not for use in diagnostic procedures.
Aarav Batra, Robert Plumb, Nikunj Tanna
Waters Corporation, United States
Published on September 4, 2026
For research use only. Not for use in diagnostic procedures.
Targeted lipidomics using tandem quadrupole mass spectrometry provides accurate quantitative information changes in biofluids and tissues lipid concentrations due to disease, environmental exposure, genetics etc. LipidQuan is a hydrophilic interaction liquid chromatography with tandem mass spectrometry (HILIC-MS/MS) method for the quantification of over 400 bioactive lipids in biofluids. This application note describes the acquisition and analysis of lipid concentration data using Xevo™ TQ Absolute XR Tandem Quadrupole Mass Spectrometer and waters_connect for Quantitation Software.
Lipids perform a key role in multiple biological processes including cell signaling, energy storage, cell membranes creation, hormone level regulation, vital organs protection, and facilitate absorption of fat-soluble vitamins. The quantification of lipid in biofluids provides information on system health, pathophysiological processes, and disease staging.1,2 LipidQuan is a validated method for the rapid quantification of over 400 bioactive lipids in biofluids, e.g., plasma and tissues3 via HILIC-MS/MS operated in multiple reaction monitoring (MRM) mode. This application note describes the acquisition and data analysis bioactive lipid in rat plasma using ACQUITY™ Premier UPLC™ System coupled to Xevo TQ Absolute XR Tandem Quadrupole Mass Spectrometer and waters_connect Quantitation Software.
A calibration line was prepared using the Avanti EquiSPLASH™ mix over the range of 0.334-167 ng/mL in protein precipitation solution. Rat plasma was prepared by protein precipitation with a pre-cooled acetonitrile:isopropanol (ACN:IPA) (2:1) at 4 °C (1:5, plasma:ACN/IPA) containing EquiSPLASH at 200 ng/mL. Samples were vortex-mixed for 1 minute and centrifuged at maximum of 10,300 g for 6 minutes at 4 °C before transferring the supernatant to glass vials for LC-MS analysis.
The samples were analyzed using via a rapid (8-minute) HILIC-MS/MS method using an ACQUITY Premier UPLC System coupled to a Xevo TQ Absolute XR Tandem Quadrupole Mass Spectrometer operated in MRM mode with either +ve or -ve ESI ionization. The MRM precursor and product ion pair transitions, cone voltages and collision energies are described in Monjuma, et al.3 A total of 431 transitions were acquired in +ve ESI and 446 transitions in -ve ESI. LC-MS/MS peak integration and lipid quantification was performed using the MS Quan Application in waters_connect for Quantitation Software.
|
System: |
ACQUITY Premier UPLC System |
|
Column: |
ACQUITY BEH™ Amide Column 1.7 μm, 2.1 × 100 mm |
|
Column temperature: |
45 °C |
|
Flow rate: |
0.6 mL/min |
|
Mobile phase A: |
95:5 Acetonitrile/water + 10 mM ammonium acetate |
|
Mobile phase B: |
50:50 Acetonitrile/water + 10 mM ammonium acetate |
|
Gradient: |
0.1% to 20.0% B for 2 minutes, then 20% to 80% B for 3 minutes followed by 3 minutes re-equilibration |
|
Run time: |
8 minutes |
|
Injection volume: |
1 µL |
|
System: |
Xevo TQ Absolute XR Tandem Quadrupole Mass Spectrometer |
|
Ionization mode: |
ESI (+/-) |
|
Capillary voltage: |
2.8 kV (+)/1.9 kV (-) |
|
Acquisition mode: |
MRM |
|
Source temperature: |
120 °C |
|
Desolvation temperature: |
500 °C |
|
Cone gas flow: |
150 L/hr |
|
Desolvation flow: |
1000 L/hr |
|
Nebulizer gas: |
7 bar |
|
Ion guide offset 1: |
3 V |
|
Ion Guide offset 2: |
0.3 V |
|
Chromatography software: |
waters_connect Software |
|
MS software: |
waters_connect Software |
|
Data processing: |
MS Quan Application |
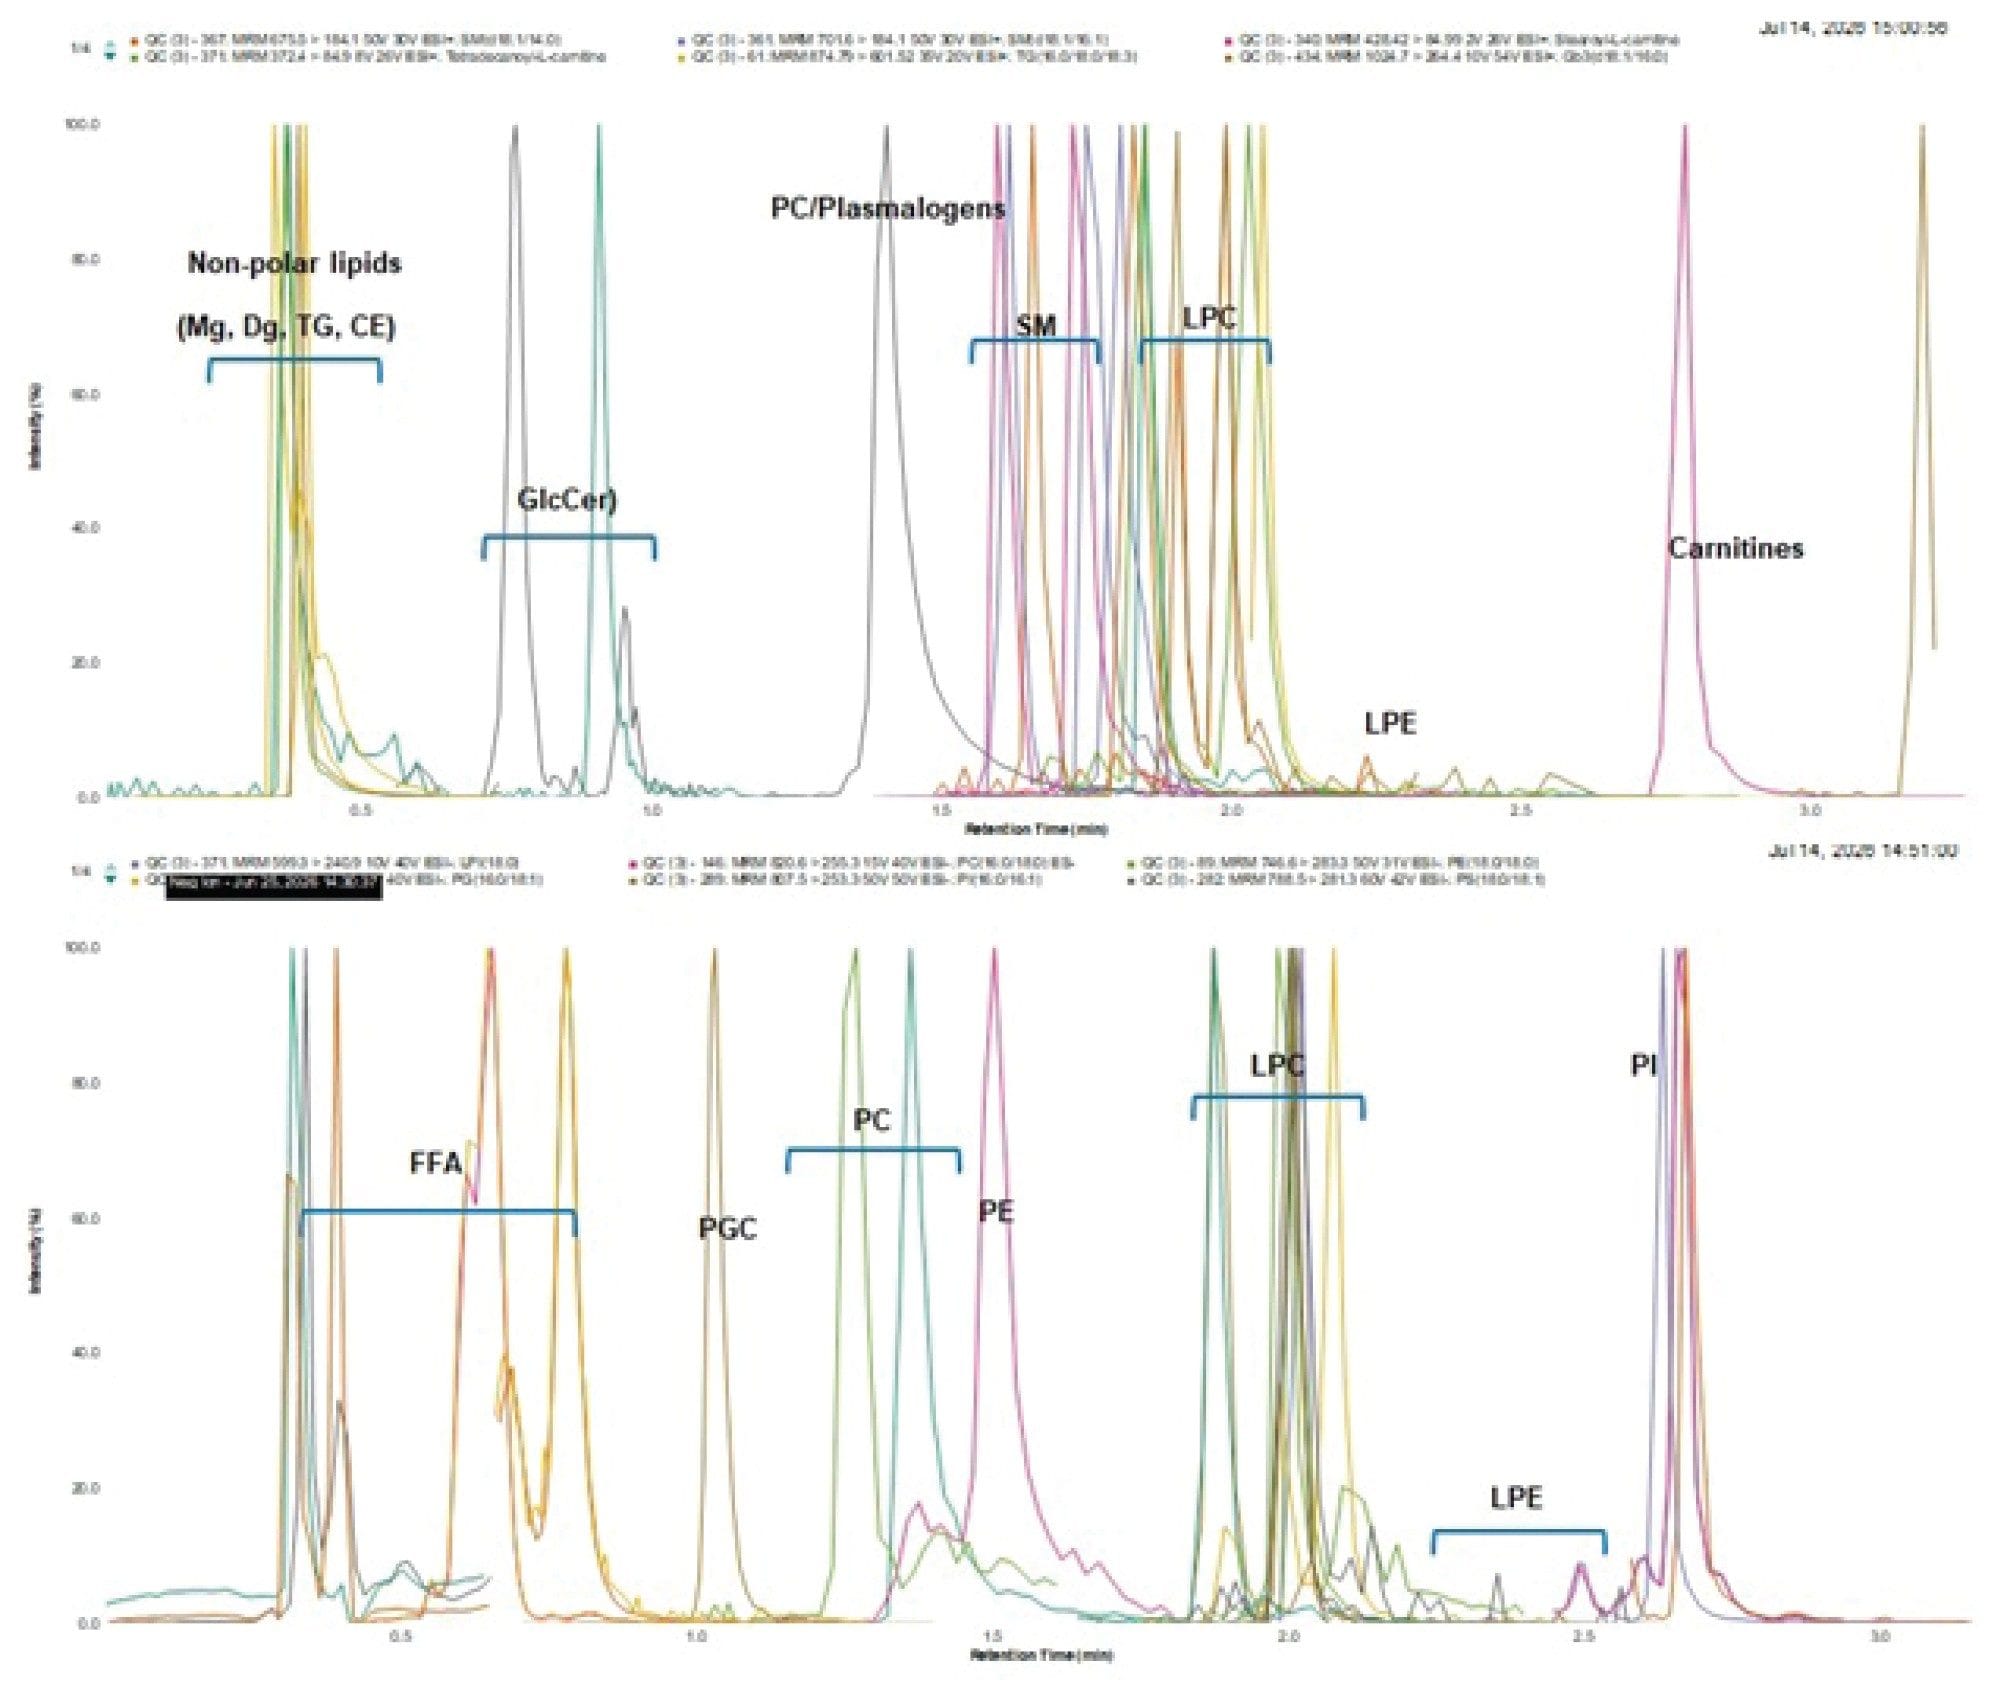
Quantitative lipidomics can provide insight into relative and quantitative changes in lipid abundance due to phenotypic variation, e.g., age, gender, disease state, and environmental exposure. Analysis of large data sets require a high-throughput method. LipidQuan Workflow facilitates the analysis of polar and non-polar lipid classes biofluids by employing a HILIC-based lipid class separation and MRM MS quantification.3,4 The LipidQuan Methodology contains a total of 2,041 MRM transitions for 16 polar and non-polar lipid classes. The lipids were chromatographed using a rapid (8 minute) HILIC separation which facilitates classed-based separation based on the polar head groups. This facilitated classed-based quantification using the EquiSPLASH mix (Avanti Research) as it contains stable isotopically labeled (SIL) for 13 lipid classes. Representative chromatograms of the +ve & -ve ESI analysis of control rat plasma are shown in Figure 1.
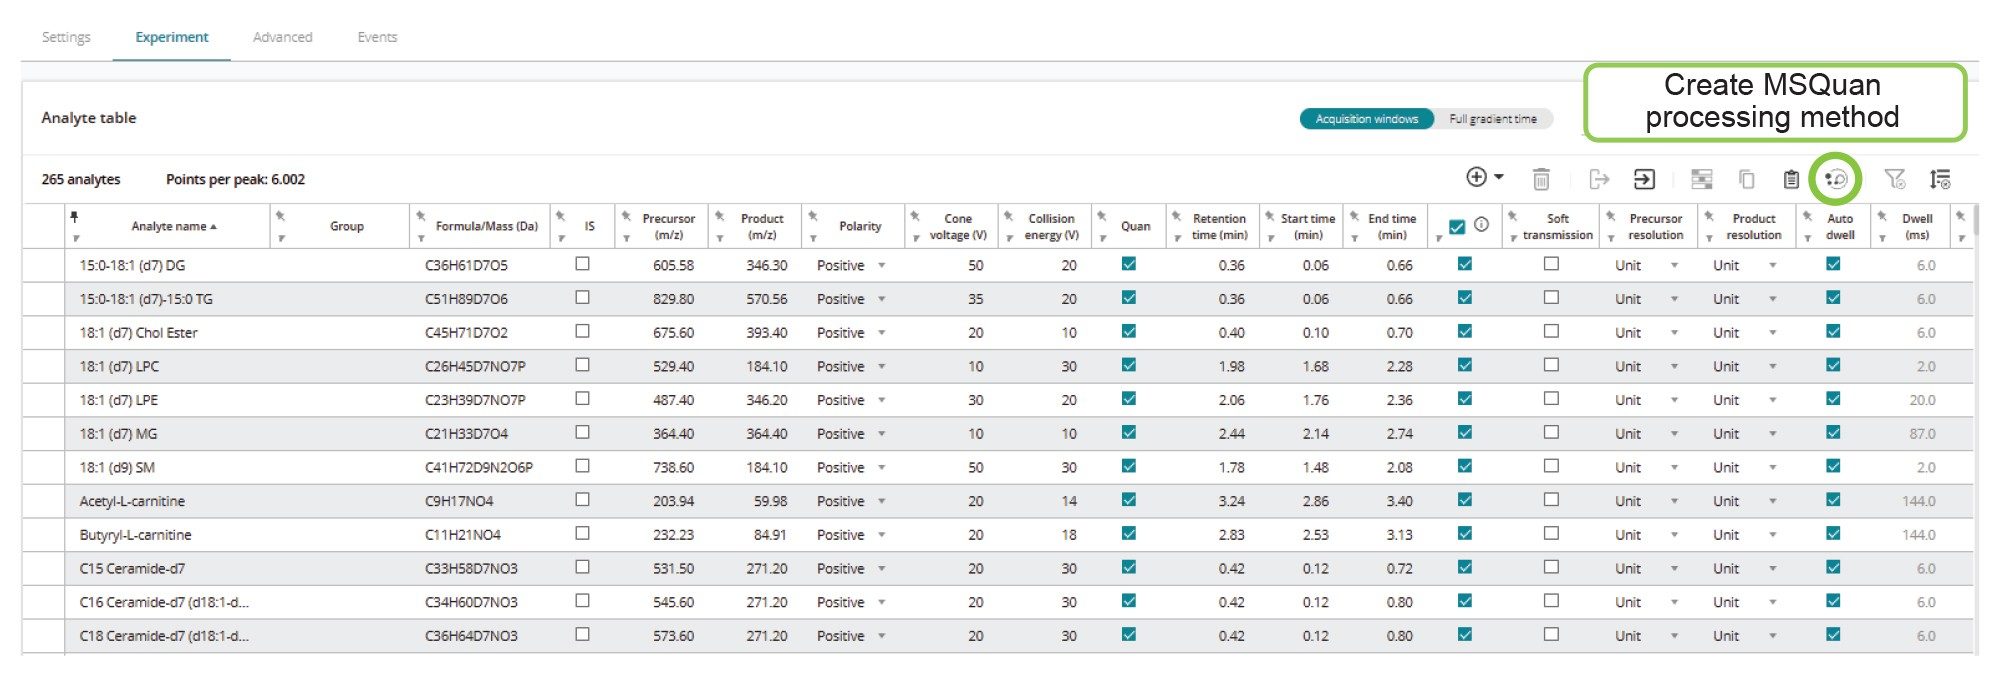
LC-MS/MS method was defined in the waters_connect Acquisition Manager. Time-based scheduling of the MRM transitions was employed to maximize MS dwell time and ensure that >8 points per peak were acquired for each lipid MRM transition, as shown in Figure 2. Data acquisition was controlled by waters_connect Sample Submission Application. The samples were queued in two separate batches, one for +ve ESI and one for -ve ESI mode, with the two data collected sequentially. A total of 239 and 232 lipids were measured in +ve ESI and -ve ESI modes, respectively. Robust data acquisition over the course of the study was ensured by the Stepwave™ XR Ion Guide of the Xevo TQ Absolute XR Tandem Quadrupole Mass Spectrometer, which prevents high mass ions contaminating the resolving quadrupole of the mass spectrometer.4
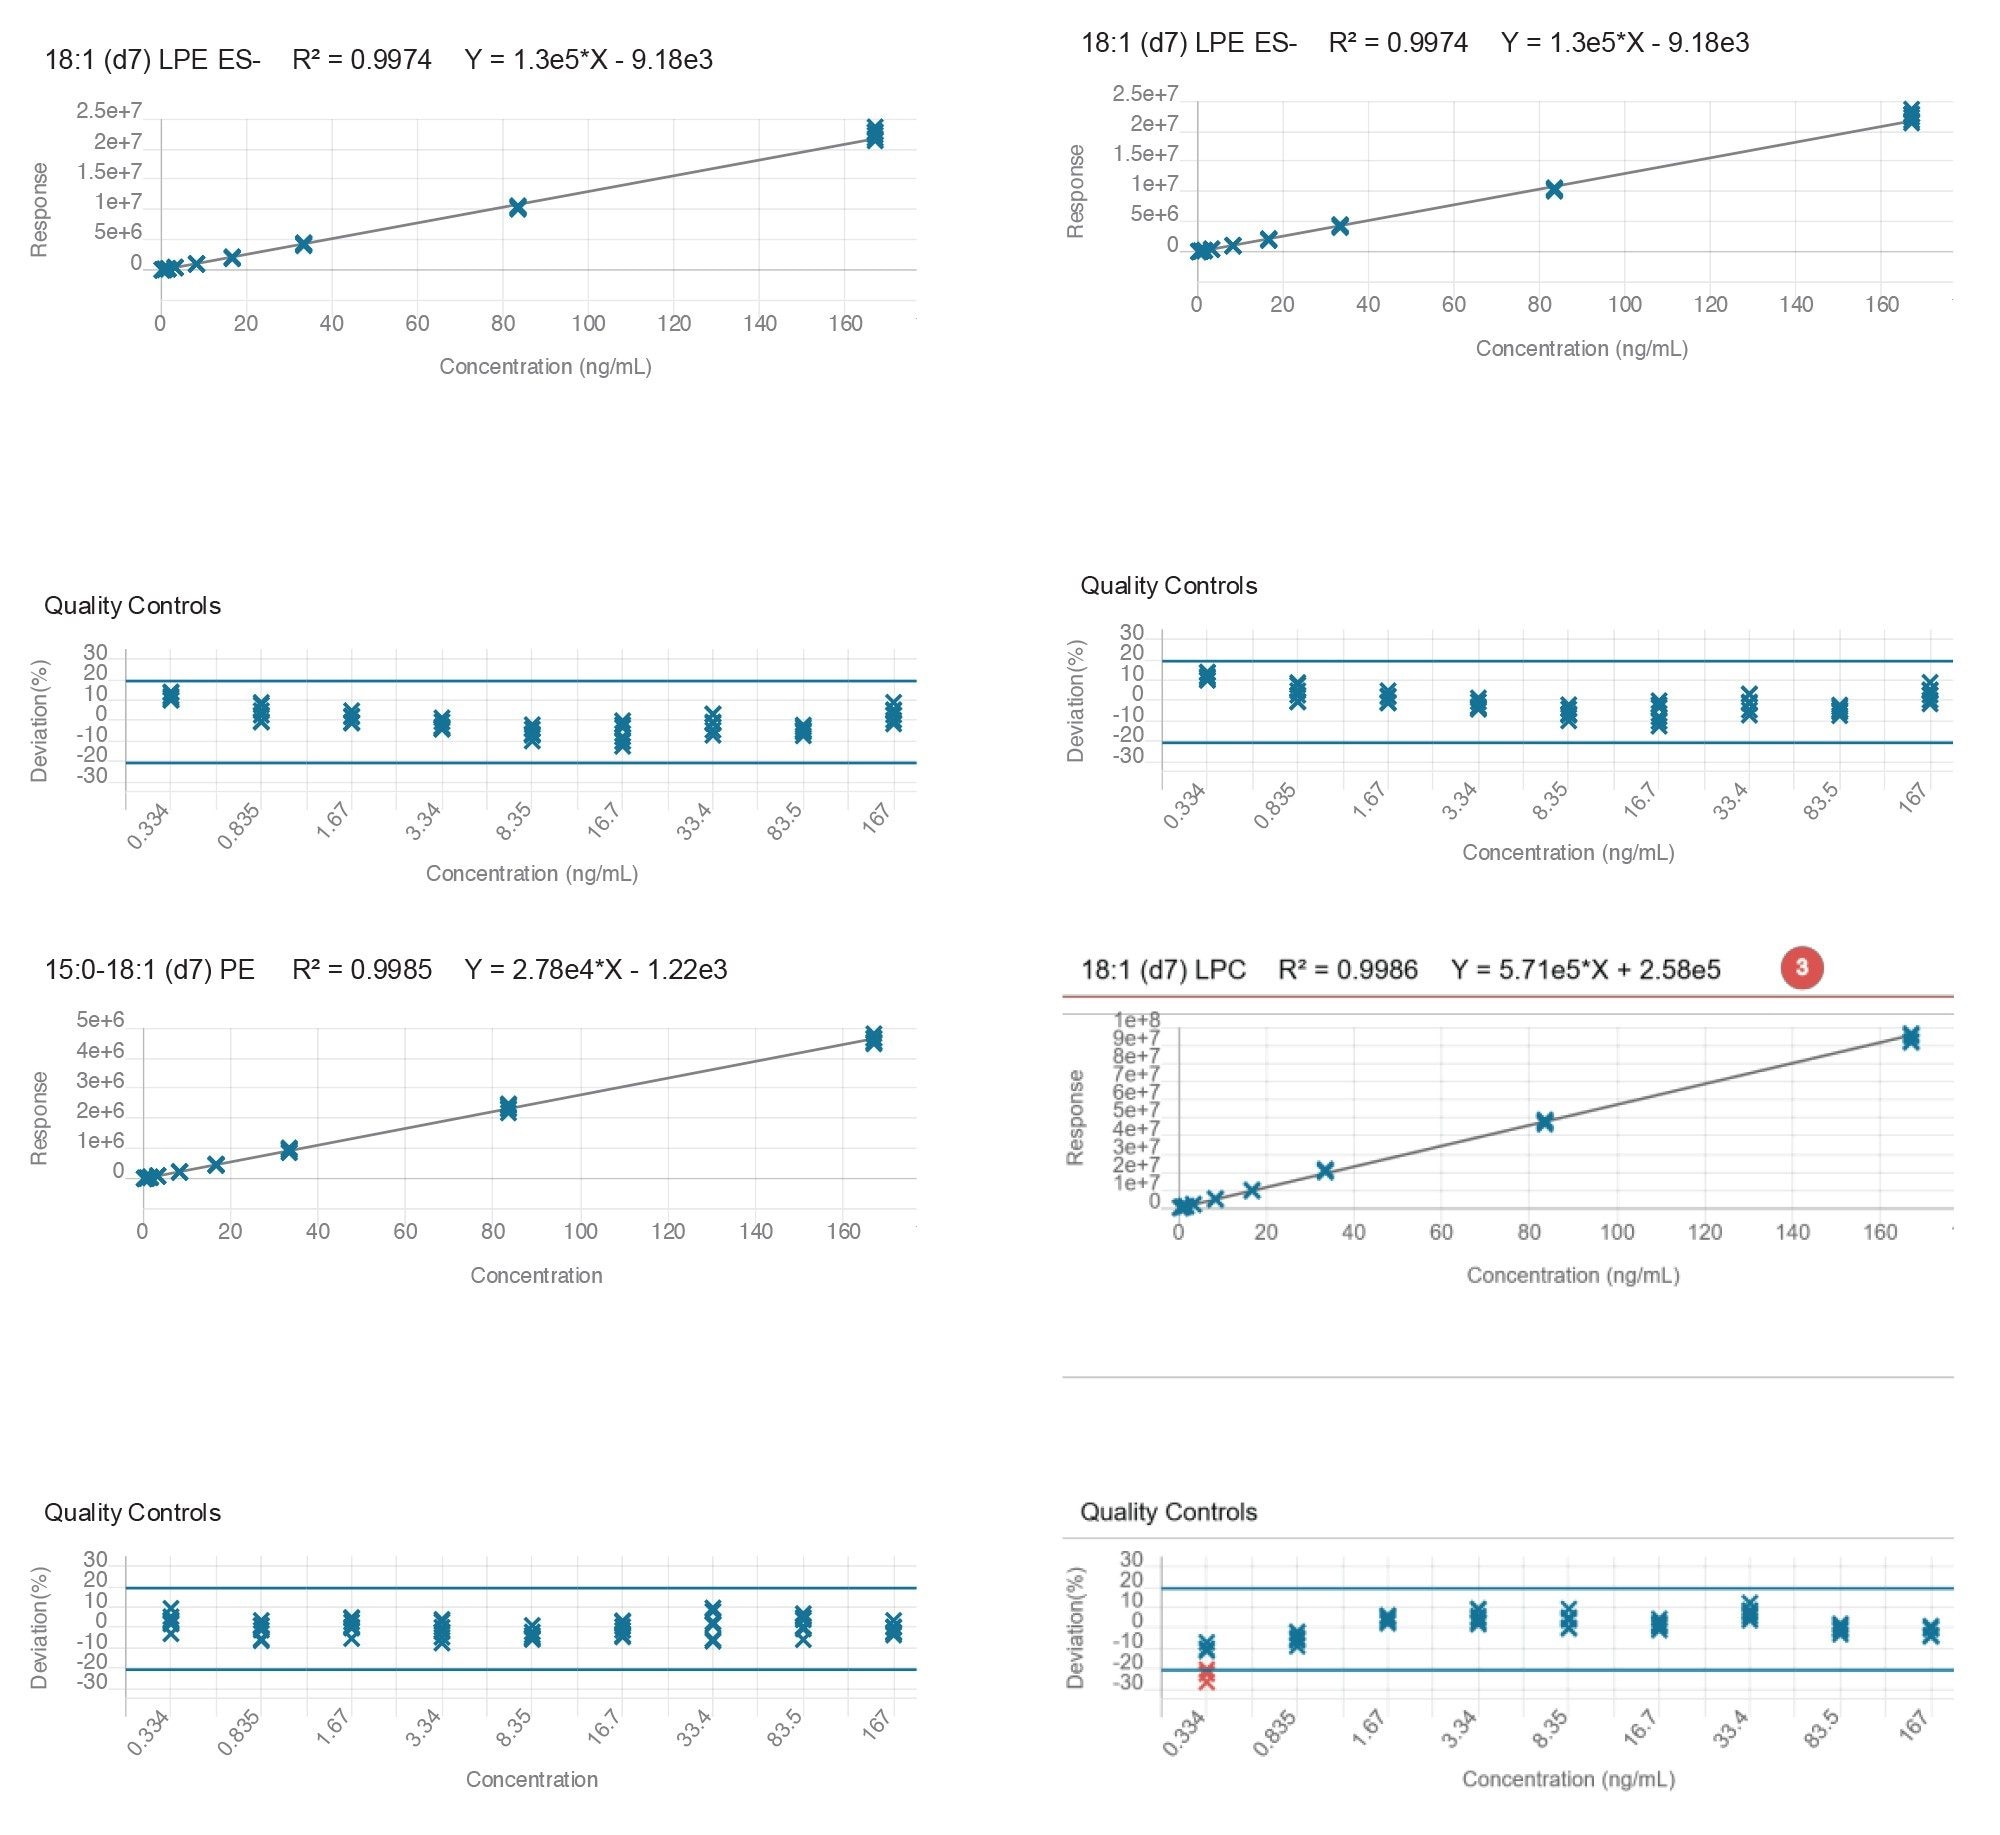
Lipid concentrations were quantified using the MS Quan Application in the waters_connect Software Platform; the acquisition method was created in the software. The individual concentrations of the EquiSPLASH calibration line were input into LEVELS tab in the MS Quan Application method, as shown in Figure 3a, and the response curve created from the EquiSPLASH curve was used to determine the concentration of the plasma lipids from the same class, as shown in Figure 3b. Quantification was performed via the construction of calibration curves using linear regression and 1/x weighting. A total of nine concentration levels were constructed to define the quantification range of 0.334-167 ng/mL. Representative calibration curve obtained for the lipids 18:1 (d7) LPE, 18:1 (d9) SM, 15:0 18:1 (d7) PE and 18:1 (d7) LPC are shown in Figure 4.
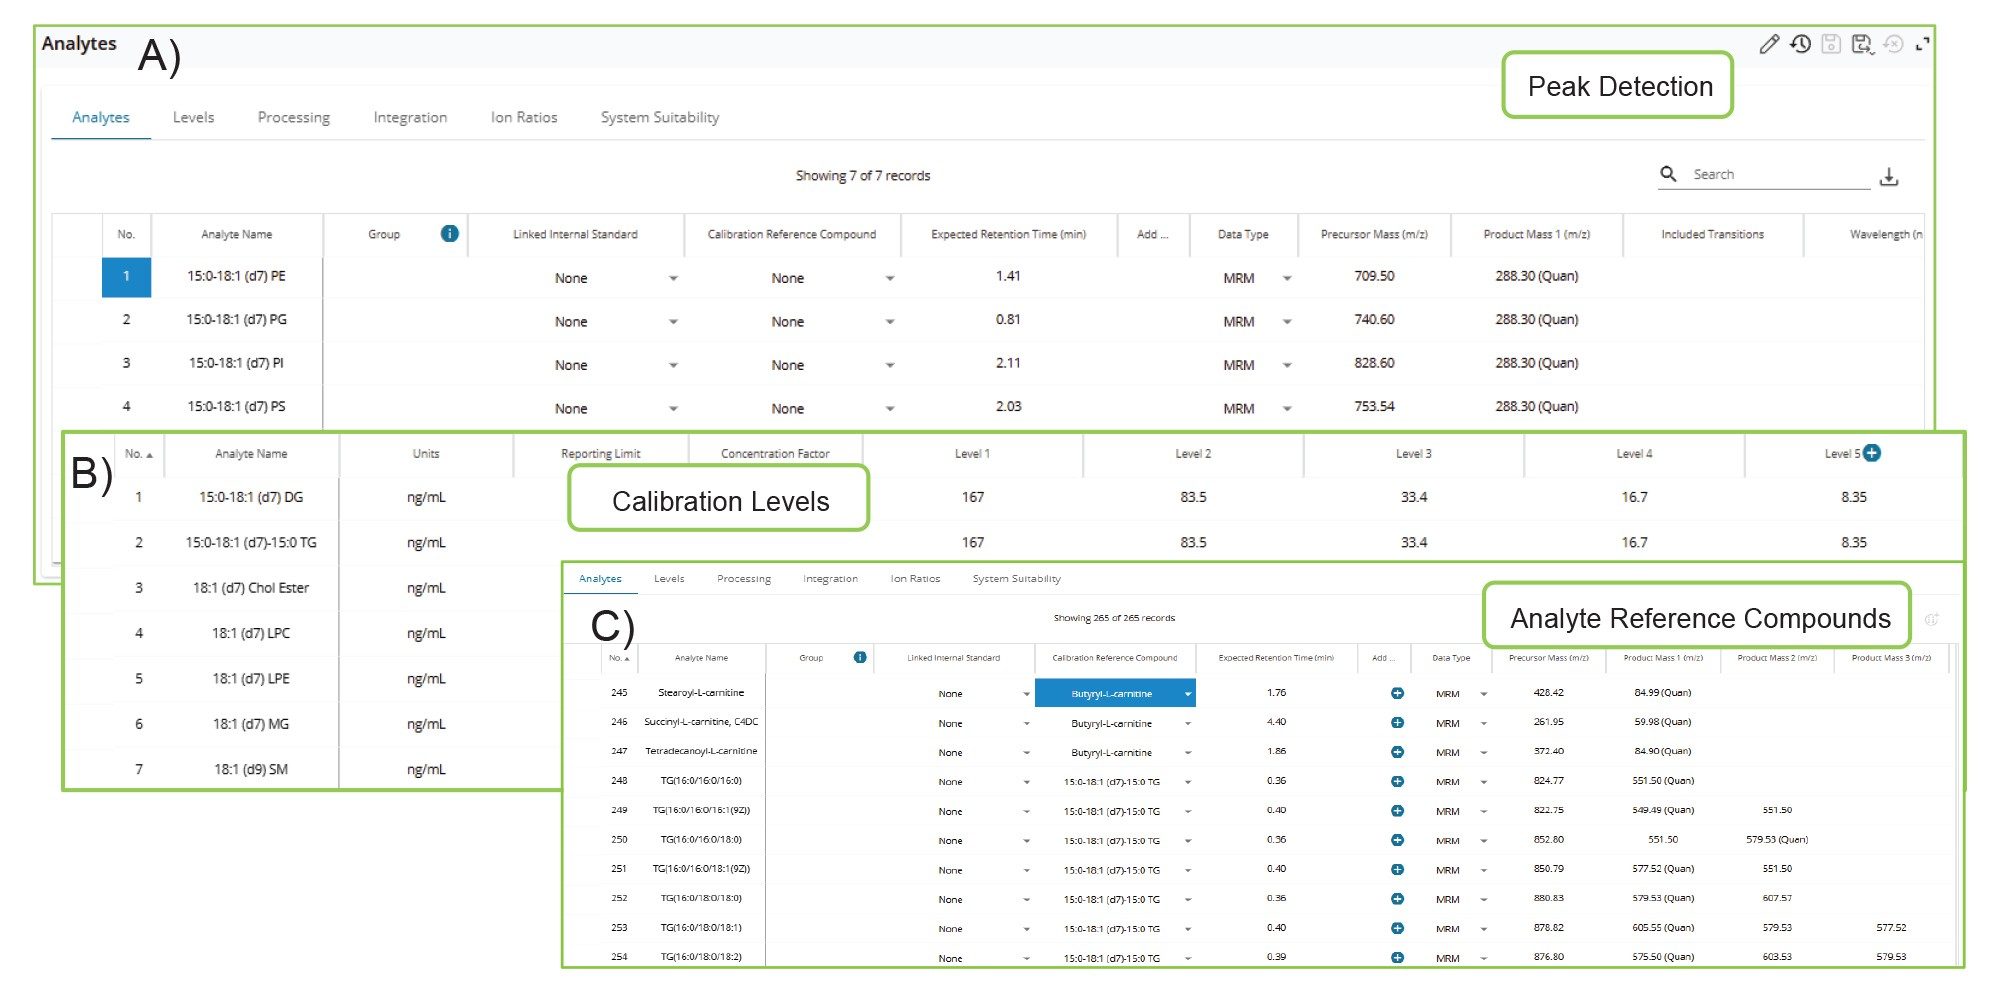
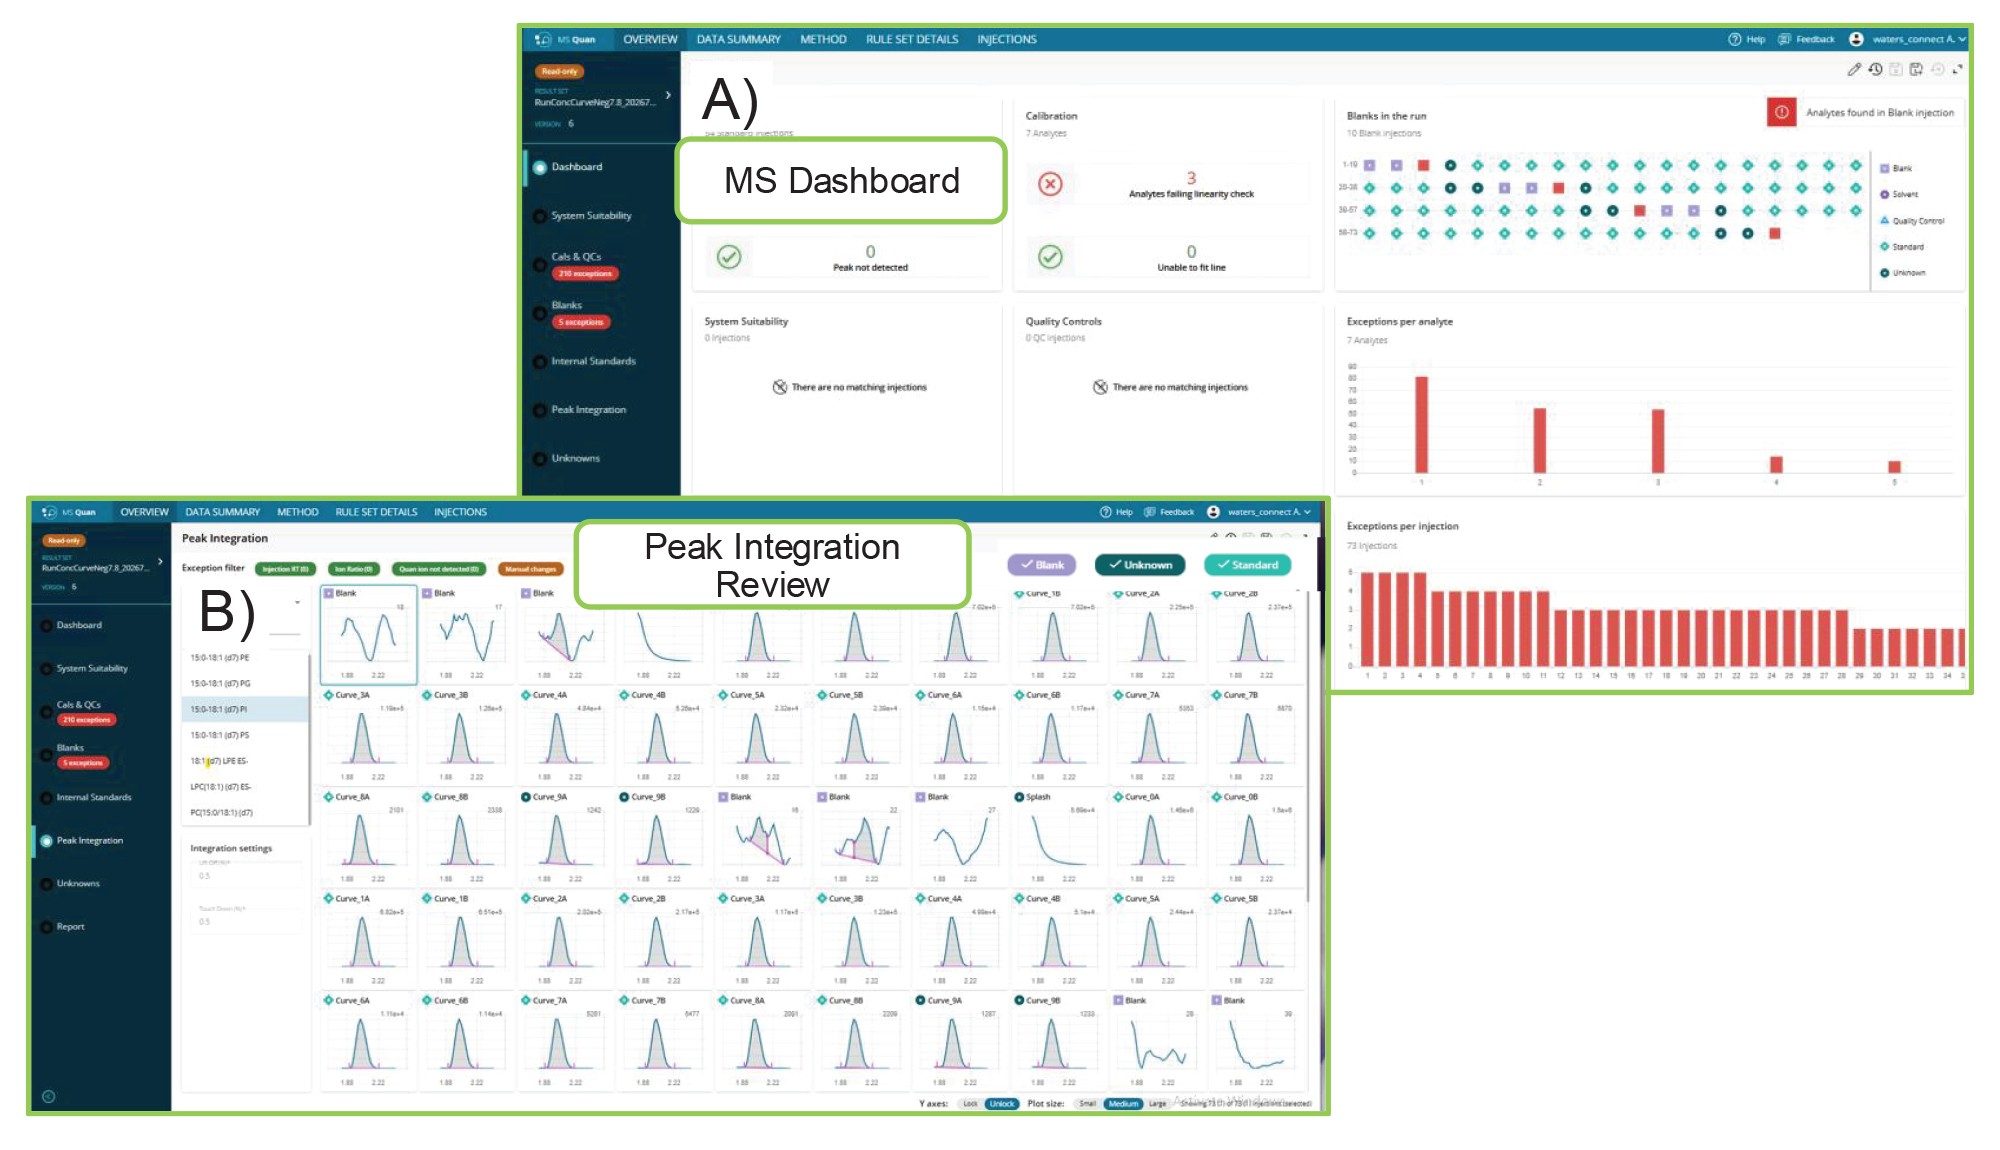
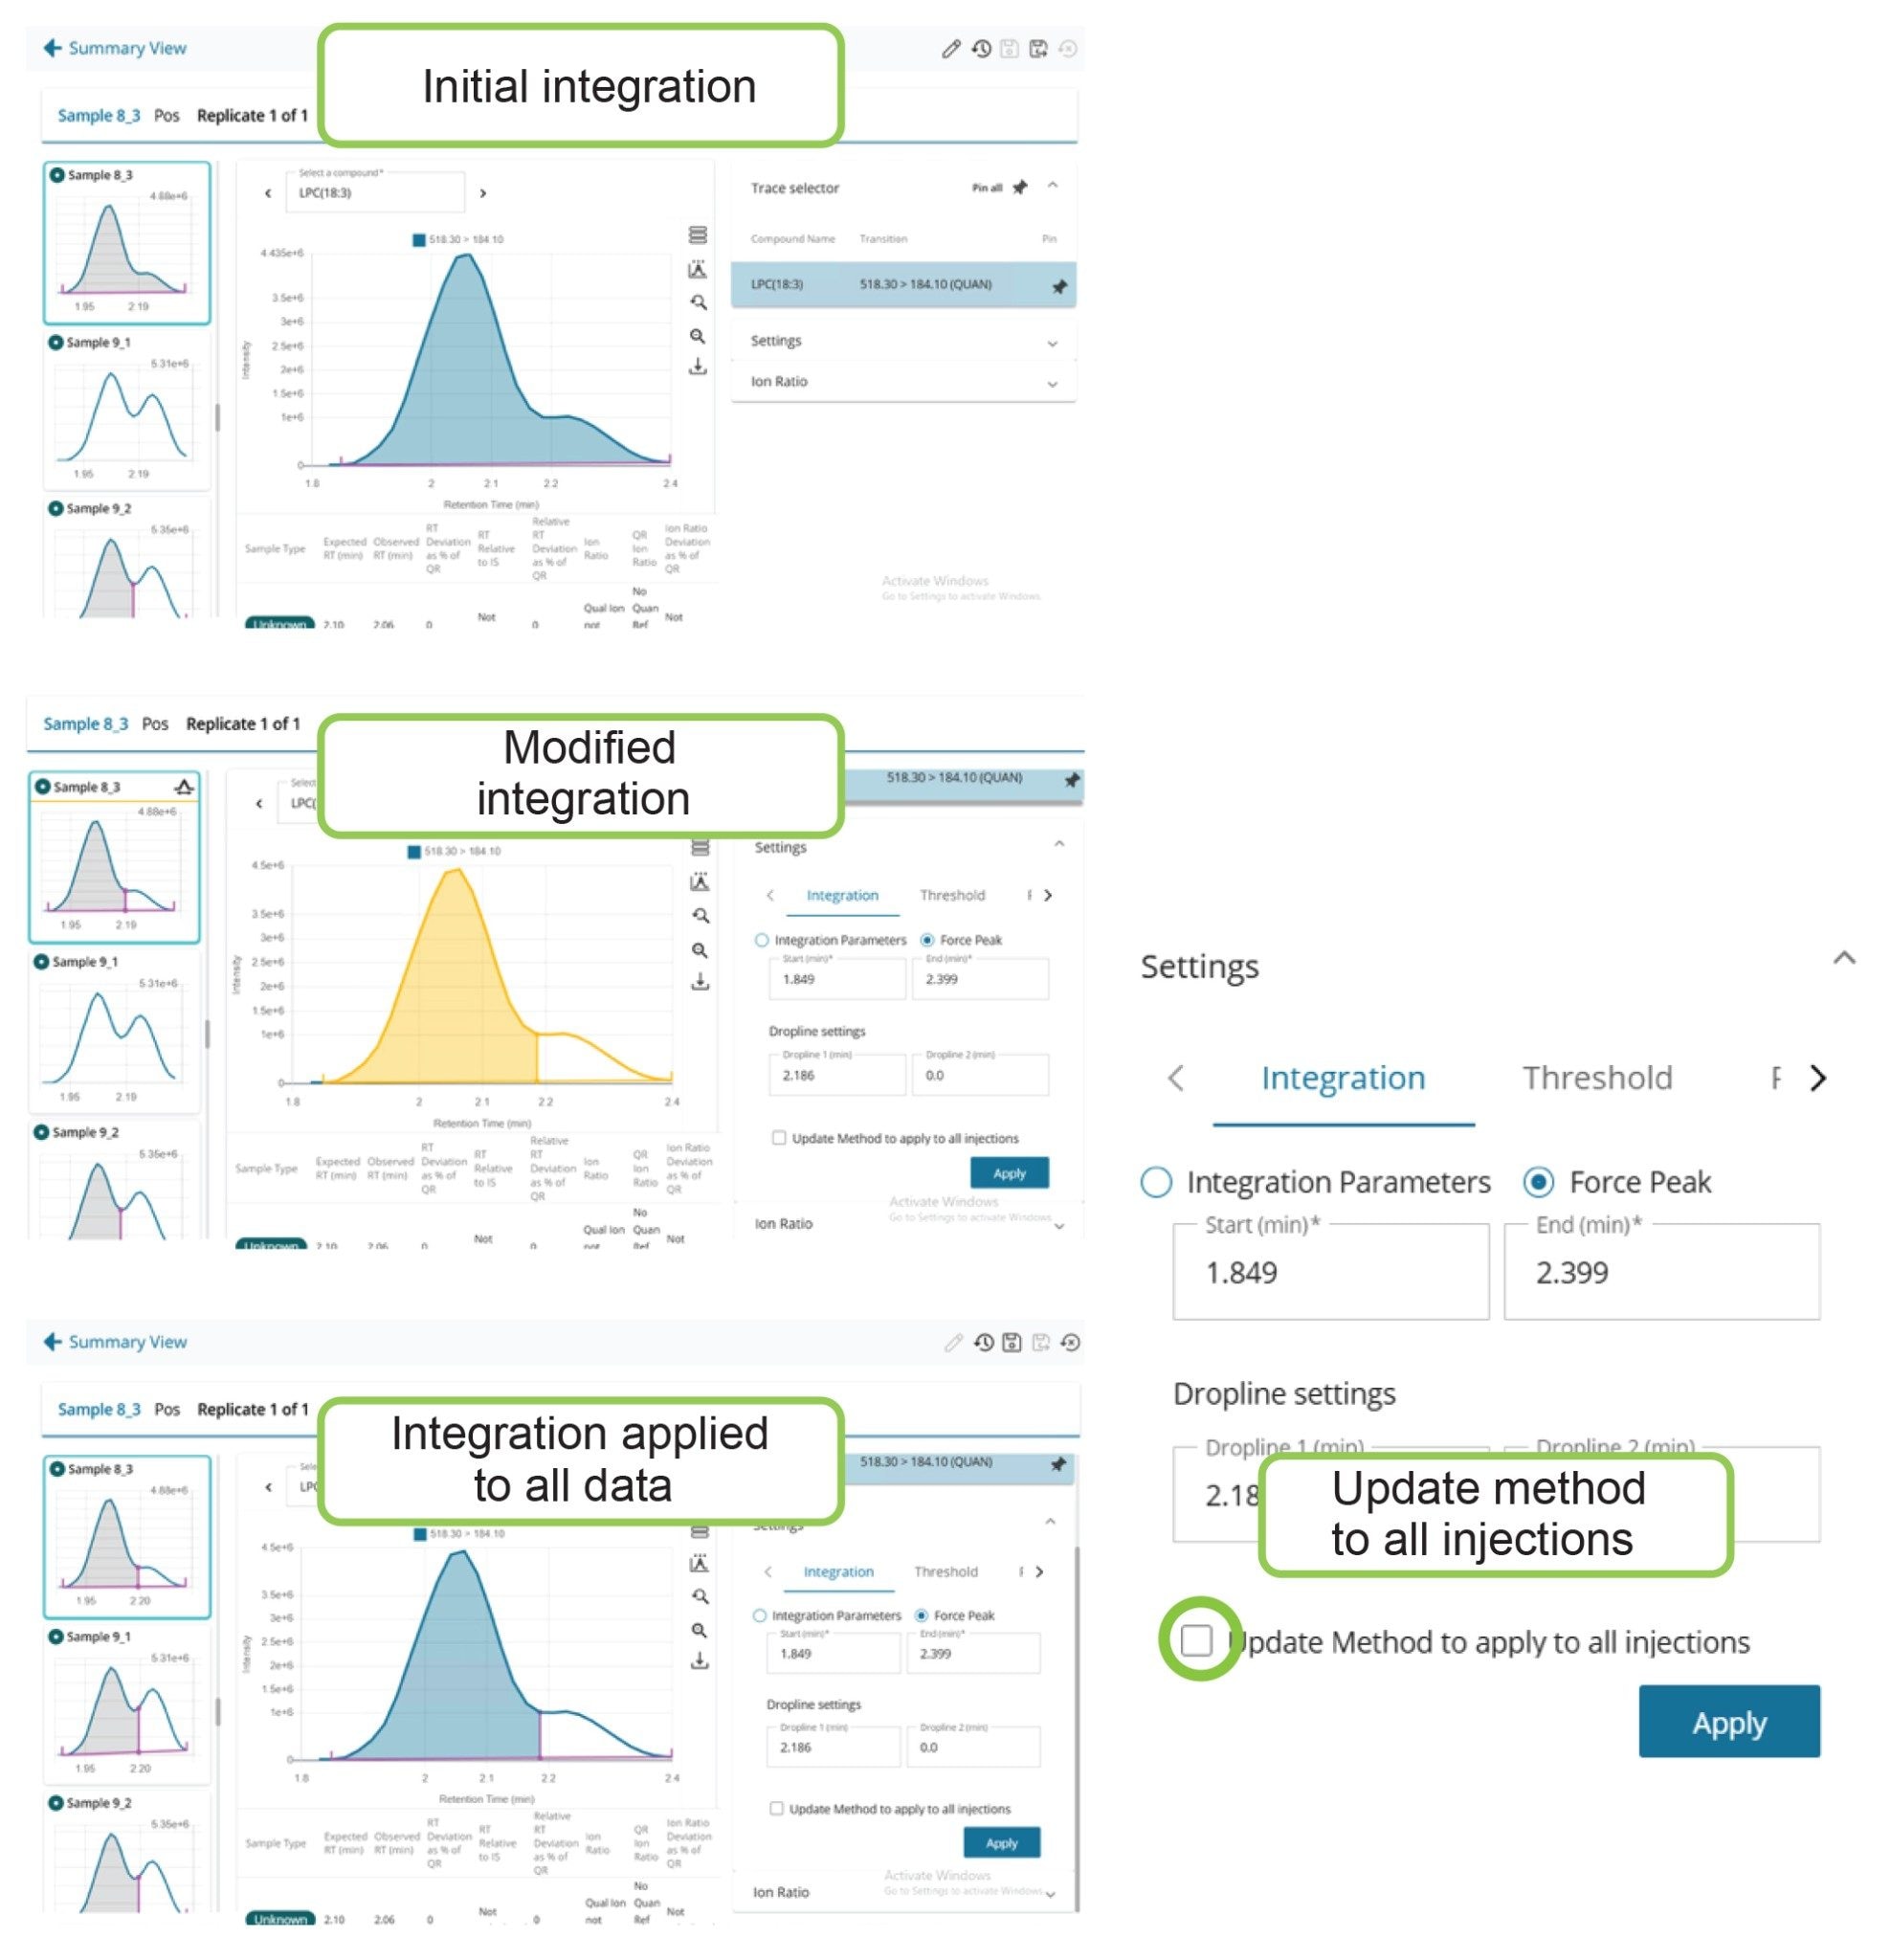
The large number of lipids monitored (>440), combined with the complex nature of lipids, the HILIC separation mechanism, and number of lipid isomers isobaric results in the close elution of lipid species. These factors make baseline allocation review a complex and time-consuming process. MS Quan Application offers a rapid approach to data analysis allowing the scientist to review the data in one simple interface, as shown in Figure 5. Using a review by exception approach, allows scientist to quickly check calibration, QCs, and blanks for the whole data set or for individual compounds (Figure 5).
The generation of accurate quantitative measurements of lipids provides insight into lipid dysregulation as a result of pathophysiological process, genetics, environmental exposure, and other factors. LipidQuan is a validated HILIC-MS/MS-based method for the quantification of over 400 bioactive lipids in biofluids and tissues. The Xevo TQ Absolute XR Tandem Quadrupole Mass Spectrometer combined with waters_connect Software has been employed to streamline the acquisition and data analysis lipid concentrations in rat plasma. The high-speed MRM acquisition capability of the Xevo TQ Absolute XR Tandem Quadrupole Mass Spectrometer allowed for the collection of over 430 MRM transitions in just 5 minutes while the robustness of the StepWave XR Ion Guide ensured robust performance for the duration of the study. Data acquisition, peak integration, and lipid quantification was simplified by waters_connect for Quantitation Software and the MS Quan Application.
Perrotti, F.; et al. Advances in Lipidomics for Cancer Biomarkers Discovery. Intl. J. Mol. Sci. 2016, 17, 1992. DOI: 10.3390/ijms17121992.
Havulinna, A. S.; et al. Circulating Ceramides Predict Cardiovascular Outcomes in the Population-Based FINRISK 2002 Cohort. Arterioscler. Thromb. Vasc. Biol. 2016, 36, 2424–2430. DOI: 10.1161/ATVBAHA.116.307497.
Munjoma, N.; et al. High Throughput LC-MS Platform for Large Scale Screening of Bioactive Polar Lipids in Human Plasma and Serum. J. Proteome Res. 2022, 21, 2596–2608. DOI: 10.1021/acs.jproteome.2c00297.
Foddy, H.; et al. A 30,000 Injection Assessment of Xevo TQ Absolute XR Mass Spectrometer Quantitative Stability and Uptime for Analysis of Naltrexone for Clinical Research. Waters Application Note. 720009342. May, 2026.
720009559, September 2026


