
Quantifying ADC Molar Mass, Aggregates, Drug-Antibody Ratio (DAR), and Extinction Coefficient by LC-MALS
Hongjiang Leo Liu, Sophia Kenrick
Waters Corporation, United States
Published on November 05, 2026

Abstract
Liquid chromatography combined with multi-angle light scattering (LC-MALS) is a powerful tool for analyzing antibody-drug conjugates (ADCs), providing a robust approach to obtain, in a single run, multiple quality attributes such as aggregation, fragmentation, drug-antibody ratio (DAR), and ADC extinction coefficient. Here, an easy-to-implement platform method for size-exclusion chromatography coupled with MALS detection (SEC-MALS) was demonstrated to analyze ADC quality attributes under native conditions. Orthogonal techniques, such as reverse-phase chromatography (RPC) and hydrophobic interaction chromatography (HIC), offer insight into the distribution of payload variants.
Benefits
- LC-MALS with UV and differential refractive index (dRI) detection quantifies multiple ADC quality attributes simultaneously across size-exclusion chromatography (SEC), RPC, and HIC
- SEC-MALS with UV and dRI can be a platform method for routine characterization of molar mass, aggregation, and DAR of in-process ADC samples
- The ADC Analysis Module in the ASTRA™ Software provides a complete ADC workflow, including determination of extinction coefficients and dn/dc
Introduction
Small molecule therapeutics conjugated to monoclonal antibodies (mAbs) represent a large and fast-growing modality for immunotherapy and oncology. By combining the selectivity of a tumor-targeting mAb with a powerful cytotoxic drug, ADCs can attack disease sites while reducing general cytotoxicity and side effects. Adcetris™ (brentuximab vedotin) was granted accelerated approval by the US FDA in 2011 for the treatment of relapsed or refractory Hodgkin lymphoma and anaplastic large cell lymphoma. Kadcyla™ (trastuzumab emtansine) was the first FDA-approved ADC to treat solid tumors in 2013.1 As of 2025, 15 ADCs have been approved by the FDA with over 1300 active clinical trials in 2024.2
Therapeutic small molecules are linked to targeting antibodies most commonly via lysine or cysteine conjugation.3 Lysine conjugation makes use of the antibody’s approximately 20 surface lysines. The resulting ADC is significantly heterogeneous in payload distribution and stoichiometry, with 1 to 9 drugs typically conjugated to each antibody.4 In cysteine conjugation, the disulfide bonds in the antibody are broken to open for conjugation. This resulted in a more predictable stoichiometry; the drug distribution should follow the stoichiometry of the inter-chain disulfide bonds resulting in DAR of 2, 4, 6, or 8.4 However, the antibody may be structurally compromised depending on the location of the broken disulfide bond.3,5 Besides utilizing natural lysines and cysteines, there are also attempts to use specific engineered sites to host the conjugation to reduce heterogeneity although, as of early 2024, no FDA-approved ADC uses site-specific conjugation.6
LC-MS and LC-UV have been widely adopted to measure average DAR, DAR distribution, and free drug analysis. LC-MS is also used to identify conjugation sites. However, no efficient workflow exists to characterize ADCs aggregation, fragmentation, and DAR in a single platform. Typically, intact mass spectrometry (MS) is explored for DAR analysis, but it often cannot be operated under native conditions and may dissociate or underestimate aggregates. SEC with dual-channel UV detection can be used routinely for aggregation screening and DAR analysis. However, SEC-UV alone is insufficient for absolute molar mass measurement, which is important in understanding the nature of aggregation. This makes SEC-UV alone inadequate for complex samples such as heterogeneous ADC formulations.
Here, a platform SEC-MALS method for analysis of multiple ADC quality attributes is demonstrated. SEC-MALS combined with UV detection at two wavelengths enable routine quantitation of antibody monomer and aggregates, average DAR, and ADC extinction coefficients. In this way, SEC-MALS can complement intact MS and enzyme-linked immunosorbent assay (ELISA) for average DAR and ADC concentration. Combining RPC or HIC with MALS can give deeper insights into payload heterogeneity and provide confirmation of peak identity.
Experimental
Sample Preparation
Unconjugated trastuzumab and trastuzumab emtansine (T-DM1) were purchased from Besse Medical. Unconjugated brentuximab and brentuximab vedotin (cAC10-vcMMAE) were purchased from Selleck Chemicals. Samples were reconstituted according to the supplier’s protocol.
Method Conditions
SEC-MALS, RPC-MALS, and HIC-MALS were performed using an ACQUITY™ Premier UPLC™ System with eλ PDA Detector, microDAWN™ MALS Photometer, and microOptilab™ dRI Detector. UV data were collected at 280 nm and 252 nm for T-DM1 and 280 nm and 248 nm for brentuximab vedotin, all with 1.2 nm bandwidth. Data were collected and analyzed using ASTRA Software. The autosampler was kept at 6 °C, and columns were kept at 25 °C throughout the experiments.
For SEC-MALS, separation was performed using an ACQUITY Premier Protein SEC Column, 1.7 µm, 250 Å, 4.6 mm x 150 mm (Waters). The mobile phase was Dulbecco’s PBS (10 mM Na2HPO4, 1.8 mM KH2PO4, 137 mM NaCl, 2.7 mM KCl, pH 6.7). The flow rate was 0.35 mL/min. For each measurement, 1 µL of T-DM1, 2 µL of trastuzumab, 2 µL of cAC10-vcMMAE, and 5 µL of brentuximab were injected.
For HIC-MALS, separation was performed using a Protein-Pak™ Hi Res HIC Column, 2.5 µm, 4.6 mm x 100 mm (Waters). Mobile phase A was 1.5 M (NH4)2SO4, 25 mM sodium phosphate, pH 7.0. Mobile phase B was isopropanol (25 % v/v) with 18.75 mM sodium phosphate, pH 7.0, 1 M NaCl (75 % v/v). For each measurement, 2 µL of brentuximab vedotin and 5 µL of brentuximab were injected. Samples are eluted with a gradient from 100% A to 0% A in 45 minutes. The flow rate was 0.75 mL/min. A single injection of buffer was run using the same gradient, and the data were used for Blank Baseline Subtraction of the light scattering and UV signals in the ASTRA Software processing methods.
For RPC-MALS, separation was performed using an ACQUITY Premier Protein BEH C4 Column, 1.7 µm, 300 Å, 2.1 mm x 50 mm (Waters). Mobile phase A was 0.05% trifluoroacetic acid (TFA) in water, and mobile phase B was 0.05% TFA in acetonitrile. Samples are eluted with a gradient from 75% A to 35% A in 4.4 minutes. The flow rate was 0.6 mL/min. For each measurement, 1 µL of T-DM1 and 2 µL of trastuzumab were injected. A single injection of buffer was run using the same gradient, and the data were used for Blank Baseline Subtraction of the light scattering and UV signals in the ASTRA Software processing methods.
LC-MALS Hardware and Software
|
LC system: |
ACQUITY Premier UPLC System |
|
Detection: |
eλ PDA Detector collecting at 280 nm, 252 nm, and 248 nm microDAWN MALS Photometer microOptilab dRI Detector |
|
Column temperature: |
25 °C |
|
Sample temperature: |
6 °C |
|
LC control software: |
HPLC CONNECT™ 4 Software |
|
Data collection and analysis software: |
ASTRA 8 Software with ADC Analysis Module |
SEC-MALS Method
|
Column: |
ACQUITY Premier Protein SEC Column, 1.7 µm, 250 Å, 4.6 mm x 150 mm |
|
Injection volume: |
1 µL (T-DM1) 2 µL (trastuzumab and cAC10-vcMMAE) 5 µL (brentuximab) |
|
Flow rate: |
0.35 mL/min |
|
Mobile phase: |
Dulbecco’s PBS (10 mM Na2HPO4, 1.8 mM KH2PO4, 137 mM NaCl, 2.7 mM KCl, pH 6.7) |
HIC-MALS Method
|
Column: |
Protein-Pak Hi Res HIC Column, 2.5 µm, 4.6 mm x 100 mm |
|
Injection volume: |
2 µL (cAC10-vcMMAE) 5 µL (brentuximab) |
|
Flow rate: |
0.75 mL/min |
|
Mobile phase A: |
1.5 M (NH4)2SO4, 25 mM sodium phosphate, pH 7.0 |
|
Mobile phase B: |
Isopropanol (25% v/v) with 18.75 mM sodium phosphate, pH 7.0, 1 M NaCl (75% v/v) |
|
Gradient: |
100% A to 0% A in 45 minutes |
RP-MALS Method
|
Columns: |
ACQUITY Premier Protein BEH C4 Column, 1.7 µm, 300 Å, 2.1 mm x 50 mm |
|
Injection volume: |
1 µL (T-DM1) 2 µL (trastuzumab) |
|
Flow rate: |
0.6 mL/min |
|
Mobile phase A: |
0.05% trifluoroacetic acid (TFA) in water |
|
Mobile phase B: |
0.05% TFA in acetonitrile |
|
Gradient: |
75% A to 35% A in 4.4 minutes |
Results and Discussion
mAb System Suitability Controls
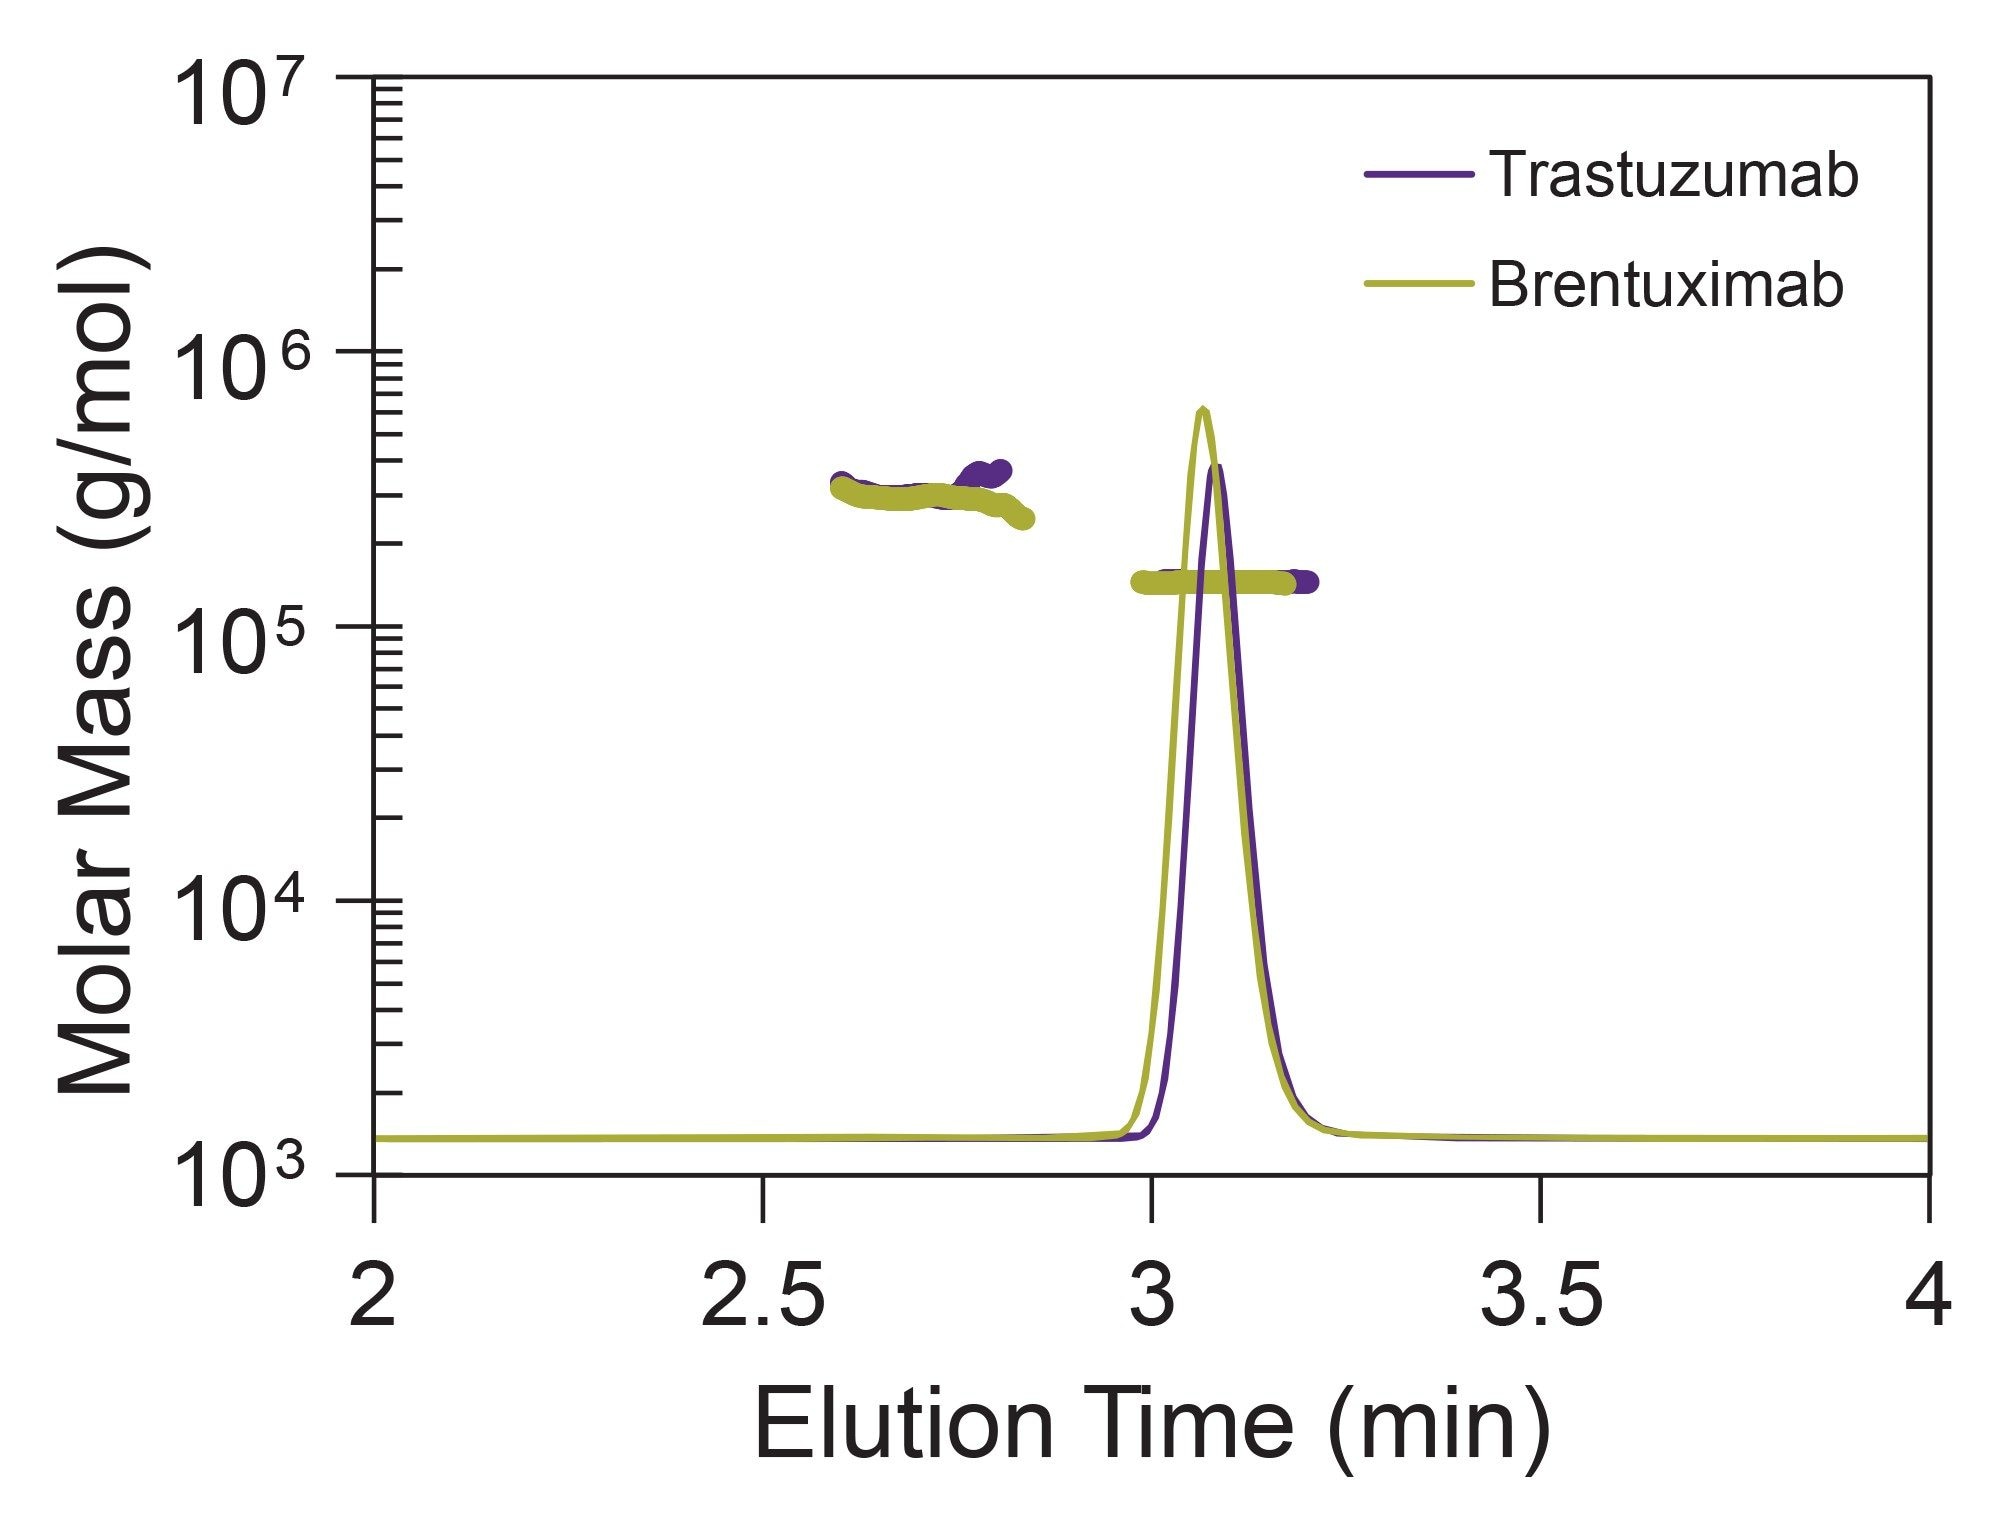
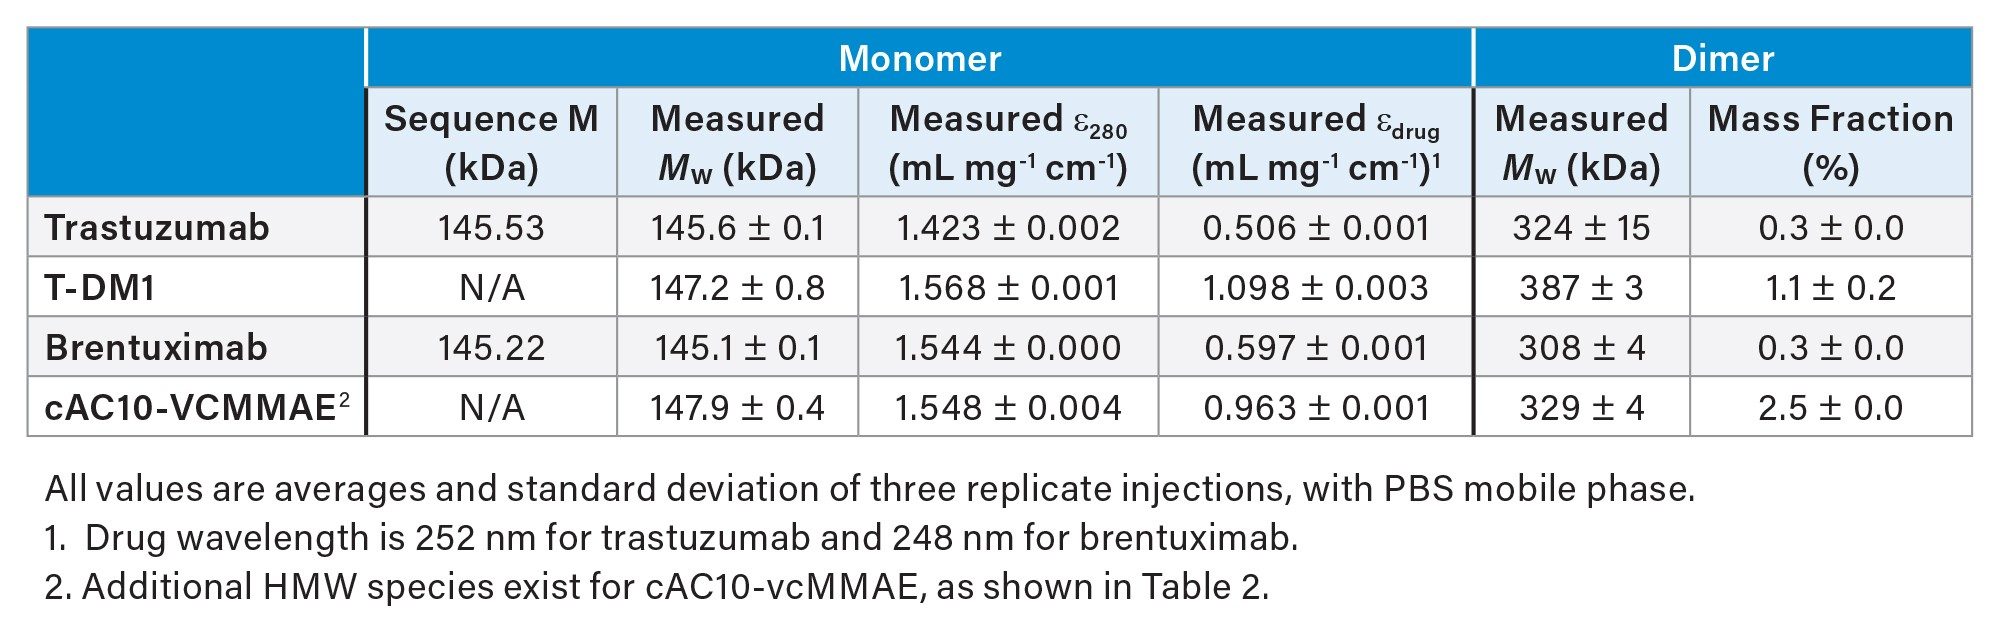
To enable accurate conjugate analysis for the ADC samples, the molar mass and extinction coefficients of the unconjugated mAbs by SEC-MALS was first quantified (Figure 1). Both unconjugated trastuzumab and brentuximab contain more than 99% monomer with approximately 0.3% dimer (Table 1). The measured molar mass agreed with the expected sequence value.
In addition, SEC-MALS-UV-RI enables the direct measurement of the UV extinction coefficients of the molecules. The extinction coefficient was measured at 280 nm and at the absorbance maximum of the conjugated drug and linker: 252 nm and 248 nm for T-DM1 and cAC10-vcMMAE, respectively (Table 1). These values were then used for the determination of the DAR in all LC-MALS experiments.
SEC-MALS: Routine Analysis of ADC Molar Mass, Aggregation, Extinction Coefficient, and DAR in a Single Experiment
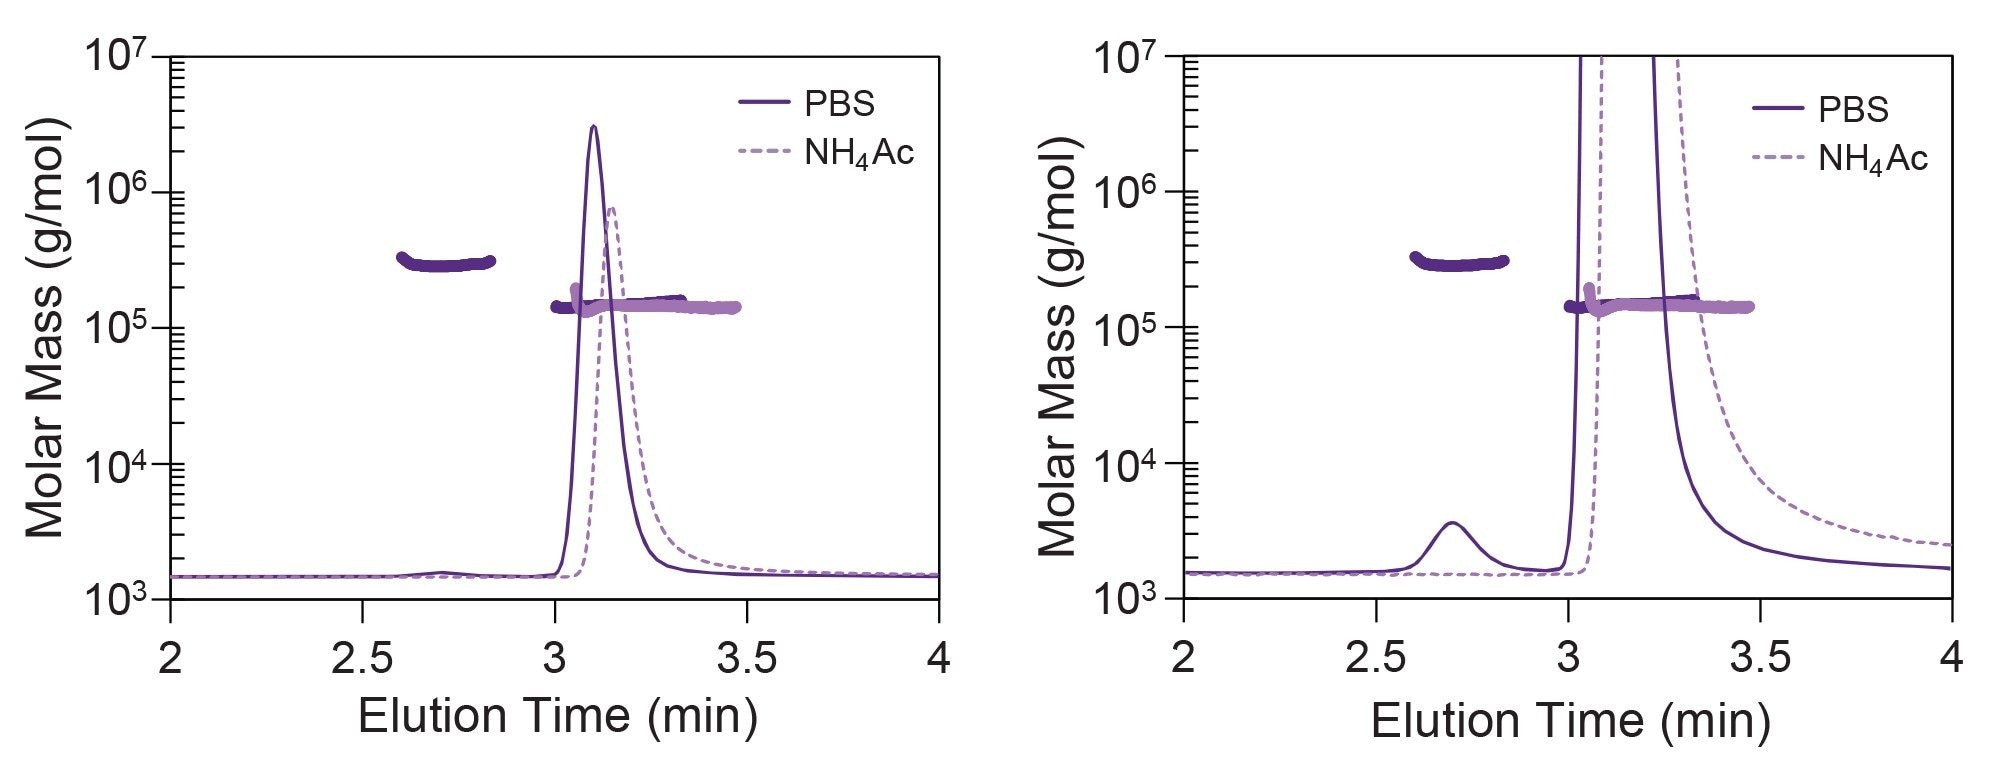
SEC, as a simple isocratic elution method, is suitable for routine ADC analysis. Since SEC can be performed under physiologically relevant conditions, it may be more suitable for aggregation study than RPC or HIC. The results can also be used for bridging studies with mass spectrometry or other orthogonal methods. As a first analysis, T-DM1 by SEC-MALS was evaluated with two different mobile phases: phosphate-buffered saline, representing physiological conditions, and 50 mM ammonium acetate (NH4Ac), commonly used for native MS. In this case, a small amount of dimer is evident using the physiological PBS mobile phase, but this species is missing in the ammonium acetate (Figure 2).
Simultaneous collection of UV absorbance and dRI detection enables measurement of the extinction coefficients for the intact ADC at 280 nm and any other desired wavelength, as for the bare mAb and other suitability standards. Since amino acid analysis is insufficient for measuring the extinction coefficient to conjugated proteins, like ADCs, SEC-MALS-UV-RI represents one of the only methods that can be used to quantify this critical parameter. These results, summarized in Table 1, enable more accurate determination of the ADC concentration by a UV spectrometer. For example, using the extinction coefficient for trastuzumab to determine the concentration of T-DM1 would overestimate the concentration by 10%.
SEC-MALS with UV absorbance at two wavelengths enables direct measurement of the composition of the eluting species, thus providing insight into the average DAR and DAR heterogeneity of each peak. The same experiment used to determine the extinction coefficient and aggregation profile for the intact ADC was also used to determine the average DAR for two ADCs.
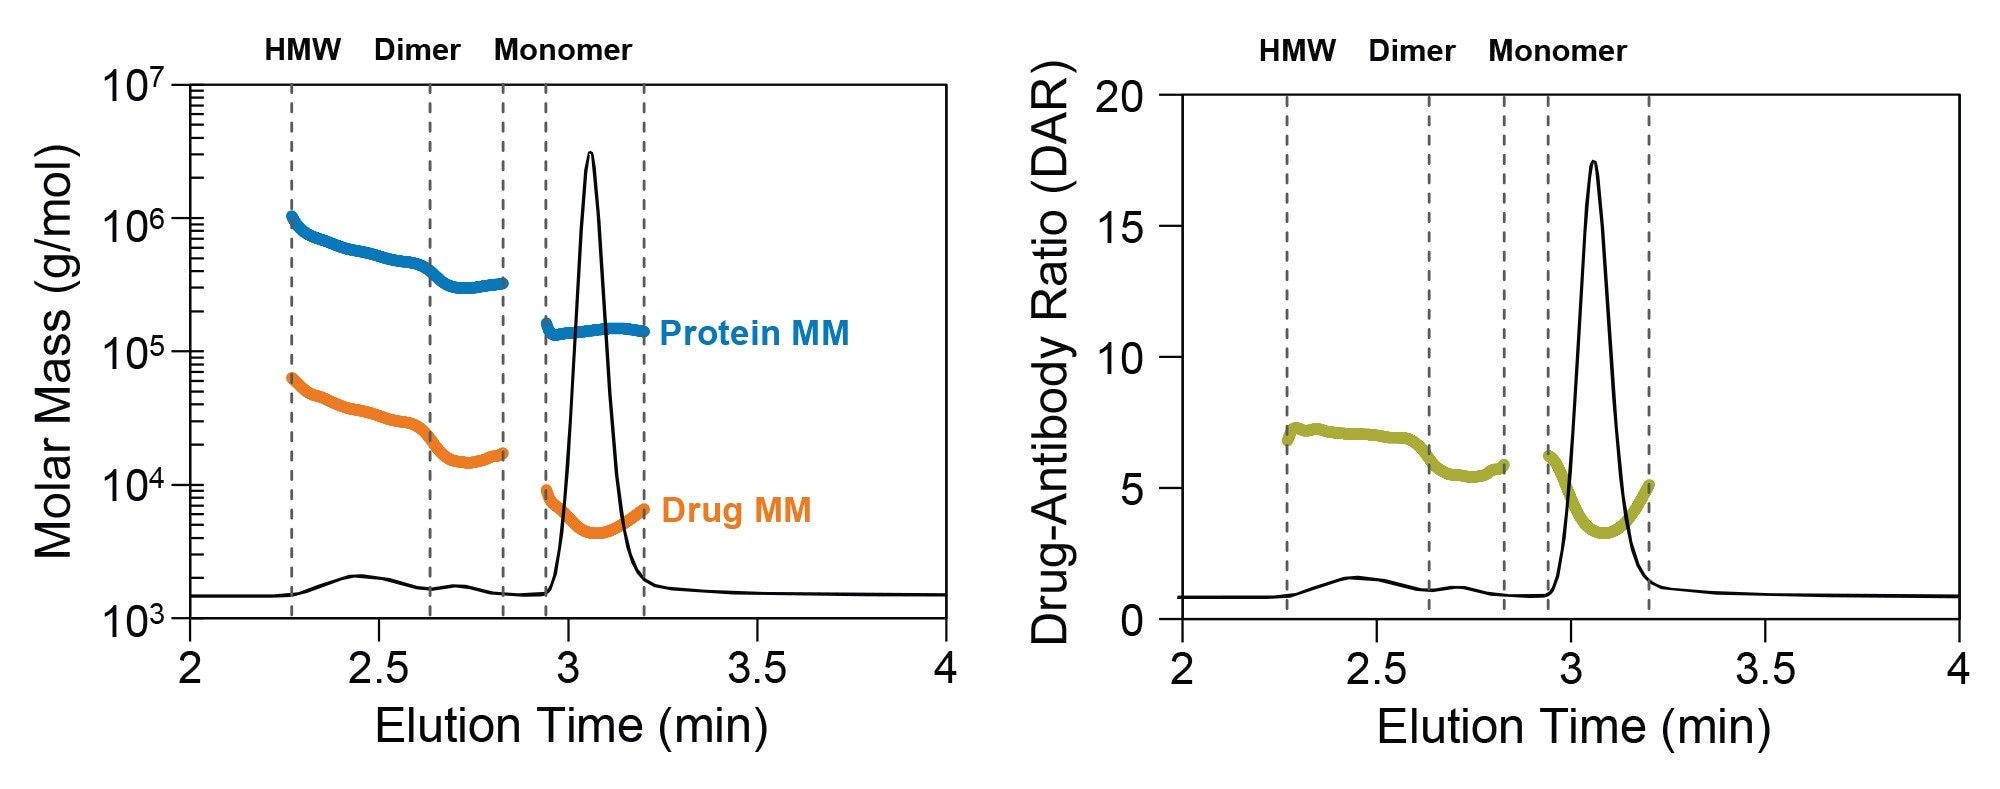
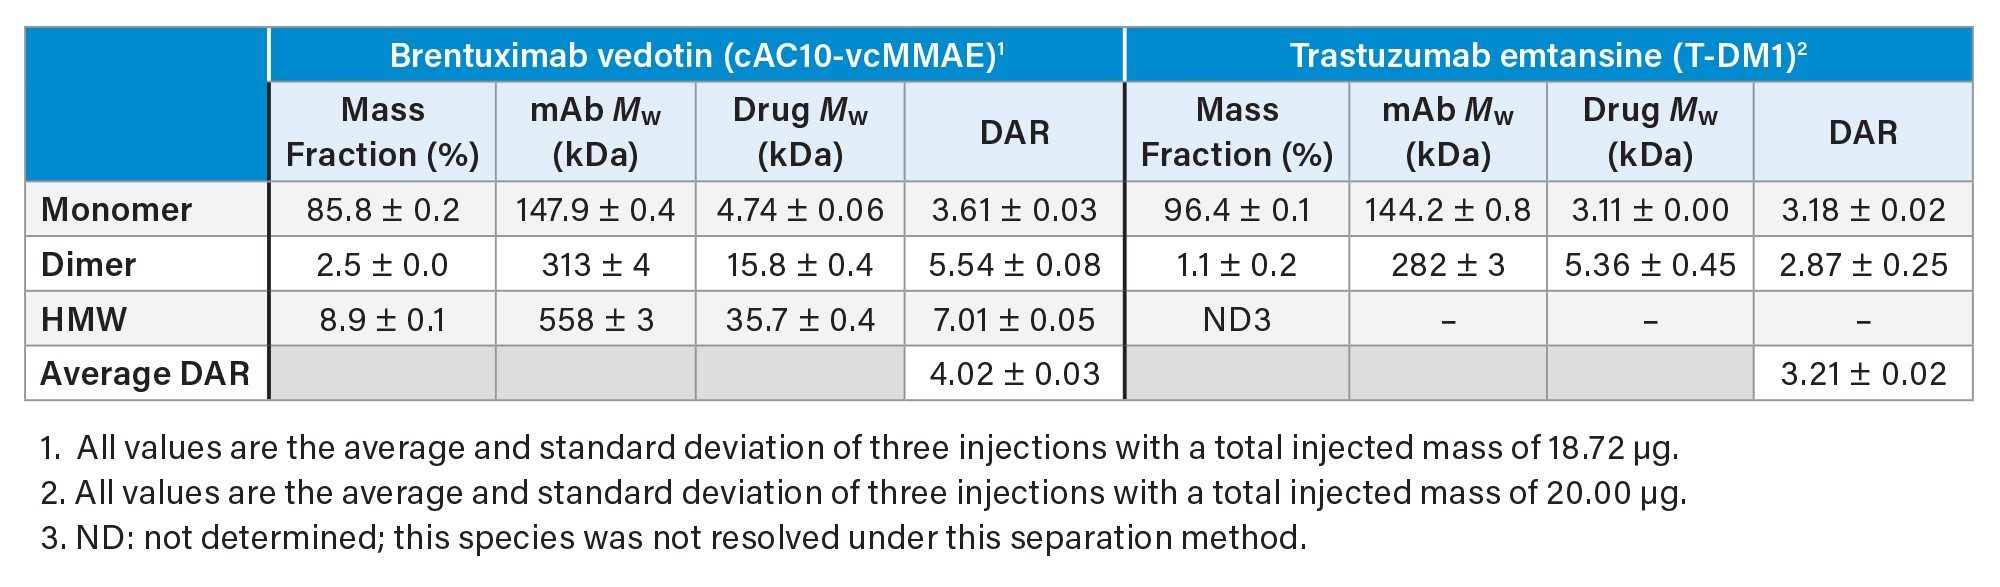
Brentuximab vedotin (cAC10-vcMMAE) consists of a mAb directed against CD30 conjugated to monomethyl auristatin E (MMAE; drug-linker MW = 1317 g/mol). The MMAE is coupled via cysteine conjugation with expected overall DAR of 4.2.7,8 SEC-MALS confirmed that the main species is a monomer with average DAR of 3.6 (Figure 3). This value indicates a co-elution of ADCs with multiple DAR, with the predominant species likely exhibiting DAR of 4 and 2. In addition to the monomer species, SEC-MALS showed that cAC10-vcMMAE contains dimers (2.3% w/w) and HMW aggregates (9% w/w) with higher DAR compared to the monomer (Table 2). This may indicate that species with higher conjugation ratios are more likely to form aggregates. The overall DAR considering all eluted peaks is 4.0, in good agreement with the specified value.
Trastuzumab emtansine (T-DM1) is composed of anti-HER2 antibody trastuzumab and a maytansine derivative (DM1; drug-linker MW = 956 g/mol), linked via lysine conjugation. Although over 80 sites are available for conjugation, it is expected that an average of 3.5 DM1 molecules are conjugated to each mAb.9 As a lysine-conjugated ADC, its payload distribution is expected to be more heterogeneous compared to cAC10-vcMMAE. Analysis of T-DM1 by SEC-MALS revealed two species. The main species is a monomer with average DAR ~3.1 (Figure 4 and Table 2). Under native SEC conditions, T-DM1 contains a small amount of dimer (~1% w/w) and no high molecular weight species (Table 2). Unlike cAC10-vcMMAE, the T-DM1 dimer exhibits a drug-antibody ratio similar to the monomer at ~2.9 (Table 2).
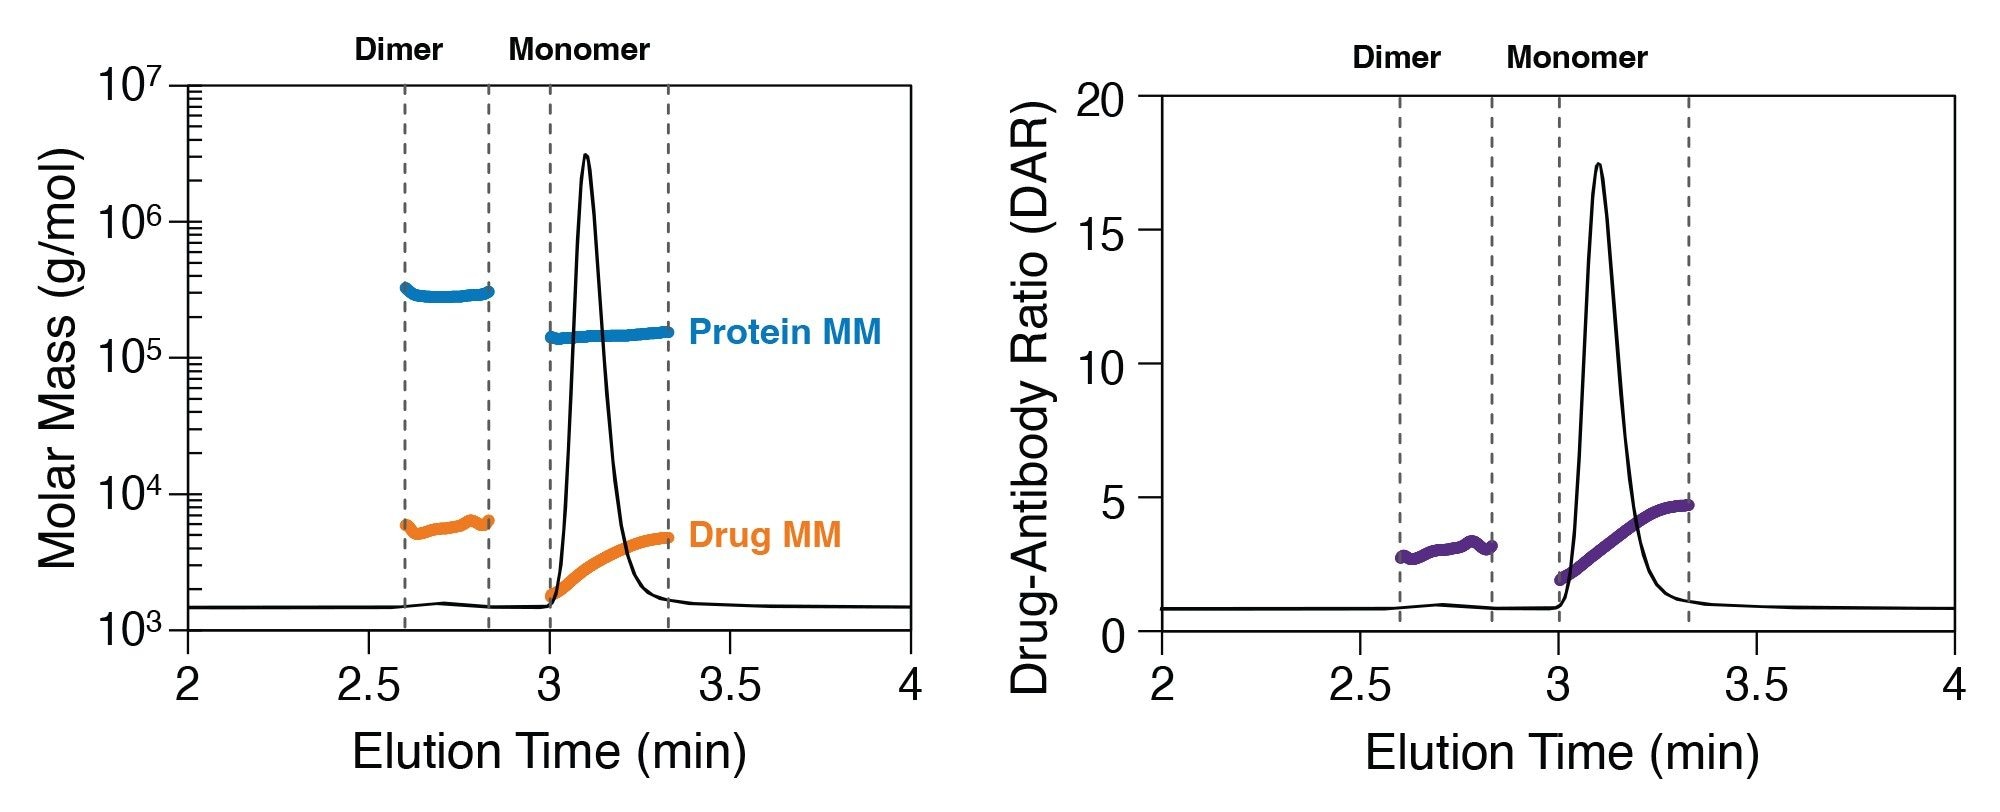
Inspection of the molar mass distribution of each ADC reveals interesting features. For both monomers, the protein molar mass is quite constant, as expected, confirming that each molecule in the monomer peak consists of a single mAb. However, the drug molar mass exhibits some heterogeneity across the peak. This partial separation of different DAR species by the SEC column, likely mediated by hydrophobic interactions. This is especially evident for T-DM1 (Figure 4), where the measured drug molar mass increases monotonically across the peak. The measured DAR at the leading edge of the monomer peak is approximately 1 increasing to approximately 5 for the latest-eluting monomer species.
HIC-MALS: A Closer Look at DAR Heterogeneity
Hydrophobic interaction chromatography can be used to separate cysteine-conjugated ADCs based on DAR, and since HIC is typically not performed under denaturing conditions, it allows the analysis of intact cysteine-conjugated ADCs. By coupling HIC with MALS and UV detection, the detailed composition of DAR variant species or free mAbs were investigated. These data can be used to confirm the identity of the various species that are detected and identified by LC-MS or other methods.
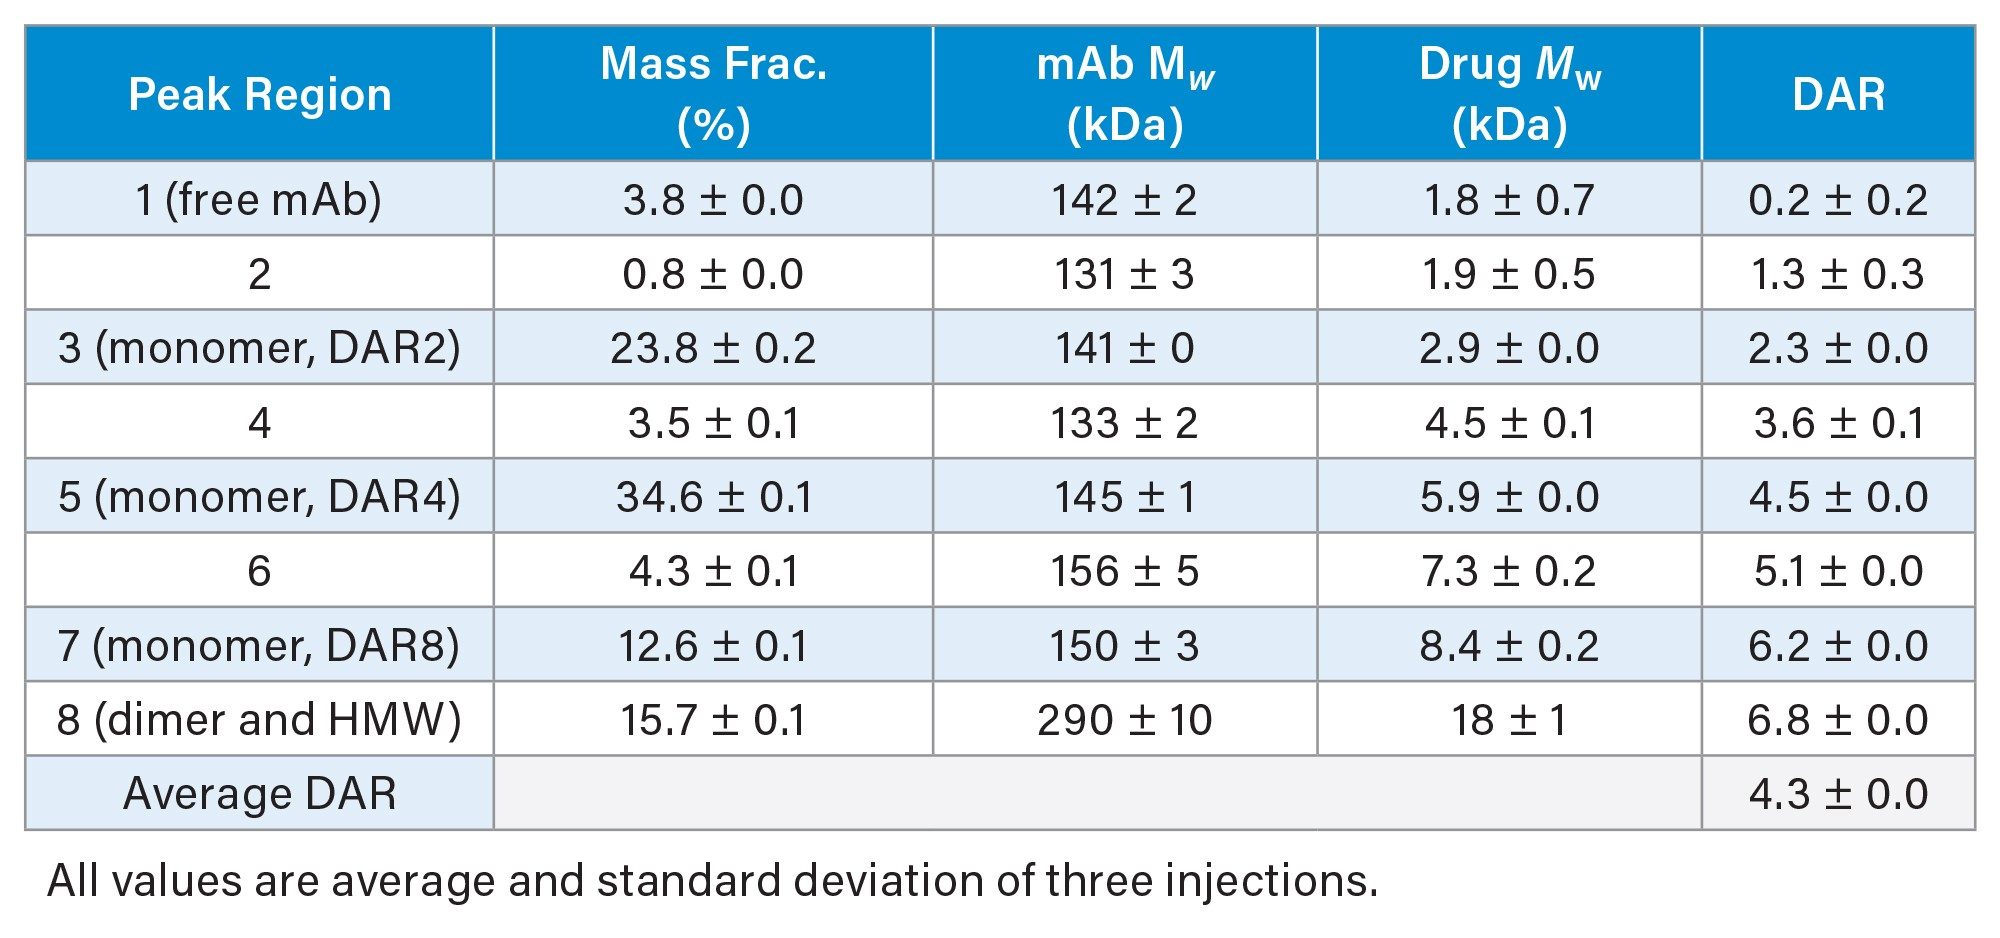
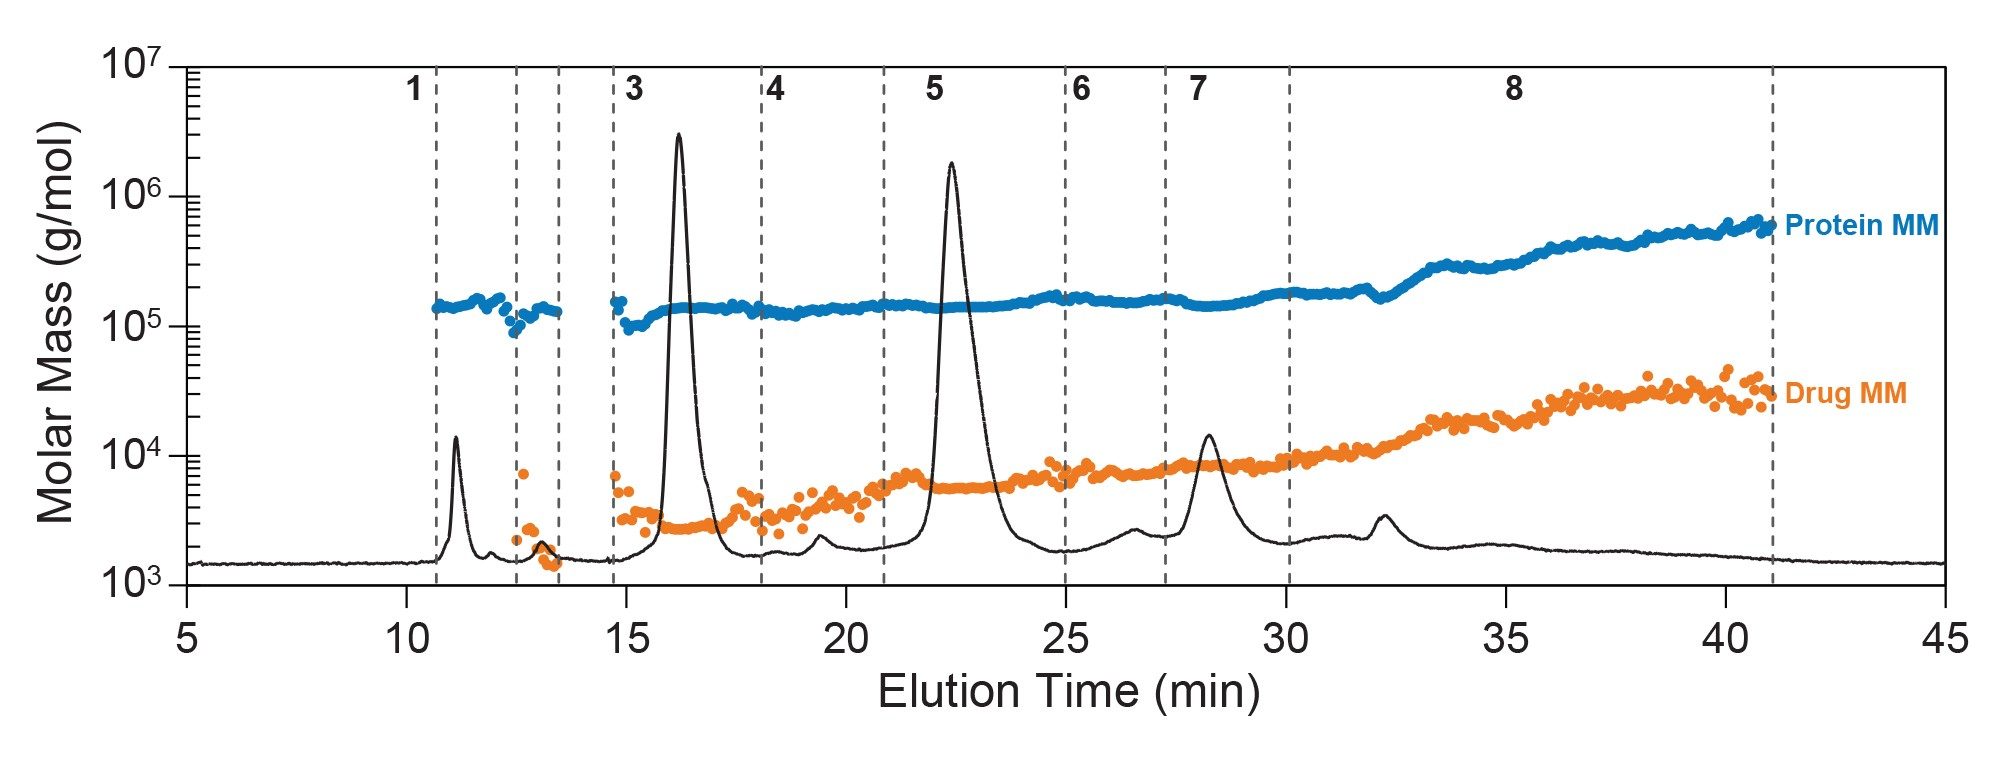
The average DAR measured by HIC-MALS (4.3, Table 3) was in excellent agreement with the overall DAR measured by SEC-MALS (4.0, Table 2). However, HIC separation revealed the presence of at least five main species along with multiple minor species (Figure 5). The most abundant form was the DAR4 monomer (peak region #5), making up over one-third of the total mass. The next most abundant species were the DAR2 monomer (peak region #3) and DAR8 monomer (peak region #7), consistent with an average DAR around 4 for cAC10-vcMMAE. This heterogeneity was somewhat apparent in the SEC-MALS data; and separation by HIC enabled more in-depth quantitation of the relative abundance of each of these three main species.
Additional minor species were present in the HIC chromatogram, but their quantification by UV-MALS was not as straightforward as for SEC separation for multiple reasons. In addition, dimer and HMW species were not well-resolved by this HIC method and co-elute in a wide smear (region #8). Interestingly, there appeared to be a small fraction of unconjugated brentuximab monomer (<5%, peak region #1), which was not apparent in the SEC-MALS chromatogram. Despite accounting for systematic drifts in UV and MALS baseline signals, an increase in error and uncertainty is expected during gradient elution, especially for these minor species. In particular, the signal:noise (S/N) ratios peak regions #2, 4, and 6 were about one-tenth of those for peaks 3 and 5. This low signal combined with significant co-elution and lack of baseline resolution led to increased uncertainty in the component molar masses and species identity.
RPC-MALS: Potential Integration with Mass Spectrometry
Typically, the DAR distribution of lysine-conjugated ADCs is more heterogeneous and hydrophobic, making it less suitable for HIC. For T-DM1, RPC-MALS was performed to investigate the DAR distribution better.
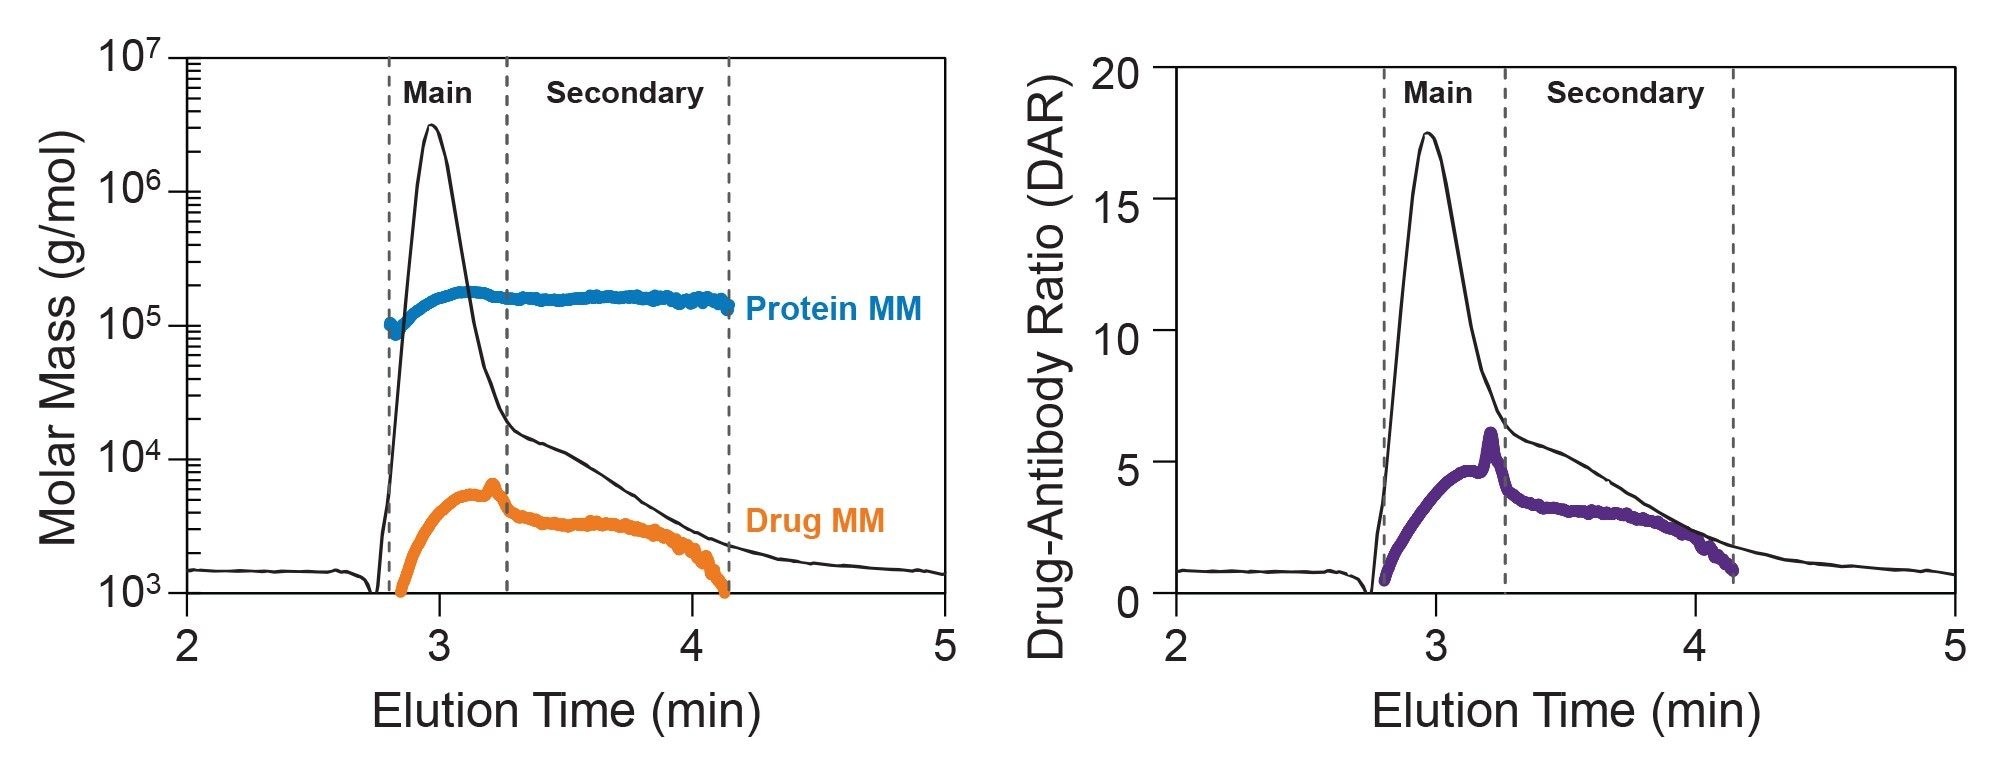
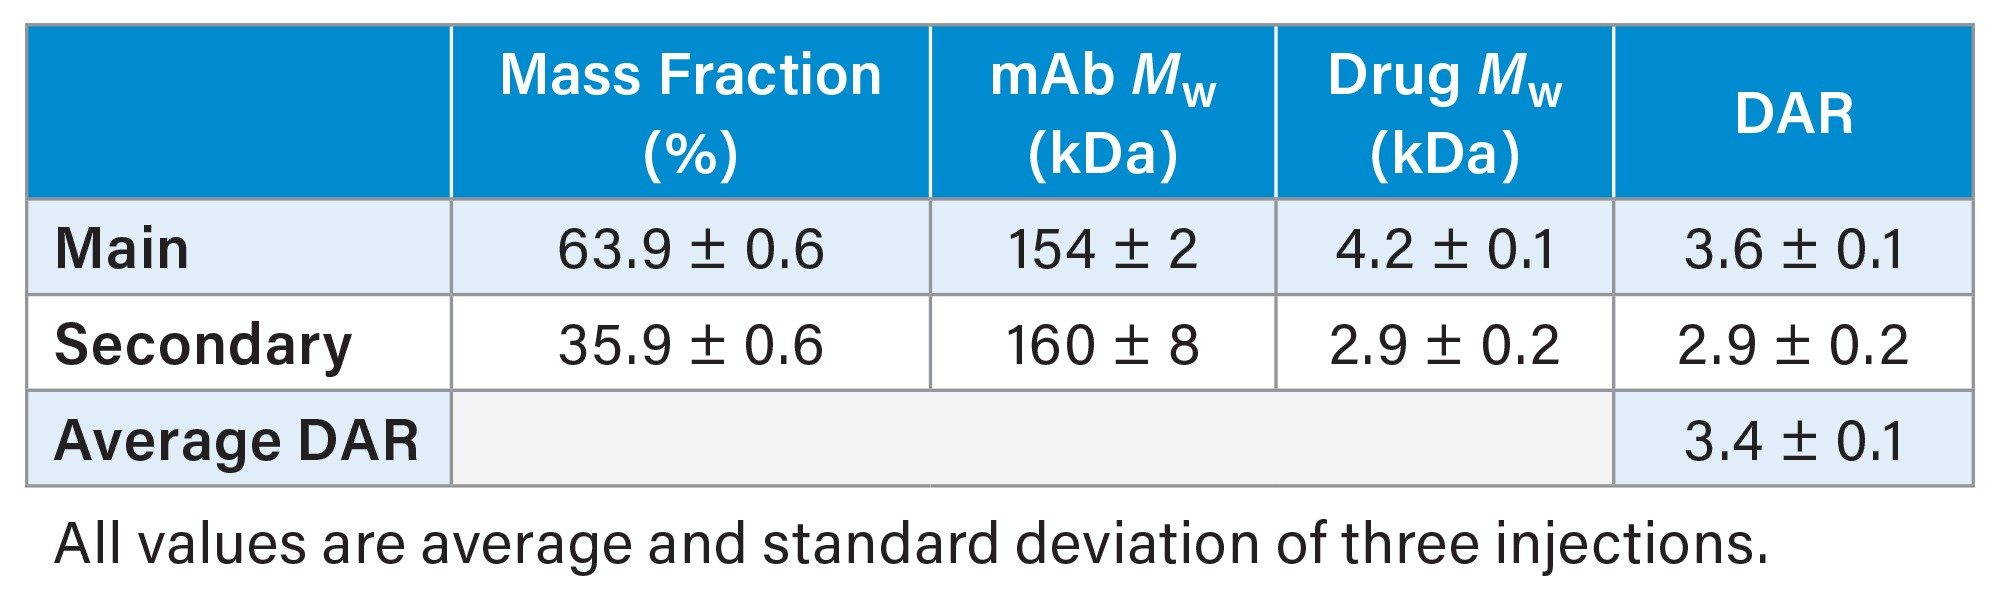
By RPC-MALS, T-DM1 exhibited a continuous DAR distribution, with average DAR ranging from 1 to 6 across the peak (Figure 6). This is expected for a lysine-conjugated ADC. The measured protein molar mass across the entire chromatogram is consistent with a monomer, complementing the distribution data measured by SEC-MALS. In addition, the overall average DAR of 3.4 (Table 4) is in good agreement with the overall average DAR measured by SEC-MALS of 3.2 (Table 2).
Under these conditions, T-DM1 appears to elute as two different populations that are not well-resolved. The main species contains a distribution of DAR while the secondary peak exhibits a relatively constant DAR ~3 (Figure 6, right). The secondary peak was hypothesized to be made up mainly of positional isomers, which would have the same molar masses, with different hydrophobicity. Future LC-MS studies could potentially provide additional insight into the positional isomers and distribution of drug payload. Since MALS is a non-destructive method, LC-MALS may enable integration with other techniques, like LC-MS, for extended in-depth characterization.
Conclusion
The combination of MALS, UV at multiple wavelengths, and dRI detection greatly expands the capability of traditional liquid chromatography-based analyses. Quality attributes such as ADC aggregation, fragmentation, DAR, and stoichiometry variations can be acquired across a broad range of mobile phase environments. SEC-MALS provides an easy-to-implement platform method for routine analysis of ADC quality attributes under native conditions. Importantly, it enables the measurement of free mAb and ADC extinction coefficients, which are critical for determining concentration at multiple stages of production, pre-clinical and clinical trials. Orthogonal measurements, including HIC-MALS and RPC-MALS, could provide additional information about the distribution of payload variants when appropriate as a complement to more in-depth characterization by LC-MS.
References
- Drug Approval Package: Kadcyla (ado-trastuzumab emtansine) Injection. https://www.accessdata.fda.gov/drugsatfda_docs/nda/2013/125427Orig1s000TOC.html.
- Chen, B. et al. Antibody–drug Conjugates in Cancer Therapy: Current Landscape, Challenges, and Future Directions. Mol Cancer 24, 279 (2025).
- Johann, F.; Wöll, S.; Winzer, M.; Gieseler, H. Agitation-Induced Aggregation of Lysine- And Interchain Cysteine-Linked Antibody-Drug Conjugates. J. Pharm. Sci. 113, 1265–1274 (2024).
- Mills, B. J.; Kruger, T.; Bruncko, M.; Zhang, X. Jameel, F. Effect of Linker-Drug Properties and Conjugation Site on the Physical Stability of ADCs. J. Pharm. Sci. 109, 1662–1672 (2020).
- Jiang, Q.; et al. Structural Characterization of the Aggregates of Gemtuzumab Ozogamicin. ACS Omega 4, 6468–6475 (2019).
- Liu, K.; et al. A Review of the Clinical Efficacy of FDA-Approved Antibody‒Drug Conjugates in Human Cancers. Mol. Cancer 23, 62 (2024).
- Brentuximab Vedotin CD Markers Inhibitor | Read Reviews and Product Use Citations. https://www.selleckchem.com/products/brentuximab-vedotin.html.
- van de Donk, N. W. C. J.; Dhimolea, E. Brentuximab vedotin. mAbs 4, 458–465 (2012).
- Chen, L.; et al. In-depth Structural Characterization of Kadcyla® (ado-trastuzumab emtansine) and its Biosimilar Candidate. mAbs 8, 1210–1223 (2016).
720009656, November 2026


