

For research use only. Not for use in diagnostic procedures.
- Main
-
For research use only. Not for use in diagnostic procedures.
Catalin Doneanua, Alexandre F. Gomesa, Jo-Anne Rileyb, Ying Qing Yua
a Waters Corporation, United States
b Waters Corporation, United Kingdom
Published on July 31, 2026
For research use only. Not for use in diagnostic procedures.
An optimized LC-MS and informatics workflow was developed to analyze two critical mRNA quality attributes: Capping Efficiency and Average Poly(A) Tail Length and Heterogeneity. The workflow, enabled by the Xevo™ MRT Mass Spectrometer and three waters_connect™ Apps - SYNTHETIC Library, INTACT Mass and MAP Sequence, allowed rapid and accurate identification and relative quantification of 5’-Cap structures and Poly(A) Tail variants from mRNA digests.
oligonucleotides / oligo sequencing / RNA / mRNA / RNA digestion enzymes / Xevo MRT MS / waters_connect / INTACT Mass / SYNTHETIC Library / MAP Sequence
The recent development and regulatory approval of several COVID mRNA-based vaccines, and emerging opportunities for mRNA-based therapeutics, have brought the mRNA molecules to the forefront of the biopharma industry1-3. The resulting need for rapid product development has necessitated development of analytics for the precise characterization of several mRNA critical quality attributes (CQAs), including 5’-Capping Efficiency, Average 3’-Poly(A) Tail Length and Heterogeneity and Sequence Integrity.
Several iterative workflows have previously been developed at Waters Corporation for the direct assessment of the Capping Efficiency and Average Poly(A) Tail Length CQAs, starting with the BioAccord and Xevo G3 Q-Tof mass spectrometry systems in combination with the INTACT Mass waters_connect App, and progressively refined to improve performance and expand capabilities. However, these earlier workflows require two separate LC-MS analysis methods for each of the CQAs4-6.
A single LC-MS assay simultaneously quantified two pivotal CQAs – 5’-Capping Efficiency and Average Poly(A) Tail Length/Heterogeneity of Fluc mRNA – accelerating method development, reducing runtime and lowering costs. This assay improved the mass accuracy for both CQAs, taking advantage of the exquisite sensitivity, mass resolution and mass accuracy of the Xevo MRT mass spectrometer.
Normal-dipropylamine (DPA, 99.0% purity, catalog number D214752-500ML) was purchased from Millipore Sigma (St Louis, MO) and 1,1,1,3,3,3-hexafluoro-2-propanol (IonHance HFIP, P/N 186010781) was obtained from Waters (Milford, MA). Methanol (LC-MS grade, catalog number 34966-1L) and acetonitrile (LC-MS grade, catalog number 34967-6XL) were obtained from Honeywell (Charlotte, NC). 5M RNase-free ammonium acetate (catalog no AM9071-500ML) was purchased from Thermo Fisher (Waltham, MA). HPLC grade Type I deionized (DI) water was purified using a Milli-Q system (Millipore, Bedford, MA). Mobile phases were prepared fresh daily. Ultrapure nuclease-free water (catalog number J71786.AE) for mRNA digestions was purchased from Thermo Fisher Scientific (Waltham, MA).
An mRNA construct based on the firefly luciferase (Fluc) sequence was custom-made via IVT (in vitro transcription) synthesis by GenScript (GS, Piscataway, NJ). The GS Fluc mRNA molecule was synthesized with a Cap-1 structure, followed by 1813 nucleotides and a Poly(A) Tail sequence.
Fungus-derived animal free purified ribonuclease T1 (catalogue no IFGRNASET1AFLY500KU) was ordered from Innovative Research (Novi, MI) and the lyophilized enzyme was dissolved in 5 mL of 100 mM ammonium bicarbonate (catalogue no 5.33005-50G, Millipore Sigma) to prepare a solution containing 100 units/µL. For mRNA digestion with RNase T1, 20 µL of Fluc mRNA (1.4mg/mL) were mixed with 10 µL of nuclease-free water in an Eppendorf PCR vial and denatured for 2 minutes at 90ºC. 10 µL of RNase T1 enzyme (1,000 units) were added to the vial and the digestion was allowed to proceed at 37ºC for 15 minutes. The digestion mixture was transferred to a Quan Recovery MaxPeak 300 µL vial for LC-MS analysis. The digest was analyzed immediately by LC-MS using 5 µL injections.
The hRNAse4 enzyme (catalogue no M1284S, 2500 units) was purchased from New England Biolabs (Ipswich, MA). 20 µL of Fluc mRNA were denatured following the same procedure described for RNase T1 digestion, then 10 µL (500 units) of hRNase4 were added and the mRNA sample was digested for 90 minutes at 37ºC.
All UPLC-MSE datasets (data independent analysis - DIA) were acquired with waters_connect (v4.1.0.17) and subsequently processed using the waters_connect SYNTHETIC Library App (v 2.0) INTACT Mass App (v 1.9) and the MAP Sequence App (v2.0).
|
System: |
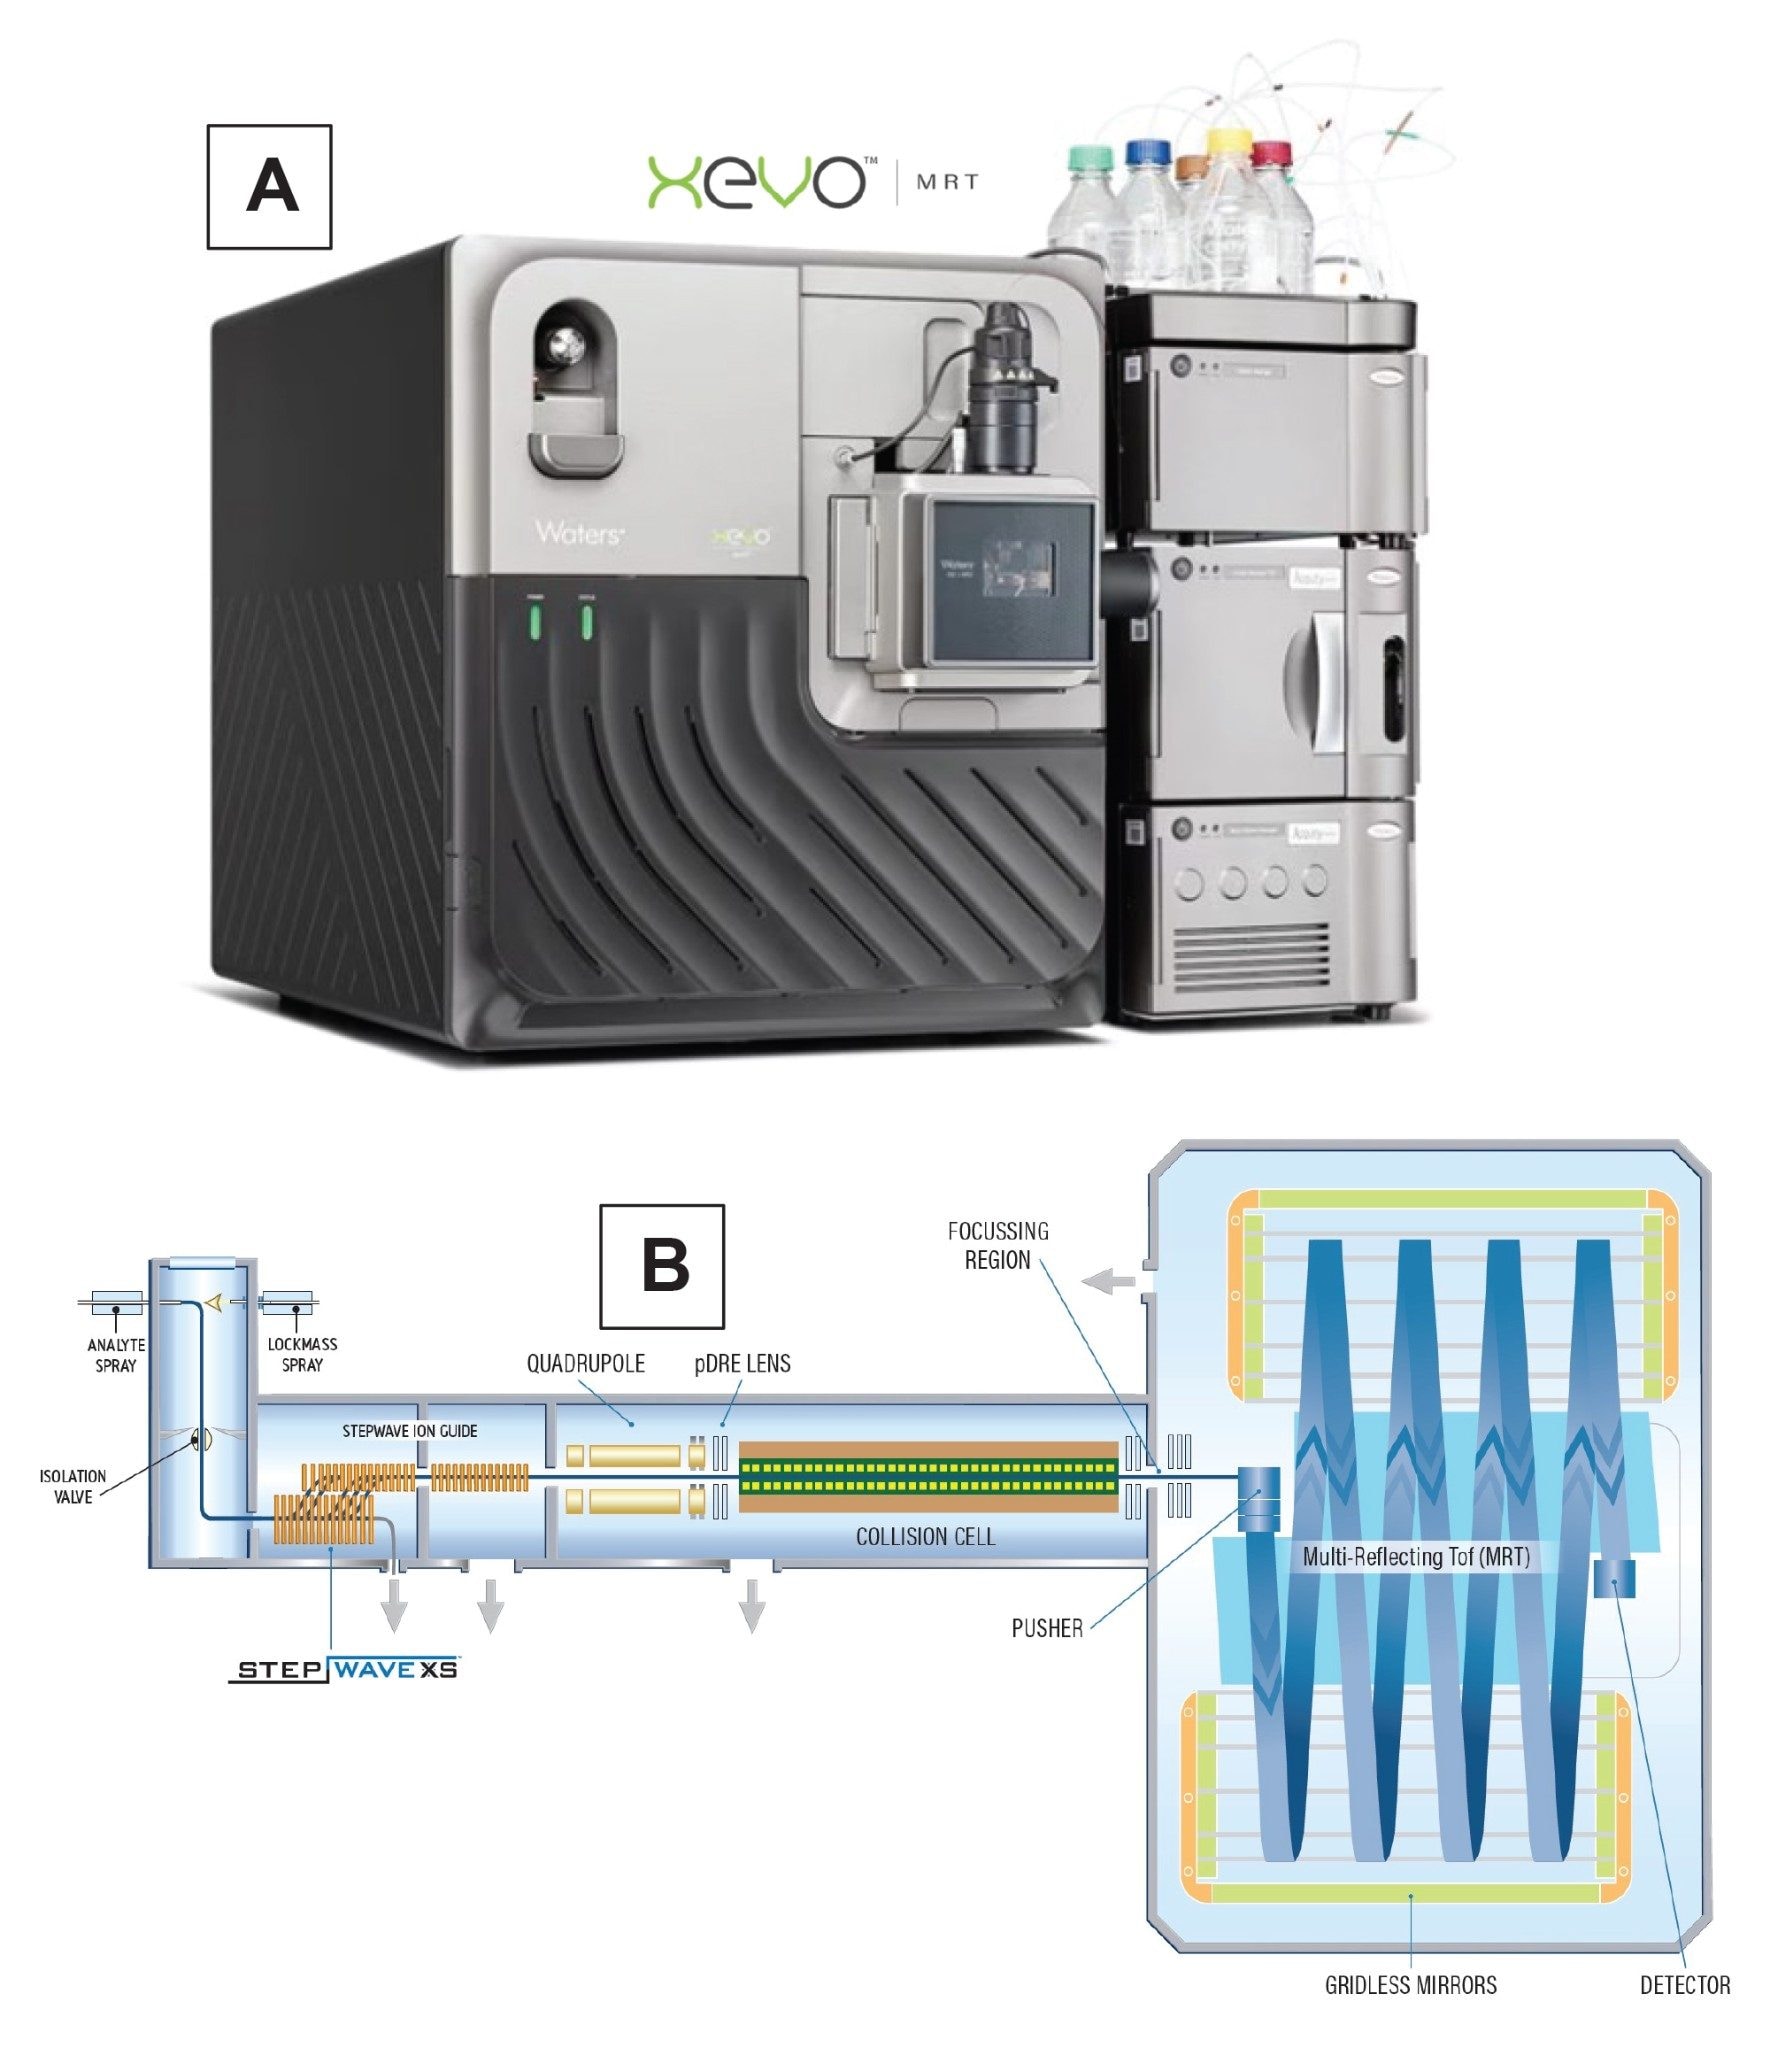
Xevo MRT (multi-reflecting time-of-flight) Mass Spectrometer coupled with ACQUITY Premier UPLC (Binary) System |
|
Column: |
ACQUITY Premier Oligonucleotide BEH™ C18 Column 130 Å, 1.7 µm, 2.1 x 150 mm (p/n: 186009486) |
|
Column temperature: |
60 °C |
|
Flow rate: |
300 µL/min |
|
Mobile phases: |
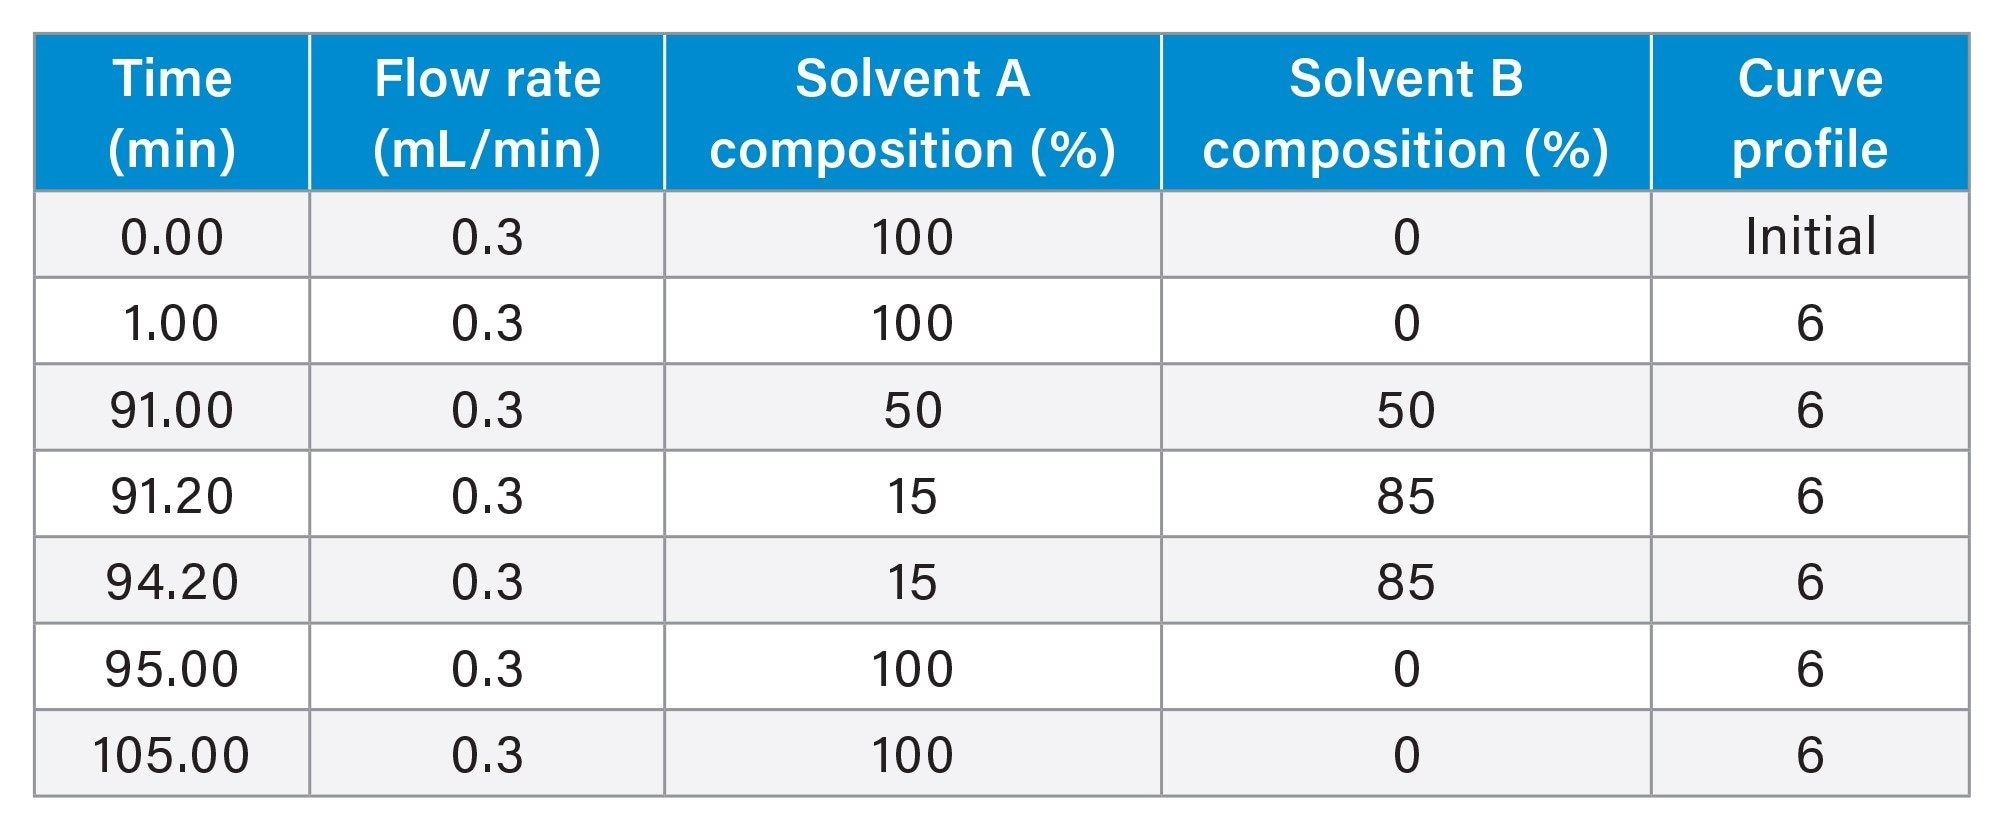
Solvent A: 10 mM DPA (n-dipropylamine), 40 mM HFIP (1,1,1,3,3,3-hexafluoroisopropanol) in DI water, pH 8.6 Solvent B: 10 DPA, 40 mM HFIP in 50% methanol |
|
Sample temperature: |
8 °C |
|
Sample vials: |
QuanRecovery MaxPeak HPS Vials ( p/n: 186009186) |
|
Injection volume: |
5 µL |
|
Purge solvent: |
10% methanol in DI water |
|
Sample manager wash solvent: |
50% MeOH |
|
Seal wash: |
10% methanol in DI water |
|
MS system: |
Xevo MRT QTOF Mass Spectrometer |
|
Ionization mode: |
ESI(-) |
|
Acquisition mode: |
MSE |
|
Acquisition rate: |
2 Hz |
|
Capillary voltage: |
1.5 kV |
|
Cone voltage: |
40 V |
|
Source offset: |
10 V |
|
Source temperature: |
120 ºC |
|
Desolvation temperature: |
550 ºC |
|
Cone gas flow: |
0 L/h |
|
Desolvation gas flow: |
1000 L/hr |
|
TOF mass range: |
50 – 4000 (MSE acquisition) |
|
Low energy CE: |
6 V |
|
High energy CE ramp: |
15 – 35 V |
|
Lock-mass: |
50 pg/µL Leu Enk in 0.1% formic acid, 50% CAN |
|
Data acquisition: |
waters_connect |
|
Data processing: |
INTACT Mass App Synthetic Library App MAP Sequence App |
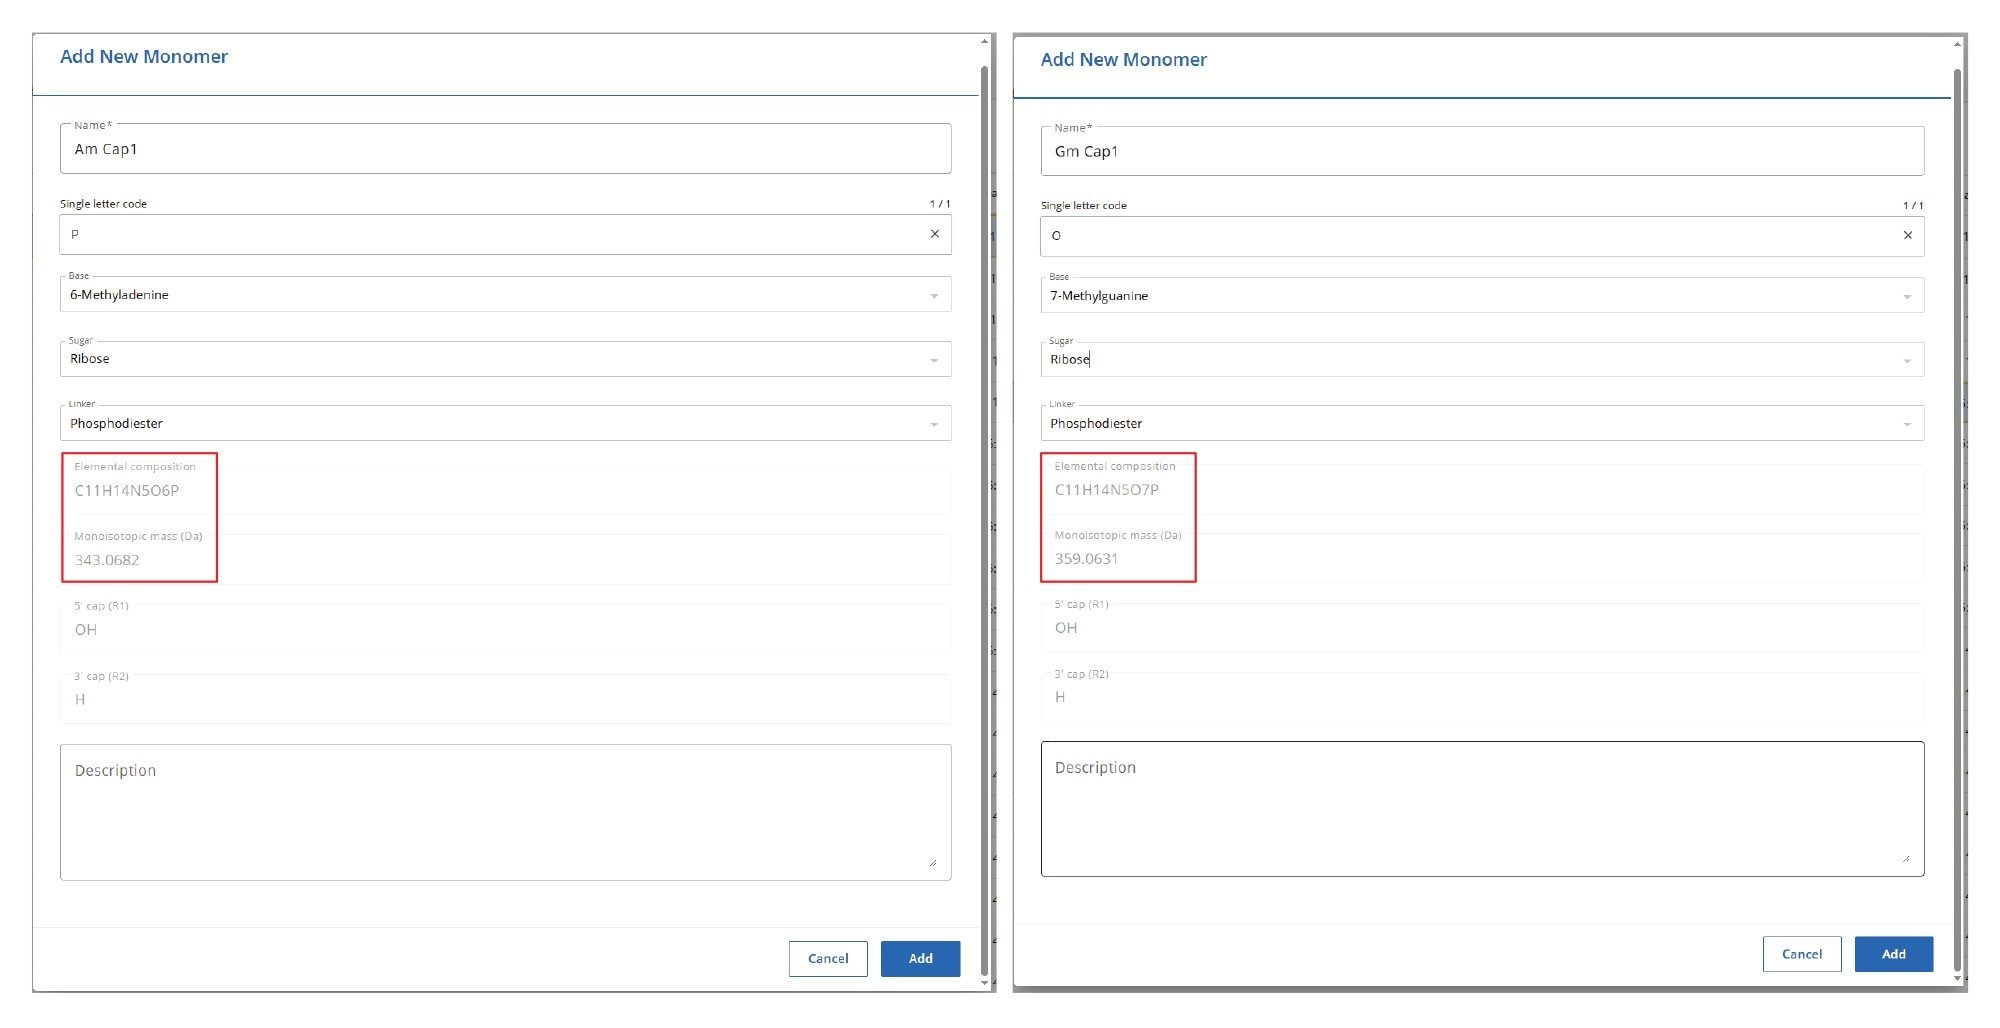
Several examples of mRNA Capping Efficiency assays have previously been reported in application notes published by Waters4–6. The mRNA cap is added to the 5′ end of an mRNA molecule and typically consists of a fully matured 7N-methyl guanosine linked to the mRNA through a 5′–5′ triphosphate ester bond (m7Gppp). The SYNTHETIC Library App was first utilized to predict the 5′-end uncapped digestion product generated from hRNase4 digestion of Fluc mRNA, corresponding to a 7-mer nucleotide with the sequence GGG AAA U cP. For the GenScript (GS) Fluc mRNA, the intended Cap-1 structure incorporated at the 5′ end includes a 2′-O-methylated adenosine residue attached to the mRNA, resulting in the expected Cap-1 structure denoted as m7GpppAm. Interestingly, analysis using the MAP Sequence App (sequencing software), also identified a second Cap-1 structure with the sequence m7GpppGm from the hRNase4 digested mRNA sample. These two Cap-1 structures were defined as individual nucleotides in the MAP Sequence App, added to the default Cap structure (m7Gppp). Additionally, the second nucleotide in each Cap-1 sequence (Am or Gm) was custom-defined in the SYNTHETIC Library App, as shown by the two library entries presented in Figure 2.
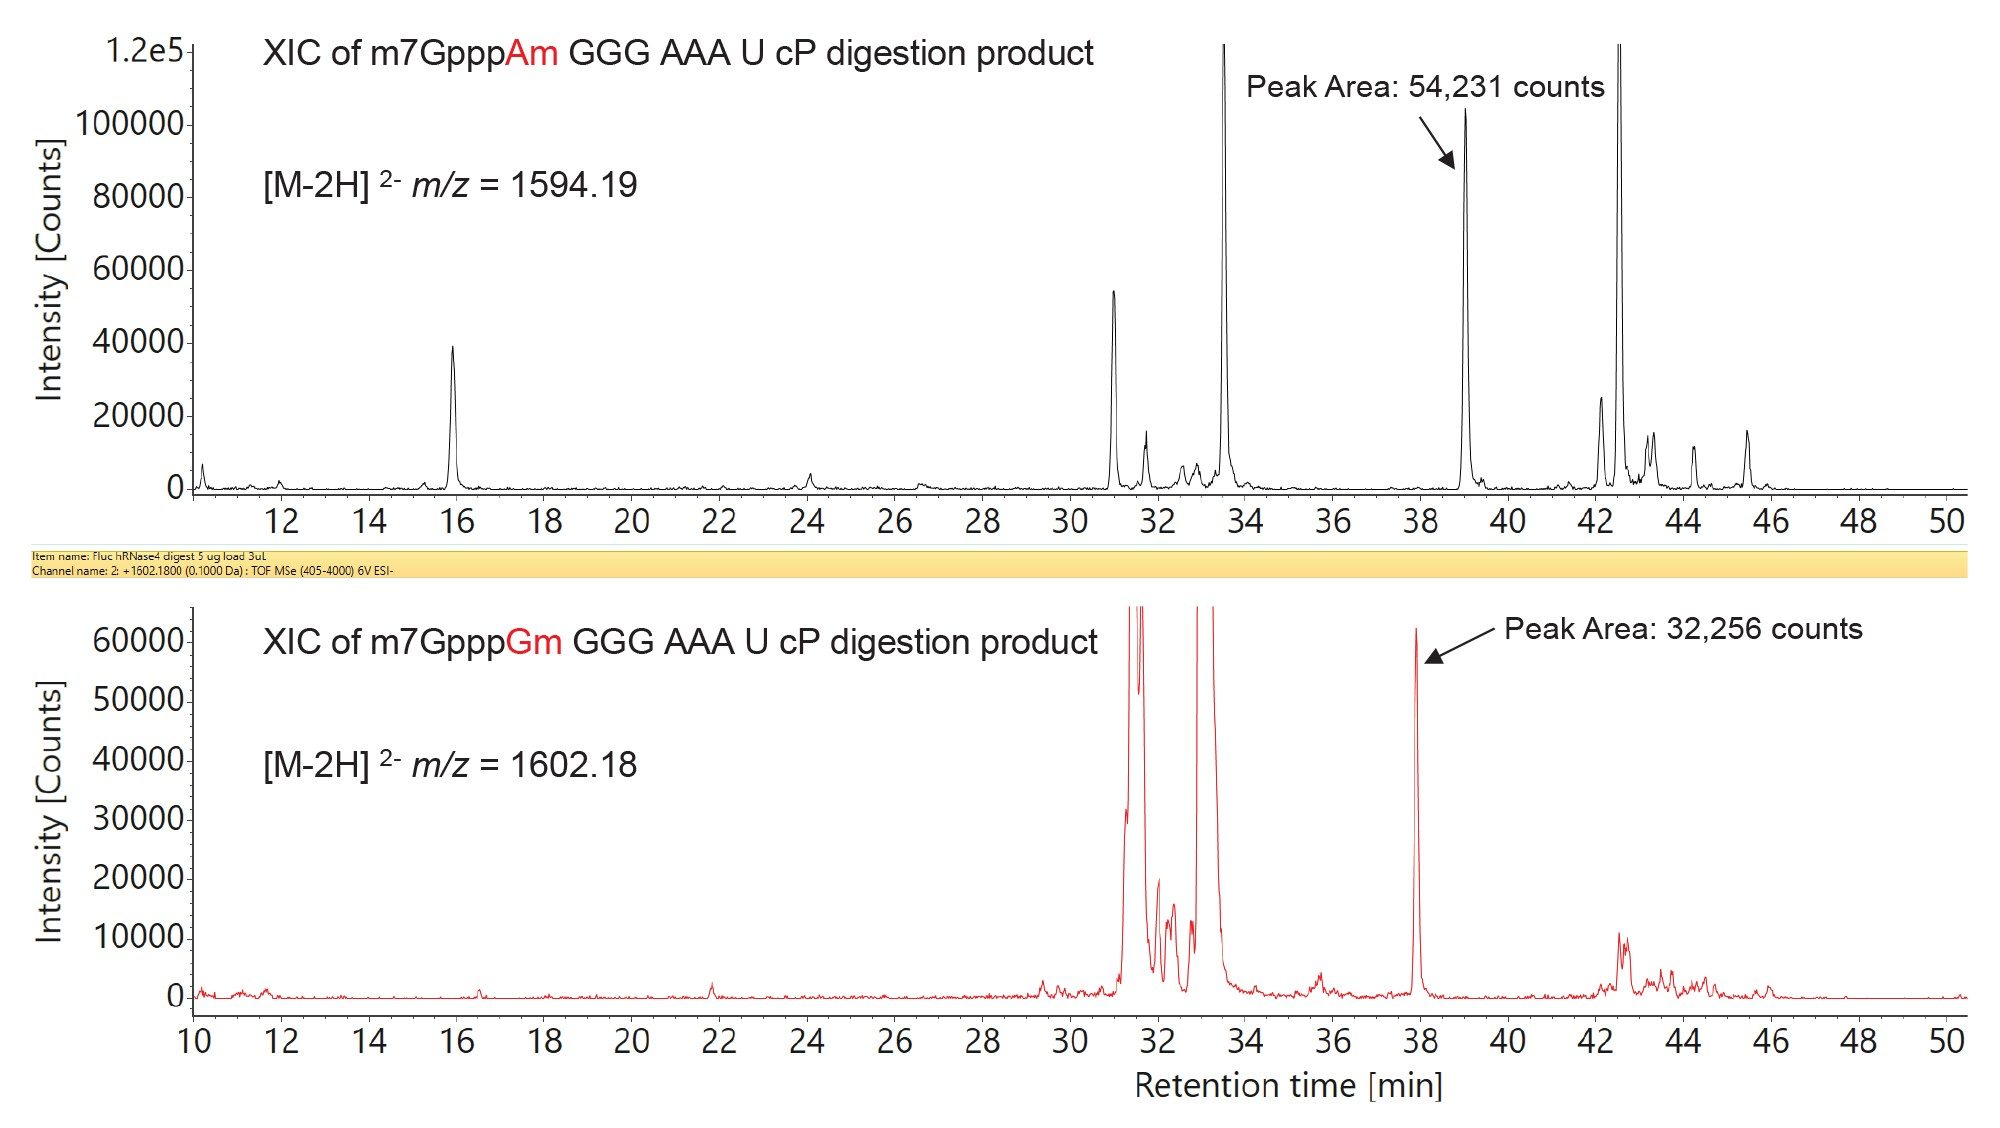
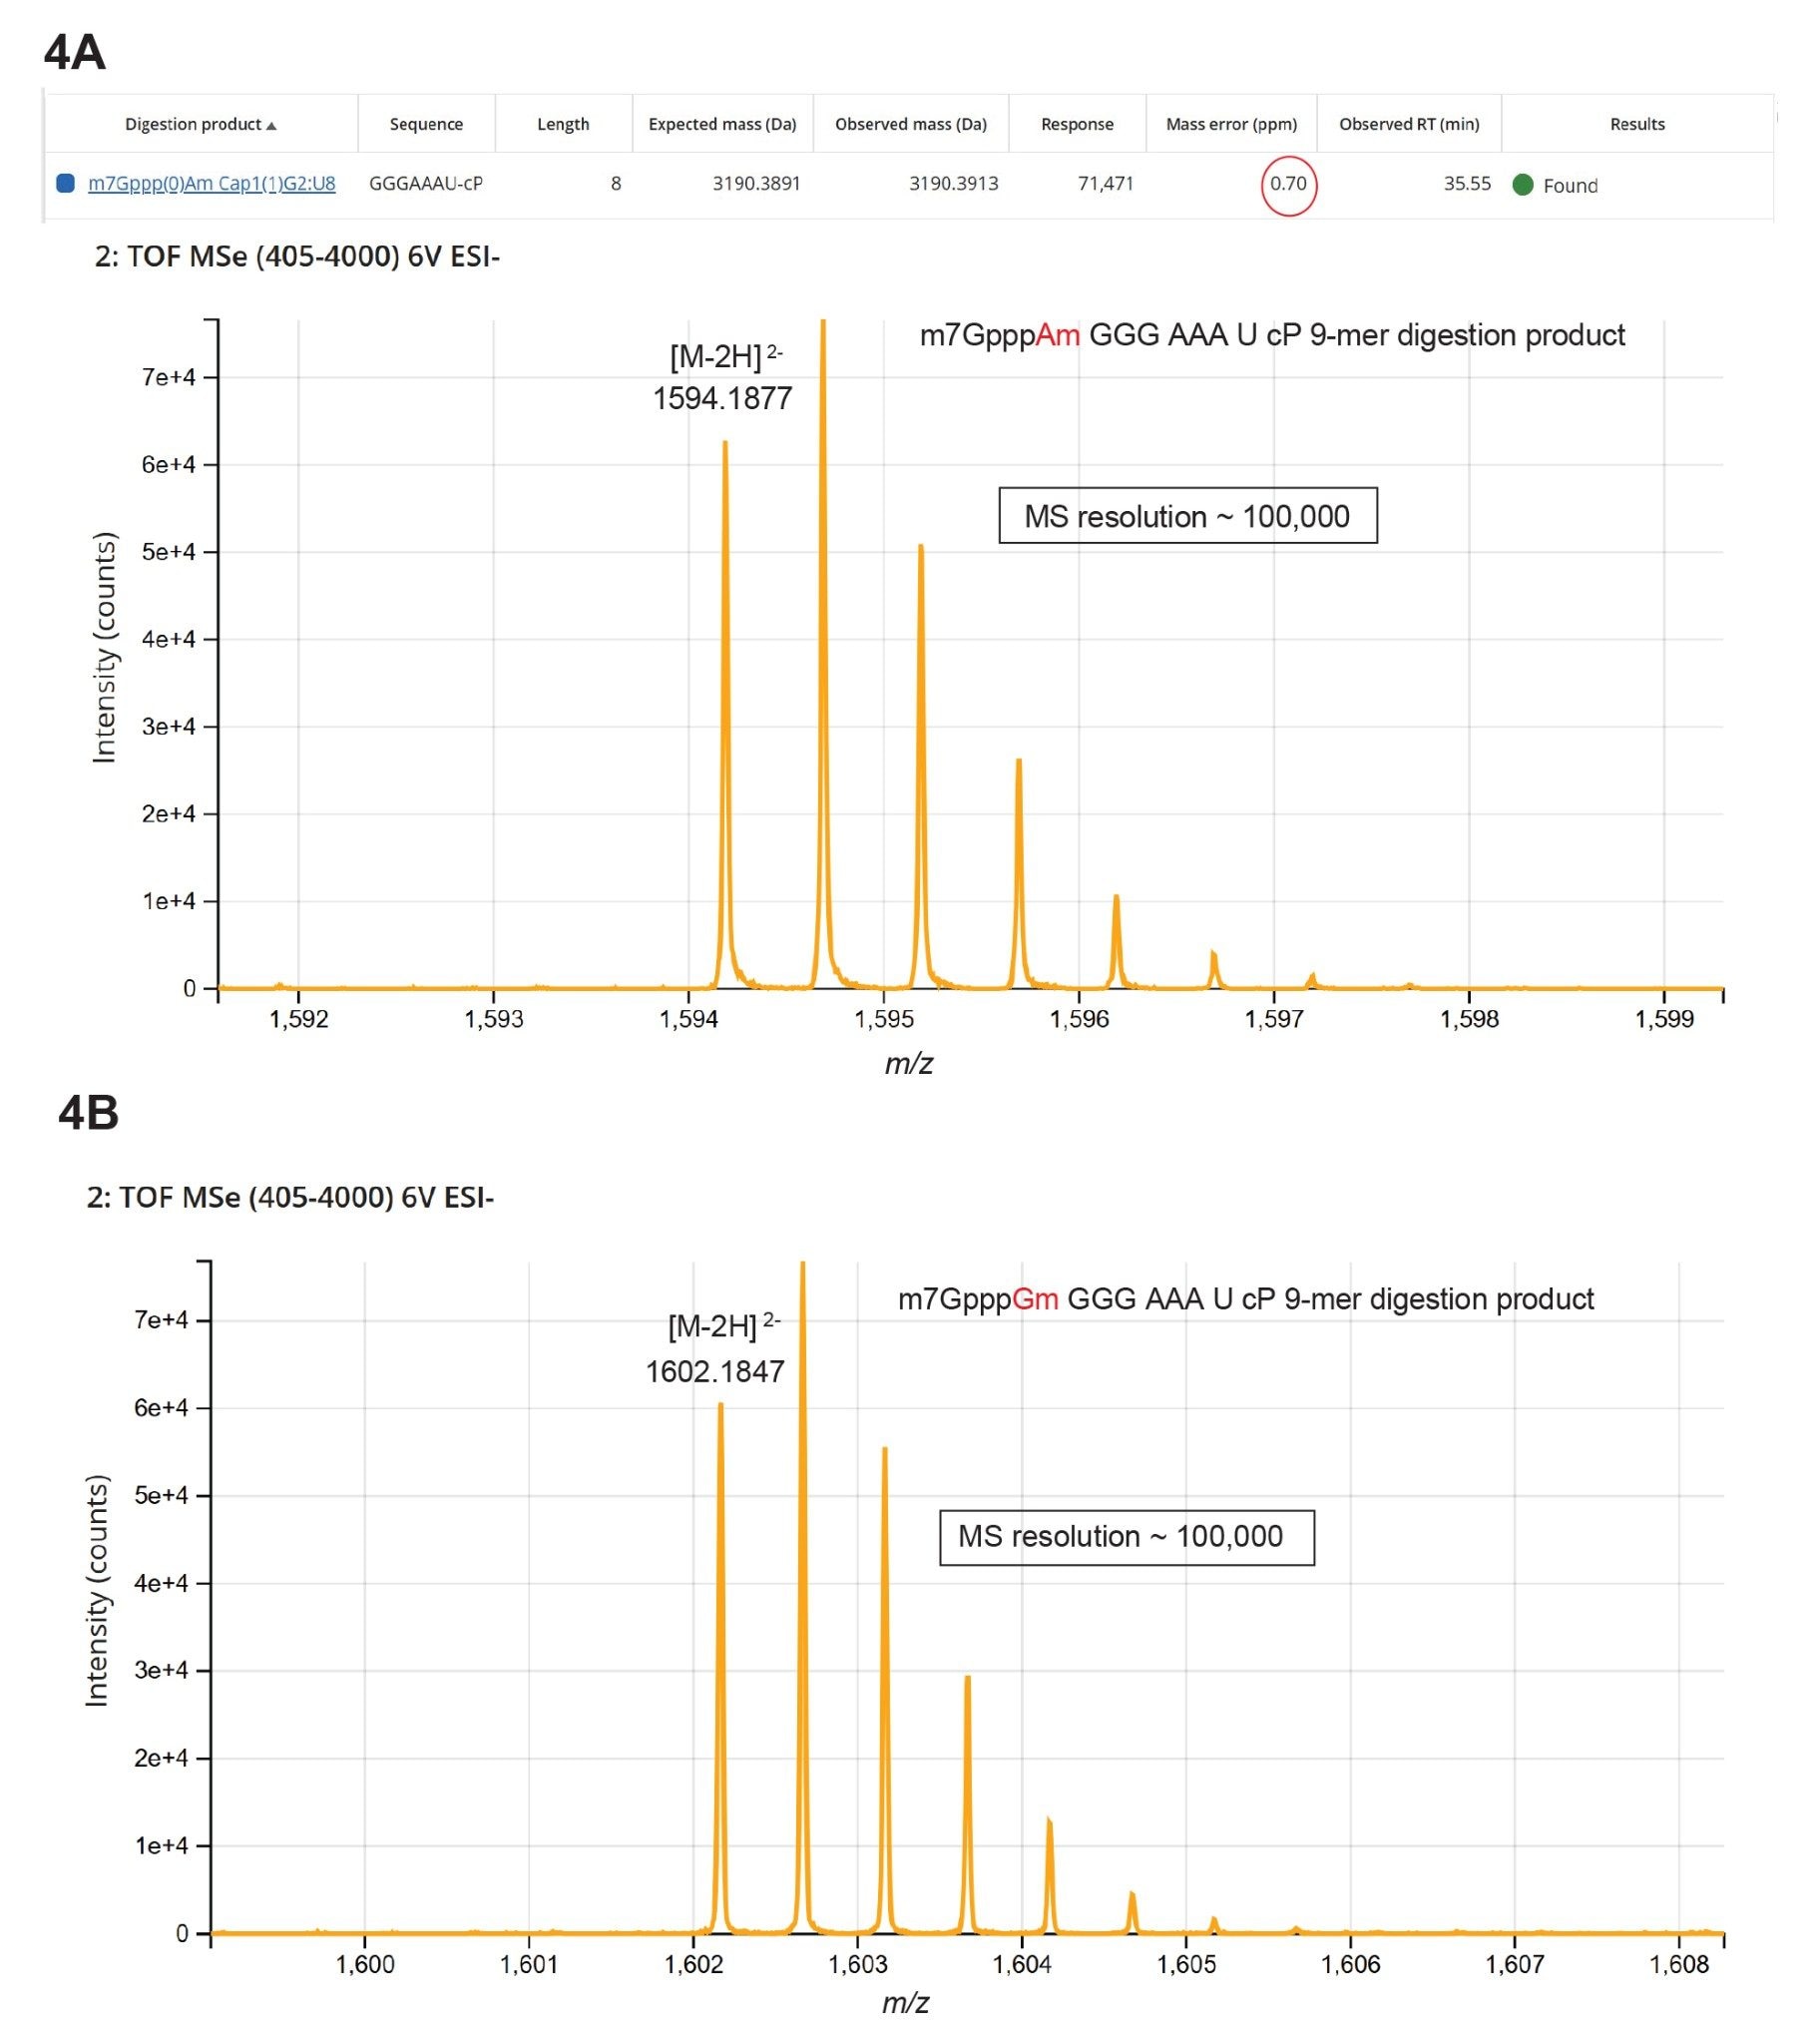
Both 5′-capped Fluc mRNA digestion products were identified in the hRNase4 digest, as demonstrated by the extracted ion chromatograms (XICs) presented in Figure 3. These Cap-1-modified 9-mer digestion products, corresponding to the sequences m7GpppAm GGG AAA U cP and m7GpppGm GGG AAA U cP, were successfully separated chromatographically. Their identities were further confirmed by the isotopic distributions shown in the two spectra from Figure 4, recorded for the most abundant detected charge state, [M-2H] ²⁻. High mass resolution (~100,000) achieved on the Xevo MRT mass spectrometer enabled measurement of the corresponding monoisotopic peaks with high mass accuracy, as illustrated by the MAP Sequence App screenshot displayed in figure 4A. The uncapped 7-mer digestion product, GGG AAA U cP (m/z = 1163.13, −2), was not detected in the hRNase4 digest. Furthermore, data analysis using the MAP Sequence App7 did not reveal any Cap-related impurities, including truncations of Cap-0, Cap-1, or Cap-2 structures, indicating a capping efficiency of 100% for GS Fluc mRNA. This outcome is consistent with the post-IVT dephosphorylation treatment applied to the GS Fluc mRNA, which enzymatically degrades uncapped mRNA transcripts into single nucleotides.
For Fluc mRNA, RNase T1 is unsuitable for evaluating capping efficiency because the 5′-end sequence contains three guanosine residues, which serve as cleavage sites for this enzyme. As a result, RNase T1 digestion produces very short oligonucleotides for the 5’-end of Fluc mRNA. Under the IP-RP LC-MS assay conditions employed, sufficient chromatographic retention cannot be achieved for such short species (mono-, di-, or trinucleotides), preventing detection of the uncapped RNase T1 digestion products.
Quantitative analysis based on the integrated peak areas of the two Cap-1 variants (see the peak areas reported in Figure 3), indicated that 62.7% of the Fluc mRNA population contains the intended m7GpppAm Cap-1 structure, whereas 37.3% carries an alternative m7GpppGm Cap-1 structure. This observation was unexpected, since conventional 5′ mRNA cap structures generally contain either a 2’-O-methylated adenosine (Am) or a 2’-O-methylated guanosine (Gm) as the second Cap-1 nucleotide, but not a mixture of both within the same mRNA preparation. The utility of a single LC-MS assay developed here for measuring the mRNA Capping Efficiency was clearly illustrated in the case-study presented above.
Compared with the Capping Efficiency assays, LC-MS characterization of the various Poly(A) Tail variants presents significantly greater analytical challenges. Because the Poly(A) Tail consists of a substantially longer nucleotide sequence, ionization in negative ESI-MS is significantly less efficient than for the much shorter Cap-related oligonucleotides. Poly(A) Tail oligonucleotides also display great heterogeneity and lower post-digestion stability, making them highly susceptible to enzymatic degradation. Furthermore, the biological mechanisms governing Poly(A) Tail synthesis across different species are not yet fully understood, which complicates accurate prediction of all sequence variants that may arise during the IVT process.8-11
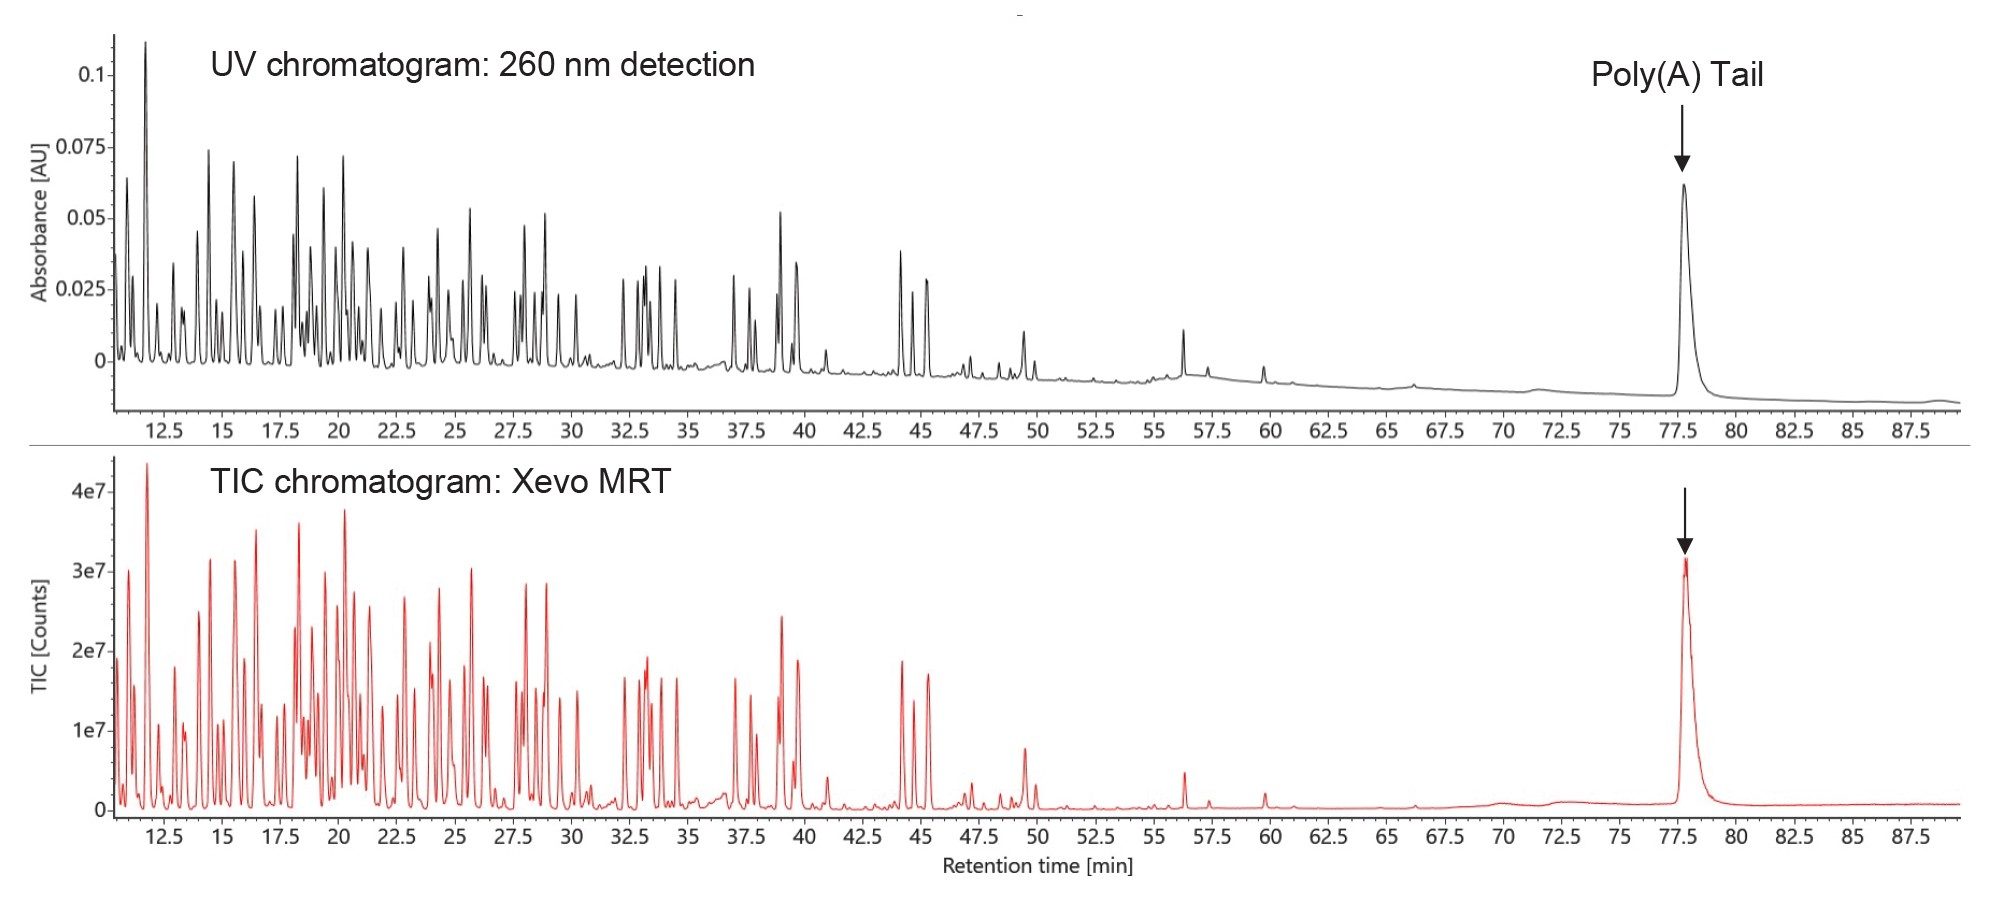
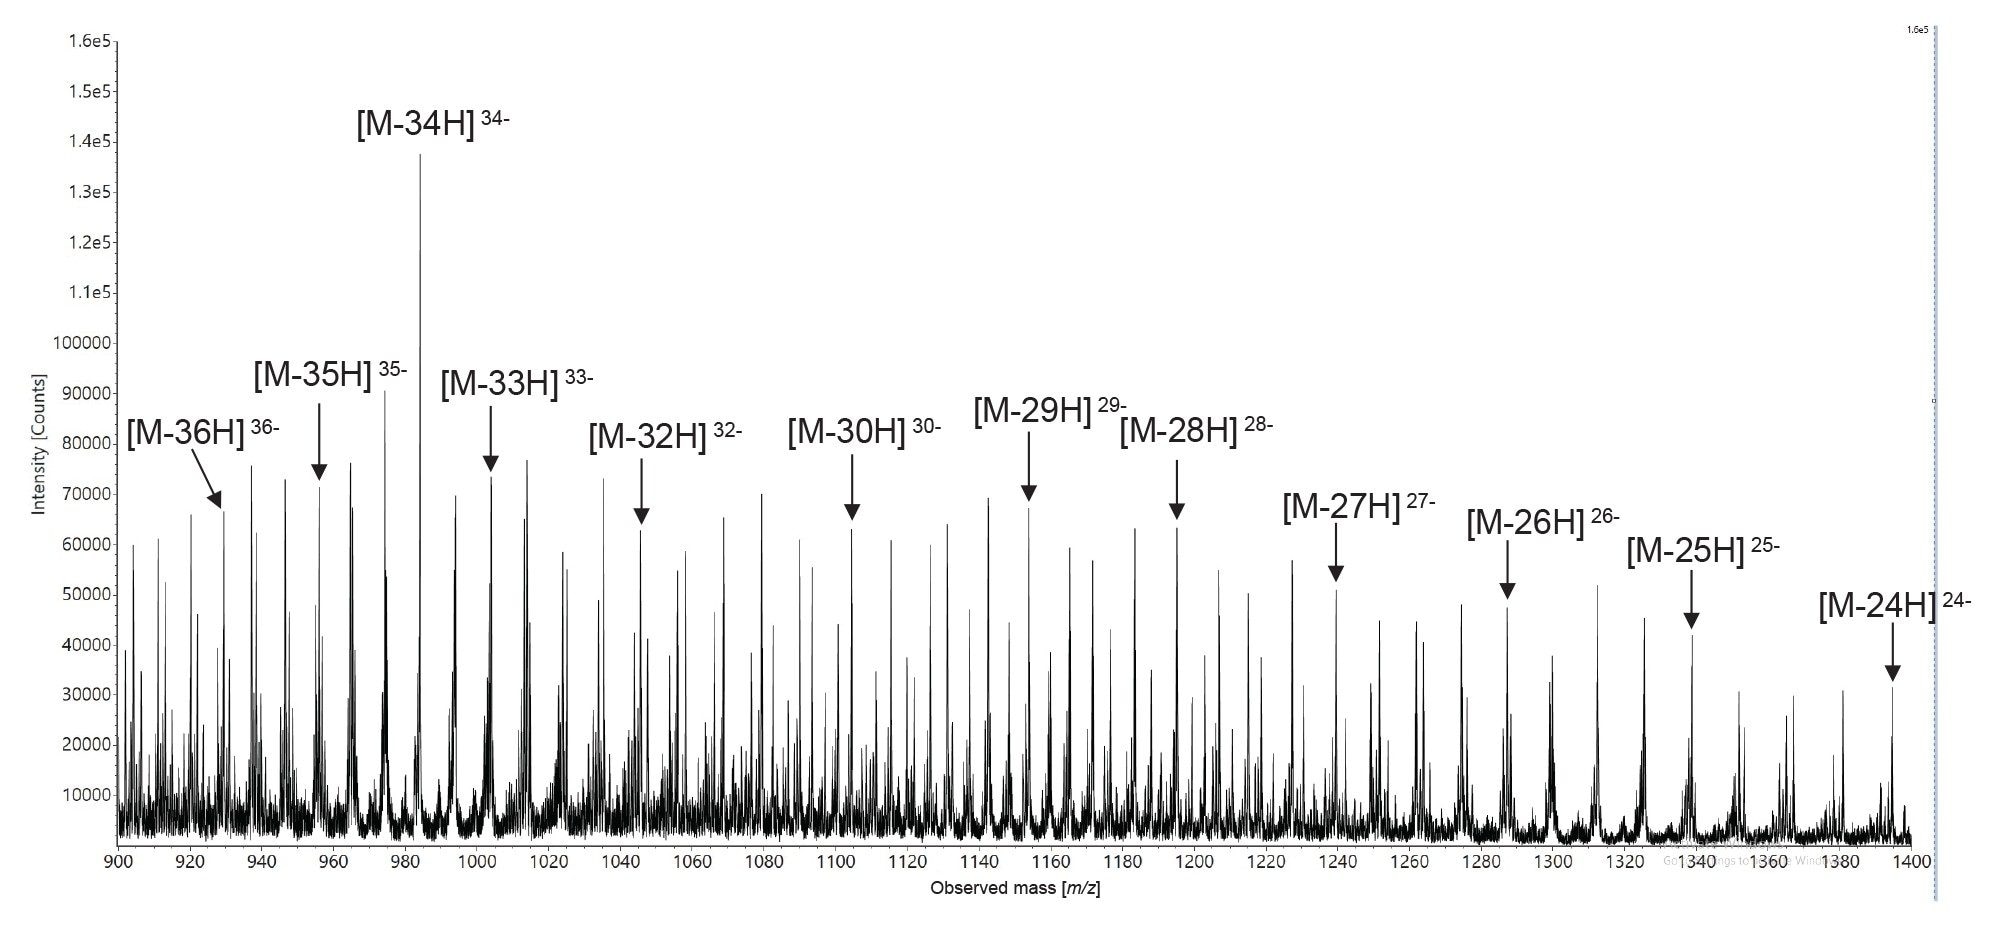
A previous report12 described an isolation approach for the Poly(A) Tail oligonucleotide from a complex mRNA RNase T1 digest using (dT)25 magnetic beads to enrich this fraction prior to LC-MS analysis. In our study, consistent with several other reports,13,14 direct IP-RP chromatographic separation of the complex RNase T1 digestion mixture (Figure 5) yielded a well-resolved and abundant Poly(A) Tail peak that eluted last in both the UV and TIC chromatograms. The data presented in this figure was recorded for a single LC-MS assay used for measuring the 5’-Capping Efficiency as well as the Poly(A) Tail measurements. Figure 6 presents the combined ESI-MS spectrum acquired for all co-eluting polyadenosine components of the Fluc mRNA Poly(A) Tail generated by RNase T1 digestion. Multiple charge states, ranging from −24 to −36, were observed for the major oligonucleotide species (19.3% relative abundance), identified as a 102-mer with the composition C(A)101. Closer inspection of the most intense charge state, [M−34H]34−, demonstrated that the Xevo mass spectrometer (at 100,000 mass resolution) was able to resolve the isotopic distribution of this highly charged ion. Charge states corresponding to additional Poly(A) Tail components were similarly well resolved (data now shown). Although the monoisotopic peak corresponding to this high-molecular-weight oligonucleotide was not detected because of its extremely low abundance, as indicated by the blue line in Figure 7, the resolved isotopic distributions nevertheless enabled highly accurate mass measurements for all identified Poly(A) Tail species (see Figure 9) with mass accuracy errors under 10 ppm.
![isotopically resolved [M-34H]34– charge state of the most abundant 102-mer poly(A) tail oligonucleotide with the sequence C(A)101, resulted from RNase T1 cleavage of Fluc mRNA](/content/dam/waters/en/app-notes/2026/720009510/720009510en-f7.jpg.82.resize/img.jpg)
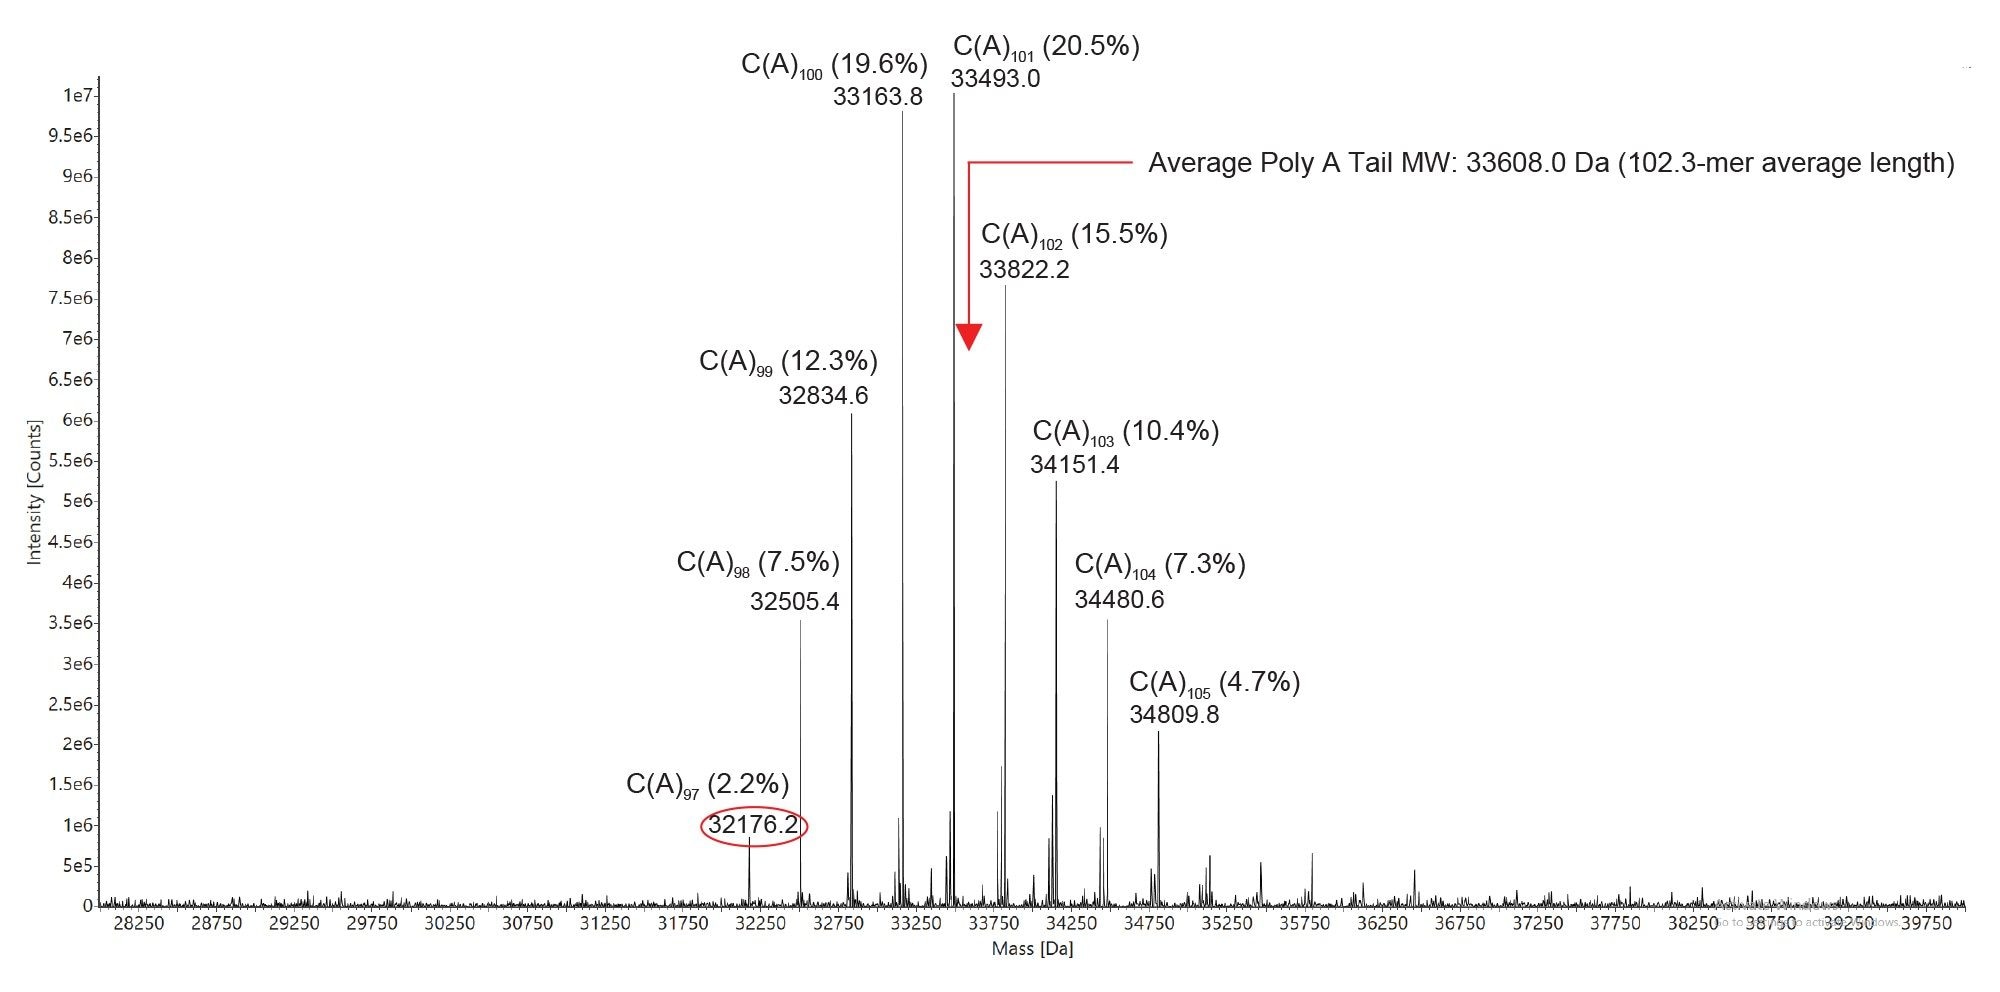
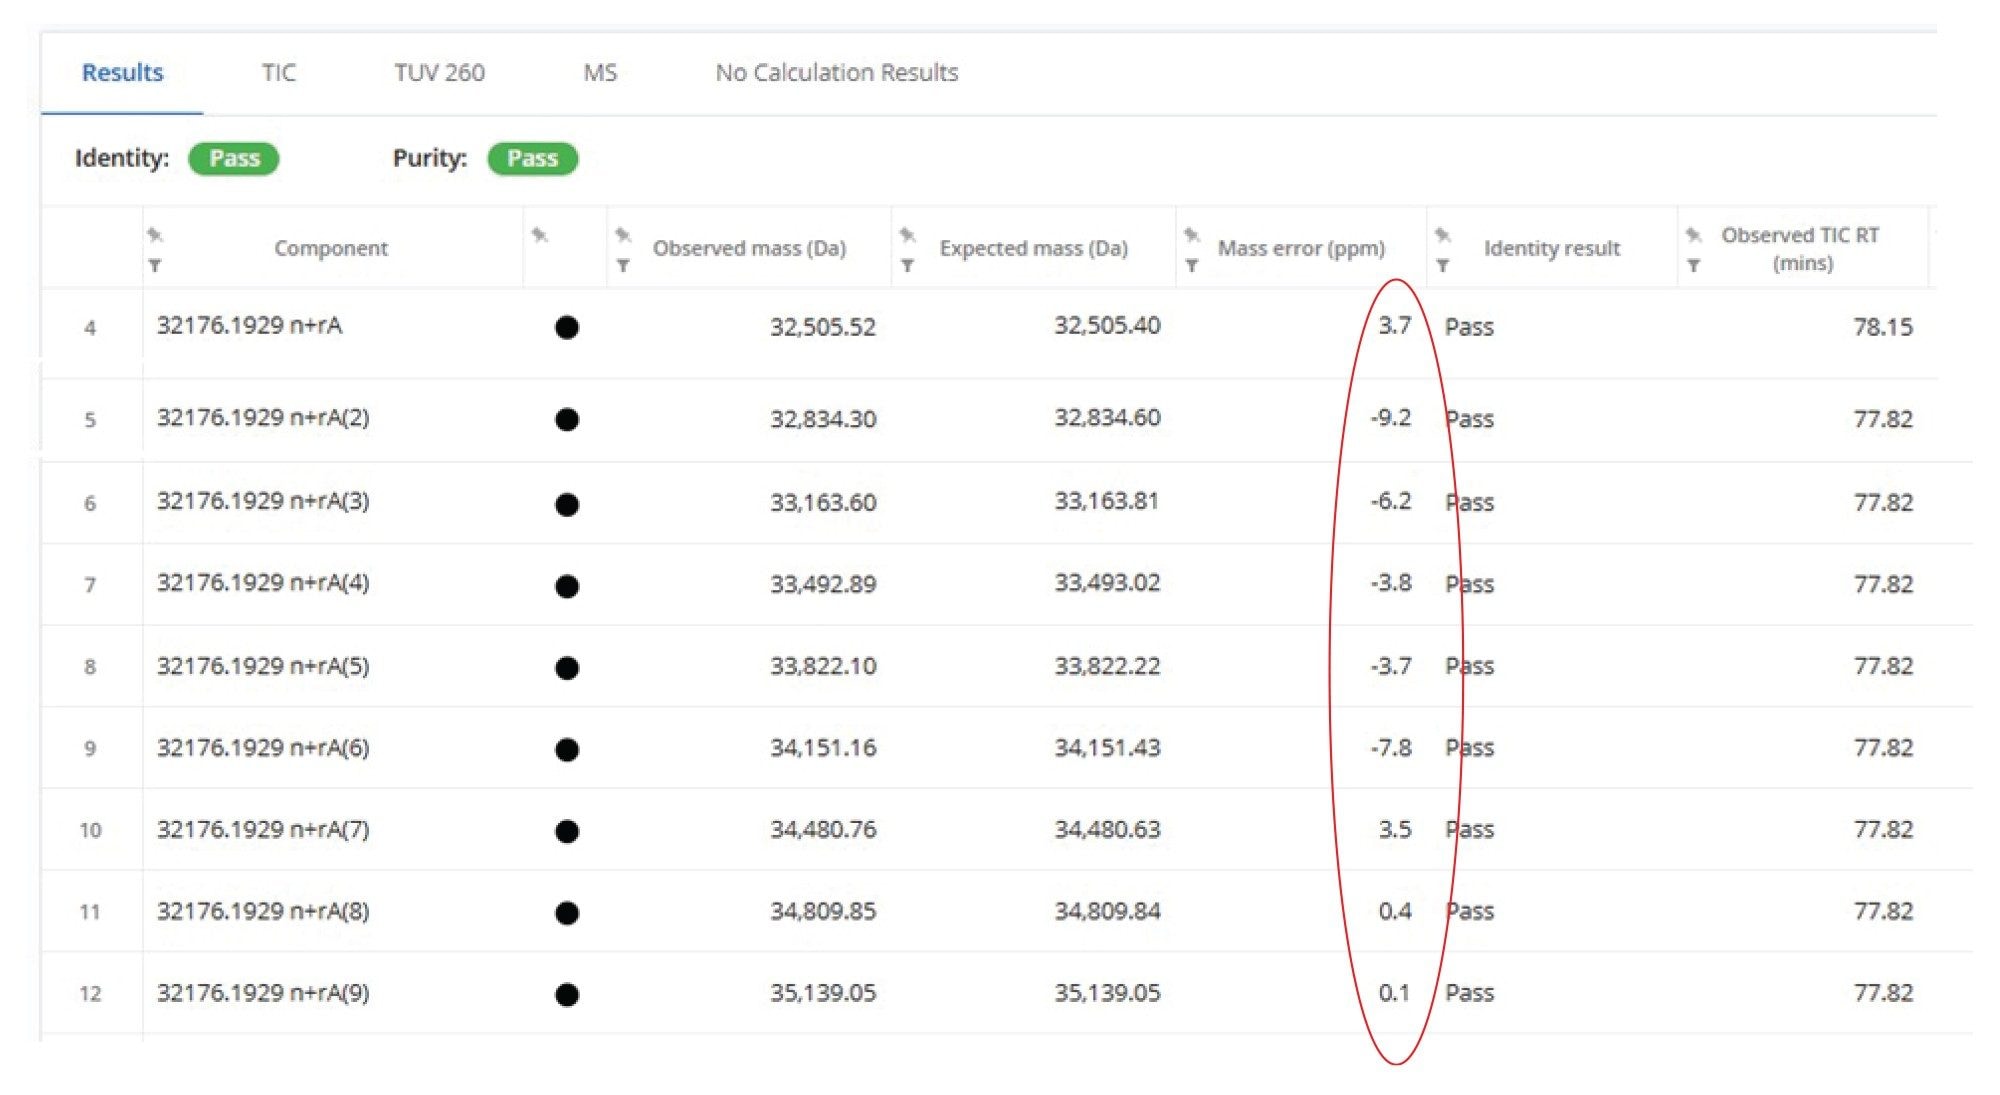
The INTACT Mass App was used for automated data processing of the Xevo Poly(A) dataset. The ESI-MS spectrum generated from all coeluting Poly(A) Tail oligonucleotides (shown in Figure 6) was deconvolved using the MaxEnt1 algorithm15 implemented in INTACT Mass App v1.916, and the resulting spectrum is presented in Figure 8. Deconvolution enabled the identification of nine distinct Poly(A) Tail species, ranging in length from 98 to 106 nucleotides. Relative abundances were determined from the intensities of the deconvolved spectra, with the most abundant component corresponding to a 102-mer oligonucleotide of composition C(A)101, accounting for 19.3% of the total MS signal. Based on the combined contributions of all nine polyadenosine species detected at relative abundances above 2.0%, the average molecular weight of the Poly(A) Tail was determined to be 33,608.0 Da, corresponding to an average tail length of 102.3 nucleotides. Both Poly(A) heterogeneity/dispersity, as well as the average mass measurement are important quality attributes for therapeutic mRNA molecules. Figure 9 presents a screenshot of the INTACT Mass processing results. As summarized in the table, nine consecutive Poly(A) Tail species were putatively identified with mass accuracies better than 10 ppm. The high MS resolution (~100,000) of the Xevo MRT mass spectrometer enabled highly accurate mass measurements for all Poly(A) Tail oligonucleotides through resolution of the isotopic distributions of their highly charged ions.
Thus, the single LC-MS assay developed for Capping Efficiency analysis also proved highly effective for the characterization of Poly(A) Tails enzymatically cleaved from prophylactic and therapeutic mRNAs.
720009510, July 2026


