
End-to-End High-Throughput Biotransformation Workflow: Automated Data Acquisition and Processing of Sub-Second UPLC Peaks Using Multi-Reflecting Time-of-Flight Mass Spectrometry (Xevo™ MRT P10 MS) and Dedicated Data-Mining Tools
Hania Khoury-Hollins, Jayne Kirk, Richard Lock
Waters Corporation, United Kingdom
Published on September 09, 2026

Abstract
Ultra-high performance liquid chromatography (UPLC™) coupled with high-resolution mass spectrometry (HRMS) has long been the standard for drug metabolite characterization. However, throughput is often limited by chromatographic peak dispersion, the need to balance mass resolution with scan speed, and the time required for data processing and interpretation. These factors, along with labor-intensive nature of data curation, slow down the delivery of actionable results.
To address these bottlenecks, we present a fully integrated, high-throughput data-dependent workflow that combines next-generation UPLC with multi-reflecting time-of-flight technology (Xevo™ MRT P10 MS) and dedicated data-mining software. This platform enables rapid, automated acquisition and processing of sub-second UPLC peaks, delivering part-per-billion mass accuracy in both MS1 and MS2, scan speeds up to 100 Hz, and high mass resolution (100K FWHM).
Benefits
- High throughput and reliable results: excellent data quality achieved at fast acquisition rates.
- Mass accuracies: Sub-ppm mass accuracy for both MS1 and MS2 (parent and fragment ions, respectively)
- Automated processing with dedicated MassMetaSite software: reducing human bias and the need for extensive manual data interrogation
- Increased productivity and reduced operating costs per sample: high-throughput workflow that boosts laboratory productivity by up to eight times while cutting organic solvent consumption by ~80% (on the bases of an average run time of 14 minutes and average flow rate of 0.4 mL/min).
Introduction
Acetaminophen (APAP), a widely used analgesic and antipyretic, is among the most commonly used non-prescription drugs worldwide1. APAP is also used in veterinary practices alone or in combination with other analgesics by either intravenous route (i.v.) or per os (p.o). In most species, APAP is mainly biotransformed to its glucuronide and sulphate conjugates. A small percentage of APAP is deacetylated to para-aminophenol (PAP) or oxidized by cytochrome P450. However, the relative contribution of each pathway can vary substantially between species, limiting its use to a small number of species2,3.
In dogs APAP-induced toxicity has been linked to limited arylamine N-acetyltransferase (NAT) activity, which reduces the capacity to re-acetylate the metabolite para-aminophenol (PAP). As a result, PAP accumulates and promotes methemoglobinemia and haemolysis 4. This toxicity is reported at doses greater than 200 mg/kg 2,5.
Traditional ultra-high performance liquid chromatography (UPLC™) coupled to high-resolution mass spectrometry (HRMS) is the gold standard for drug metabolite characterization. However, throughput can be limited by peak dispersion, the need to balance mass resolution with scan speed, and the time required for data processing and interpretation. These factors, along with labour-intensive data review, slow down the delivery of actionable results. To address these challenges, high-throughput data dependent acquisition workflow combining a next generation UPLC with multi reflecting time-of-flight technology (Xevo™ MRT P10 MS) and dedicated data-mining software was implemented.
In this study, this UHPLC-HRMS solution was used for the analysis of plasma and urine samples following i.v. administration of acetaminophen to the dog.
Experimental
Sample Preparation
Male beagle dogs received a single intravenous (i.v.) dose of acetaminophen (10 mg/kg). Urine was collected pre- and post-dose and stored at -20°C. Samples were prepared fresh prior to analysis. Briefly, to 5 µL of urine samples, 95 µL of cold methanol were added. Samples were vortexed for 5 seconds and incubated at -20°C for 10 minutes, then brought to room temperature, vortexed for a further 5 seconds, and centrifuged at 12,000g for 10 minutes at 4°C. 20 µL of supernatant was diluted with 480 µL of water. Finally, 2 µL of the diluted extract were analyzed by reversed-phase UPLC coupled to a multi reflecting time-of-flight mass spectrometer Xevo MRT P10 MS, as described below. Metabolites were profiled under multiple chromatographic gradients using data-dependent acquisition (DDA) and MassMetaSite software. Workflow improvements were assessed by comparing results obtained with shorter runtimes to those from a conventional UPLC method used by the contract research organization (CRO) that prepared the samples. This comparison focused on data quality, sample analysis times, and confidence in structural characterization.
The in vivo study was performed by Pharmaron UK Ltd., after full management and ethical review. The study was conducted in accordance with the appropriate Test Facility Standard Operating Procedures and with due regard to and in the spirit of GLP as per Pharmaron Uk Ltd company policy.
LC-MS Conditions
|
LC system: |
Waters ACQUITY™ Premier System |
|
Analytical column: |
ACQUITY UPLC® HSS T3 1.8 µm, 2.1 x 50 mm (p/n: 186003538) |
|
Column temperature: |
40 °C |
|
Vials: |
TruView™ pH Control LCMS certified Clear Glass Vial (p/n: 186005669CV) |
|
Sample temperature: |
6 °C |
|
Injection volume: |
2 µL |
|
Flow rate: |
0.6 mL/min |
|
Mobile phase A: |
Water +0.1% HCOOH |
|
Mobile phase B: |
Acetonitrile +0.1% HCOOH |
LC Gradient Table
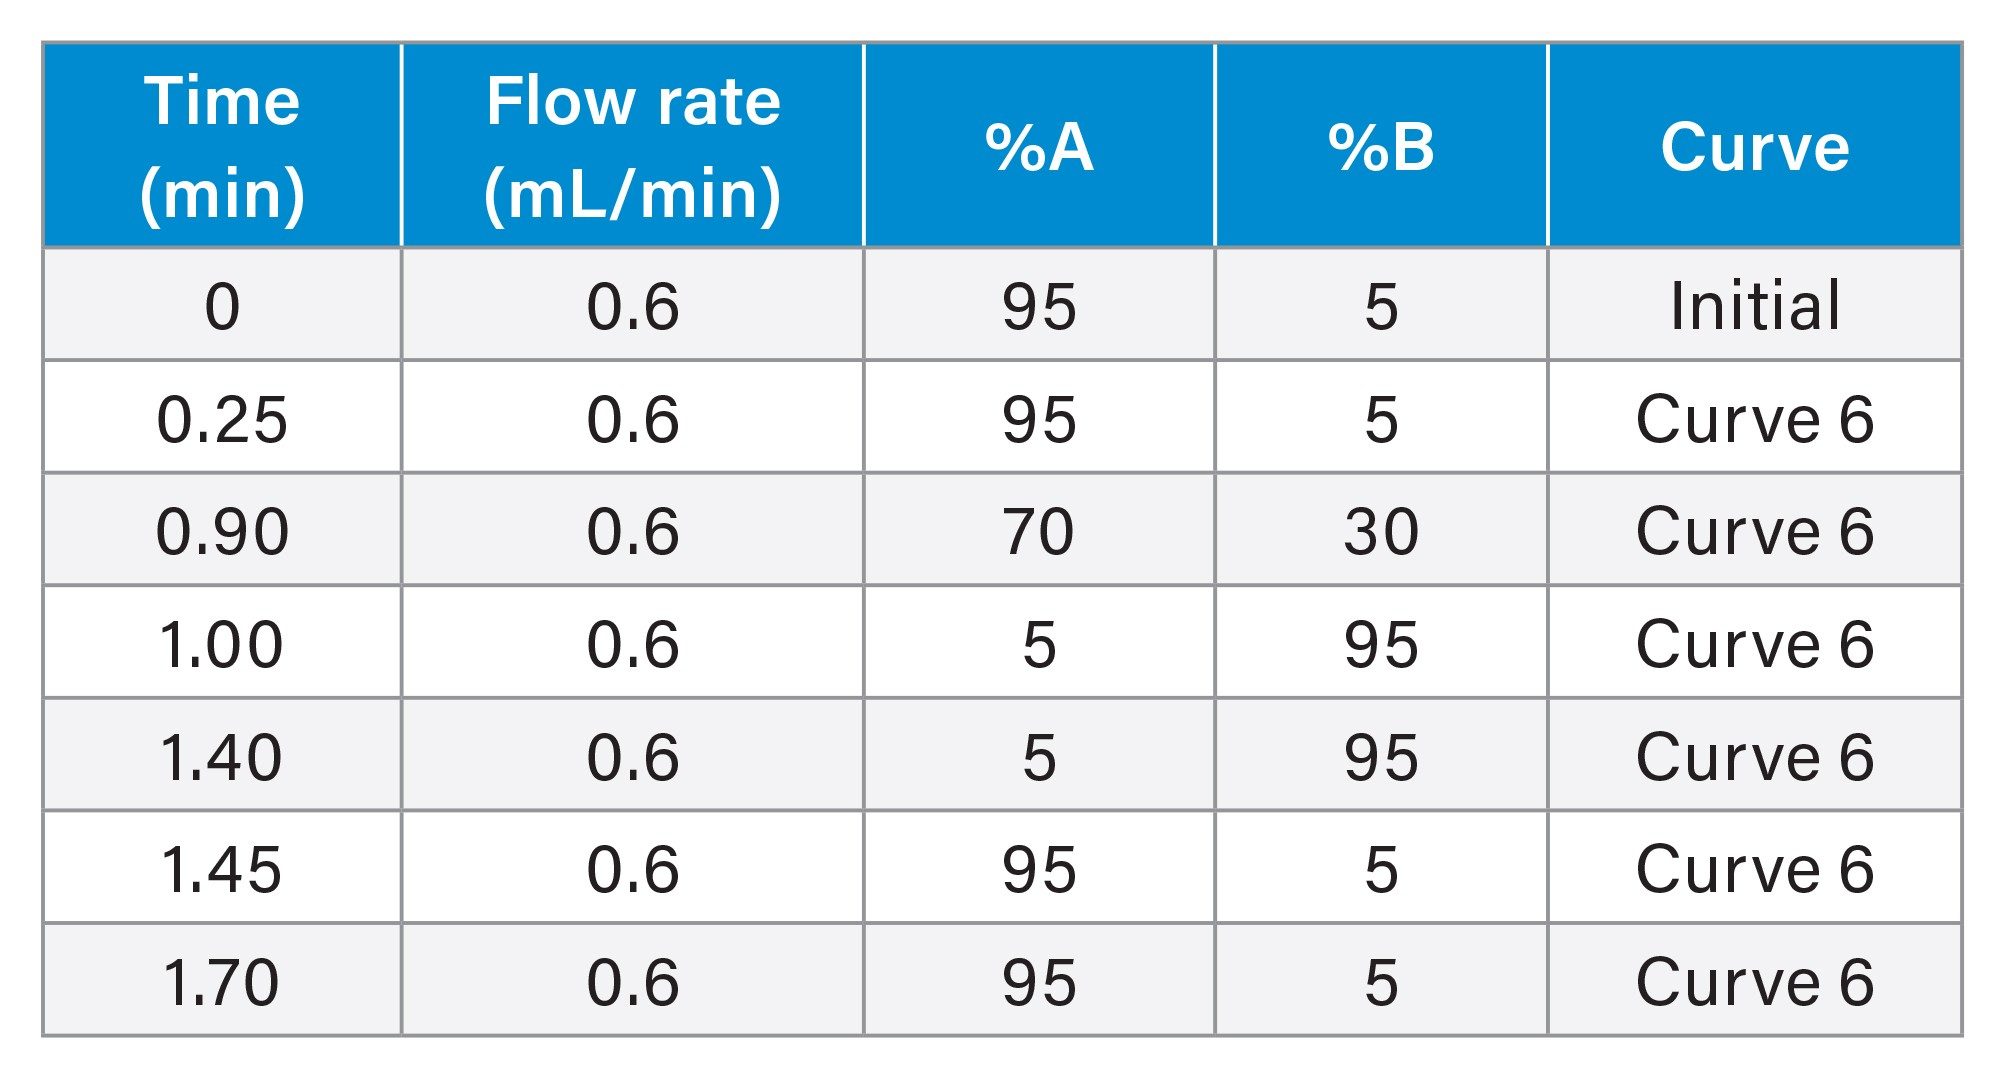
MS Conditions
|
MS system: |
Xevo MRT P10 Mass Spectrometer |
|
Ionization mode: |
ESI+ |
|
Mass range: |
m/z 50–1200 |
|
Acquisition mode: |
Data dependent acquisition (DDA) |
|
Acquisition rates: |
Survey scan time at 50 Hz, MS/MS scan rate at 100 Hz |
|
Maximum simultaneous MS/MS acquisition: |
5 |
|
MS/MS dynamic exclusion: |
Acquire and then exclude for 1s |
|
Lock mass: |
Dual point lock mass using Leucine enkephalin (m/z 556.27658 and 120.08078) |
Source Conditions
|
Capillary voltage: |
0.8 kV |
|
Cone voltage: |
30 V |
|
Source temperature: |
120 °C |
|
Desolvation temperature: |
600 °C |
|
Cone gas: |
50 L/h |
|
Desolvation gas: |
1000 L/h |
Collision Energy
|
Low mass ramp: |
10–30 V |
|
High mass ramp: |
20–50 V |
Software Tools
Data were acquired using the waters_connect™ Software Platform. Following acquisition, data sets were converted to mzML format using the DATA Convert application within waters_connect. Data were centroided, and m/z precision was set to 64 bits. The resulting mzML files were then processed using Mass Analytica’s MassMetaSite software for metabolite identification.
Results and Discussion
Reducing the total runtime by speeding the chromatography
The analytical method provided by the testing laboratory consisted of a long chromatographic runtime of about 45 minutes. The analytical column was 150 mm x 4.6 mm, 3.5 µm, and the chromatography was coupled to a scintillation detector. As this study did not use radioactivity, reducing the runtime was necessary to improve throughput. A conventional metabolite identification method typically uses a gradient of 10 to 20 mins. As a first step in the method transfer, we evaluated alternative column dimensions with smaller particle size. Two lengths were tested: 100 mm and 50 mm. Because metabolite separation was maintained with the 50 mm column (data not shown), the selected column was 50 x 2.1 mm, 1.8 µm (details in the method section). Figure 1 illustrates the gradients used.
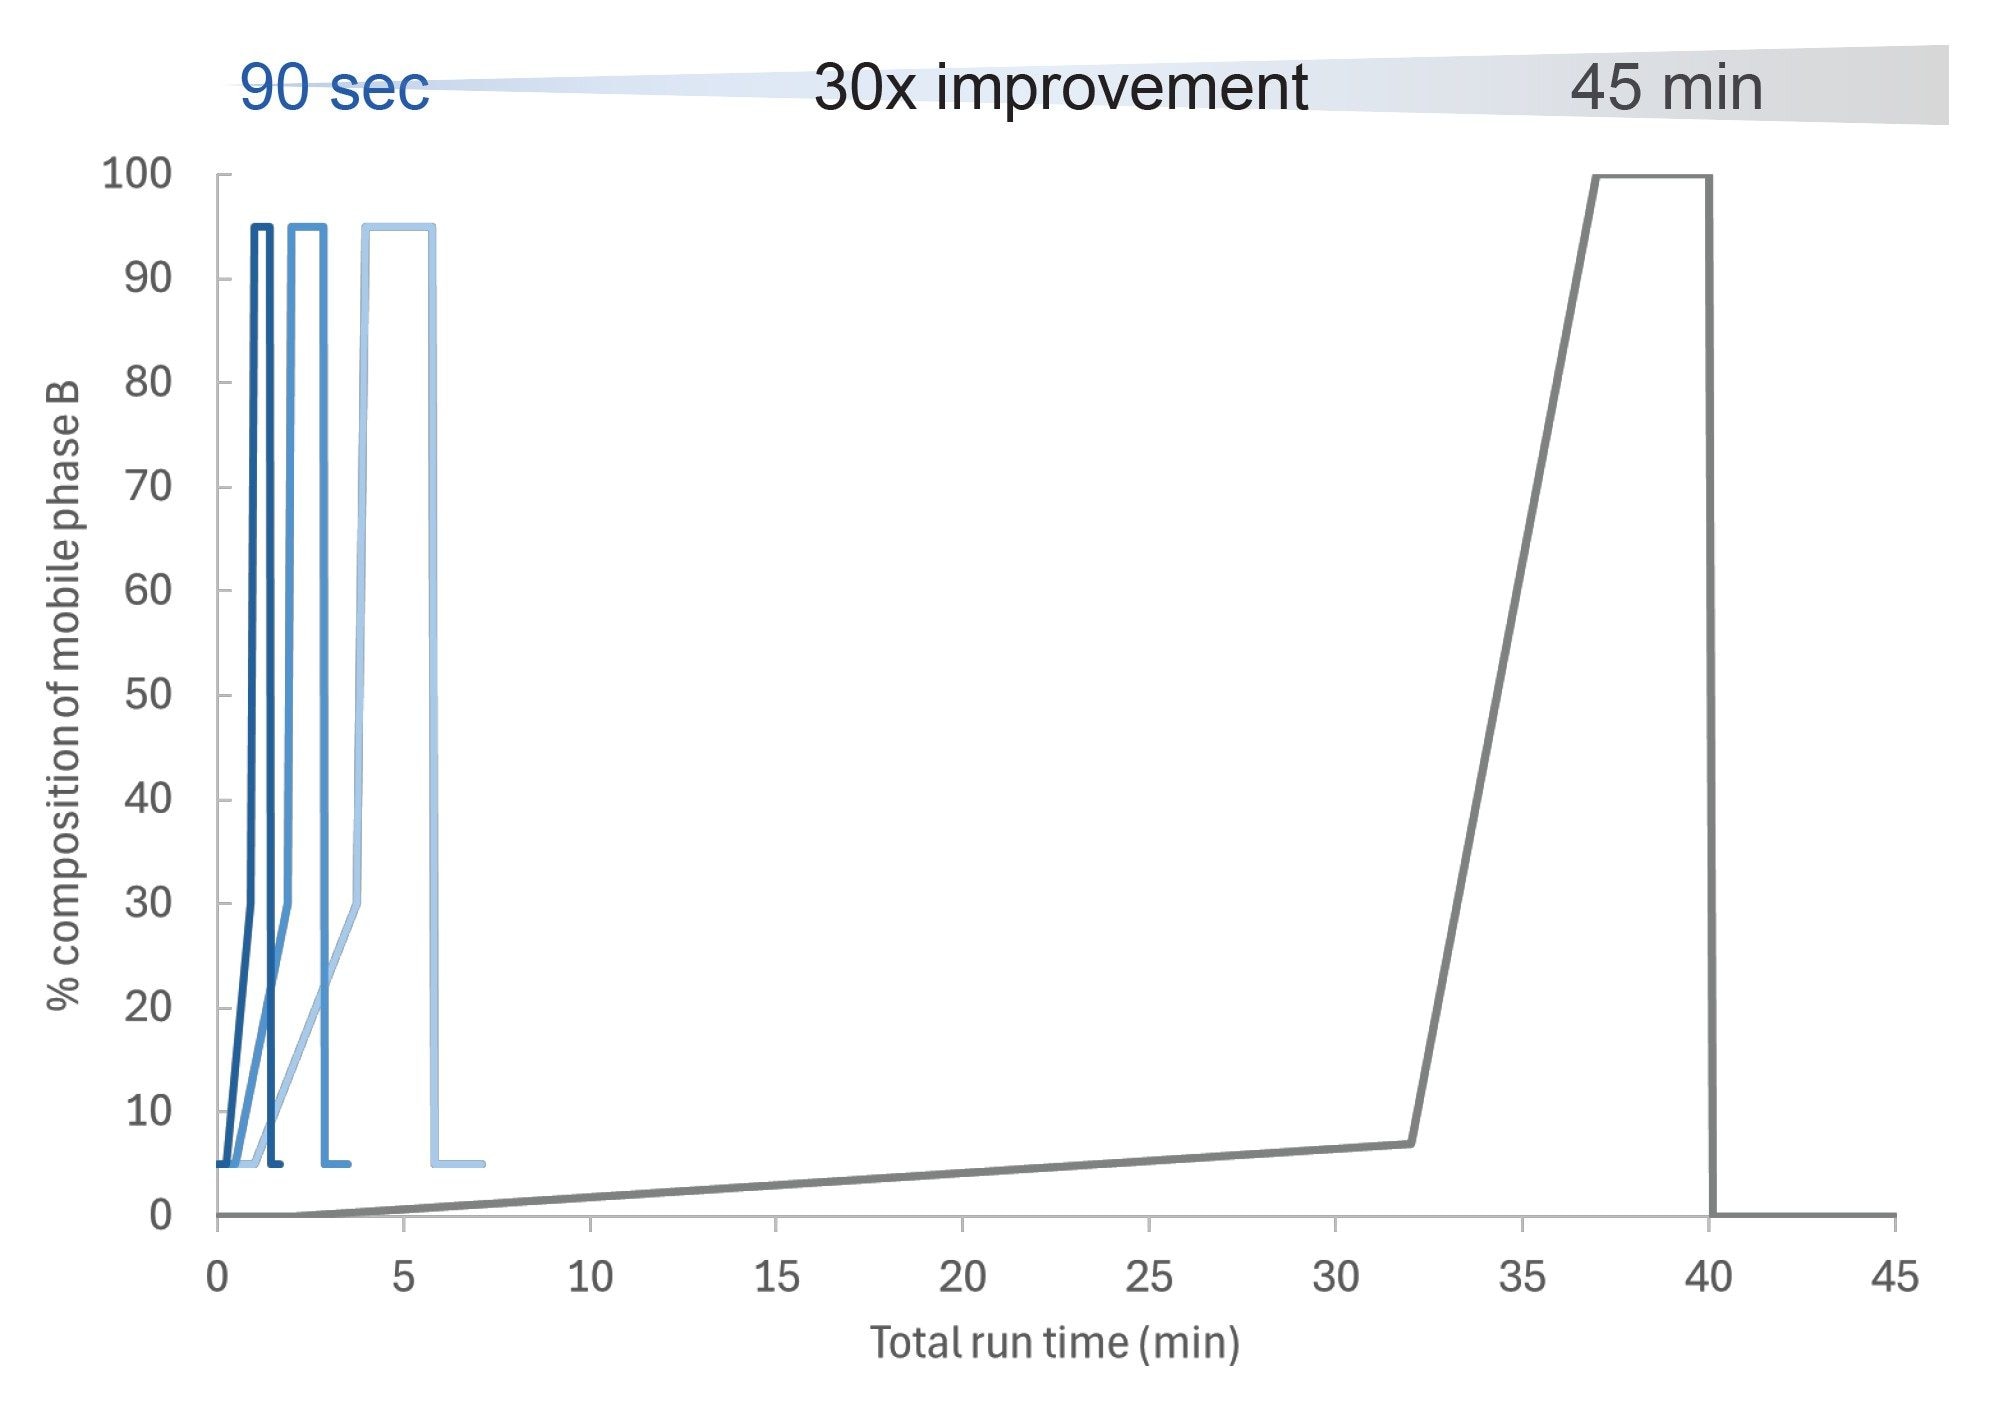
The grey traces in figure 1 represent the 45 min gradient used by the CRO with a scintillation detector. The blue lines represent the gradients evaluated using the ACQUITY UPLC® HSS T3 1.8 µm, 2.1x50mm column. By reducing the column dimensions and slightly increasing the flow rates, the total runtime was 30-fold reduced.
Identification of APAP’s metabolites in urine 6 hours post administration
Urine extract collected pre‑dose and 6 h post i.v. administration of APAP, together with analytical standards, were analyzed under the different gradient lengths. Gradient acceptance criteria were based on the detection of all the expected APAP metabolites. To do so, DATA Convert, a waters_connect software tool, was used to convert the data into mzML. The resulting mzML files were then processed using Mass Analytica’s MassMetaSite software to identify APAP’s metabolites. Figure 2 shows an overlay of the extracted ion chromatograms of all the identified metabolites in urine 6 hours post i.v. administration using a 6 min and less than 90 seconds gradients (Figure 2 A and B, respectively).
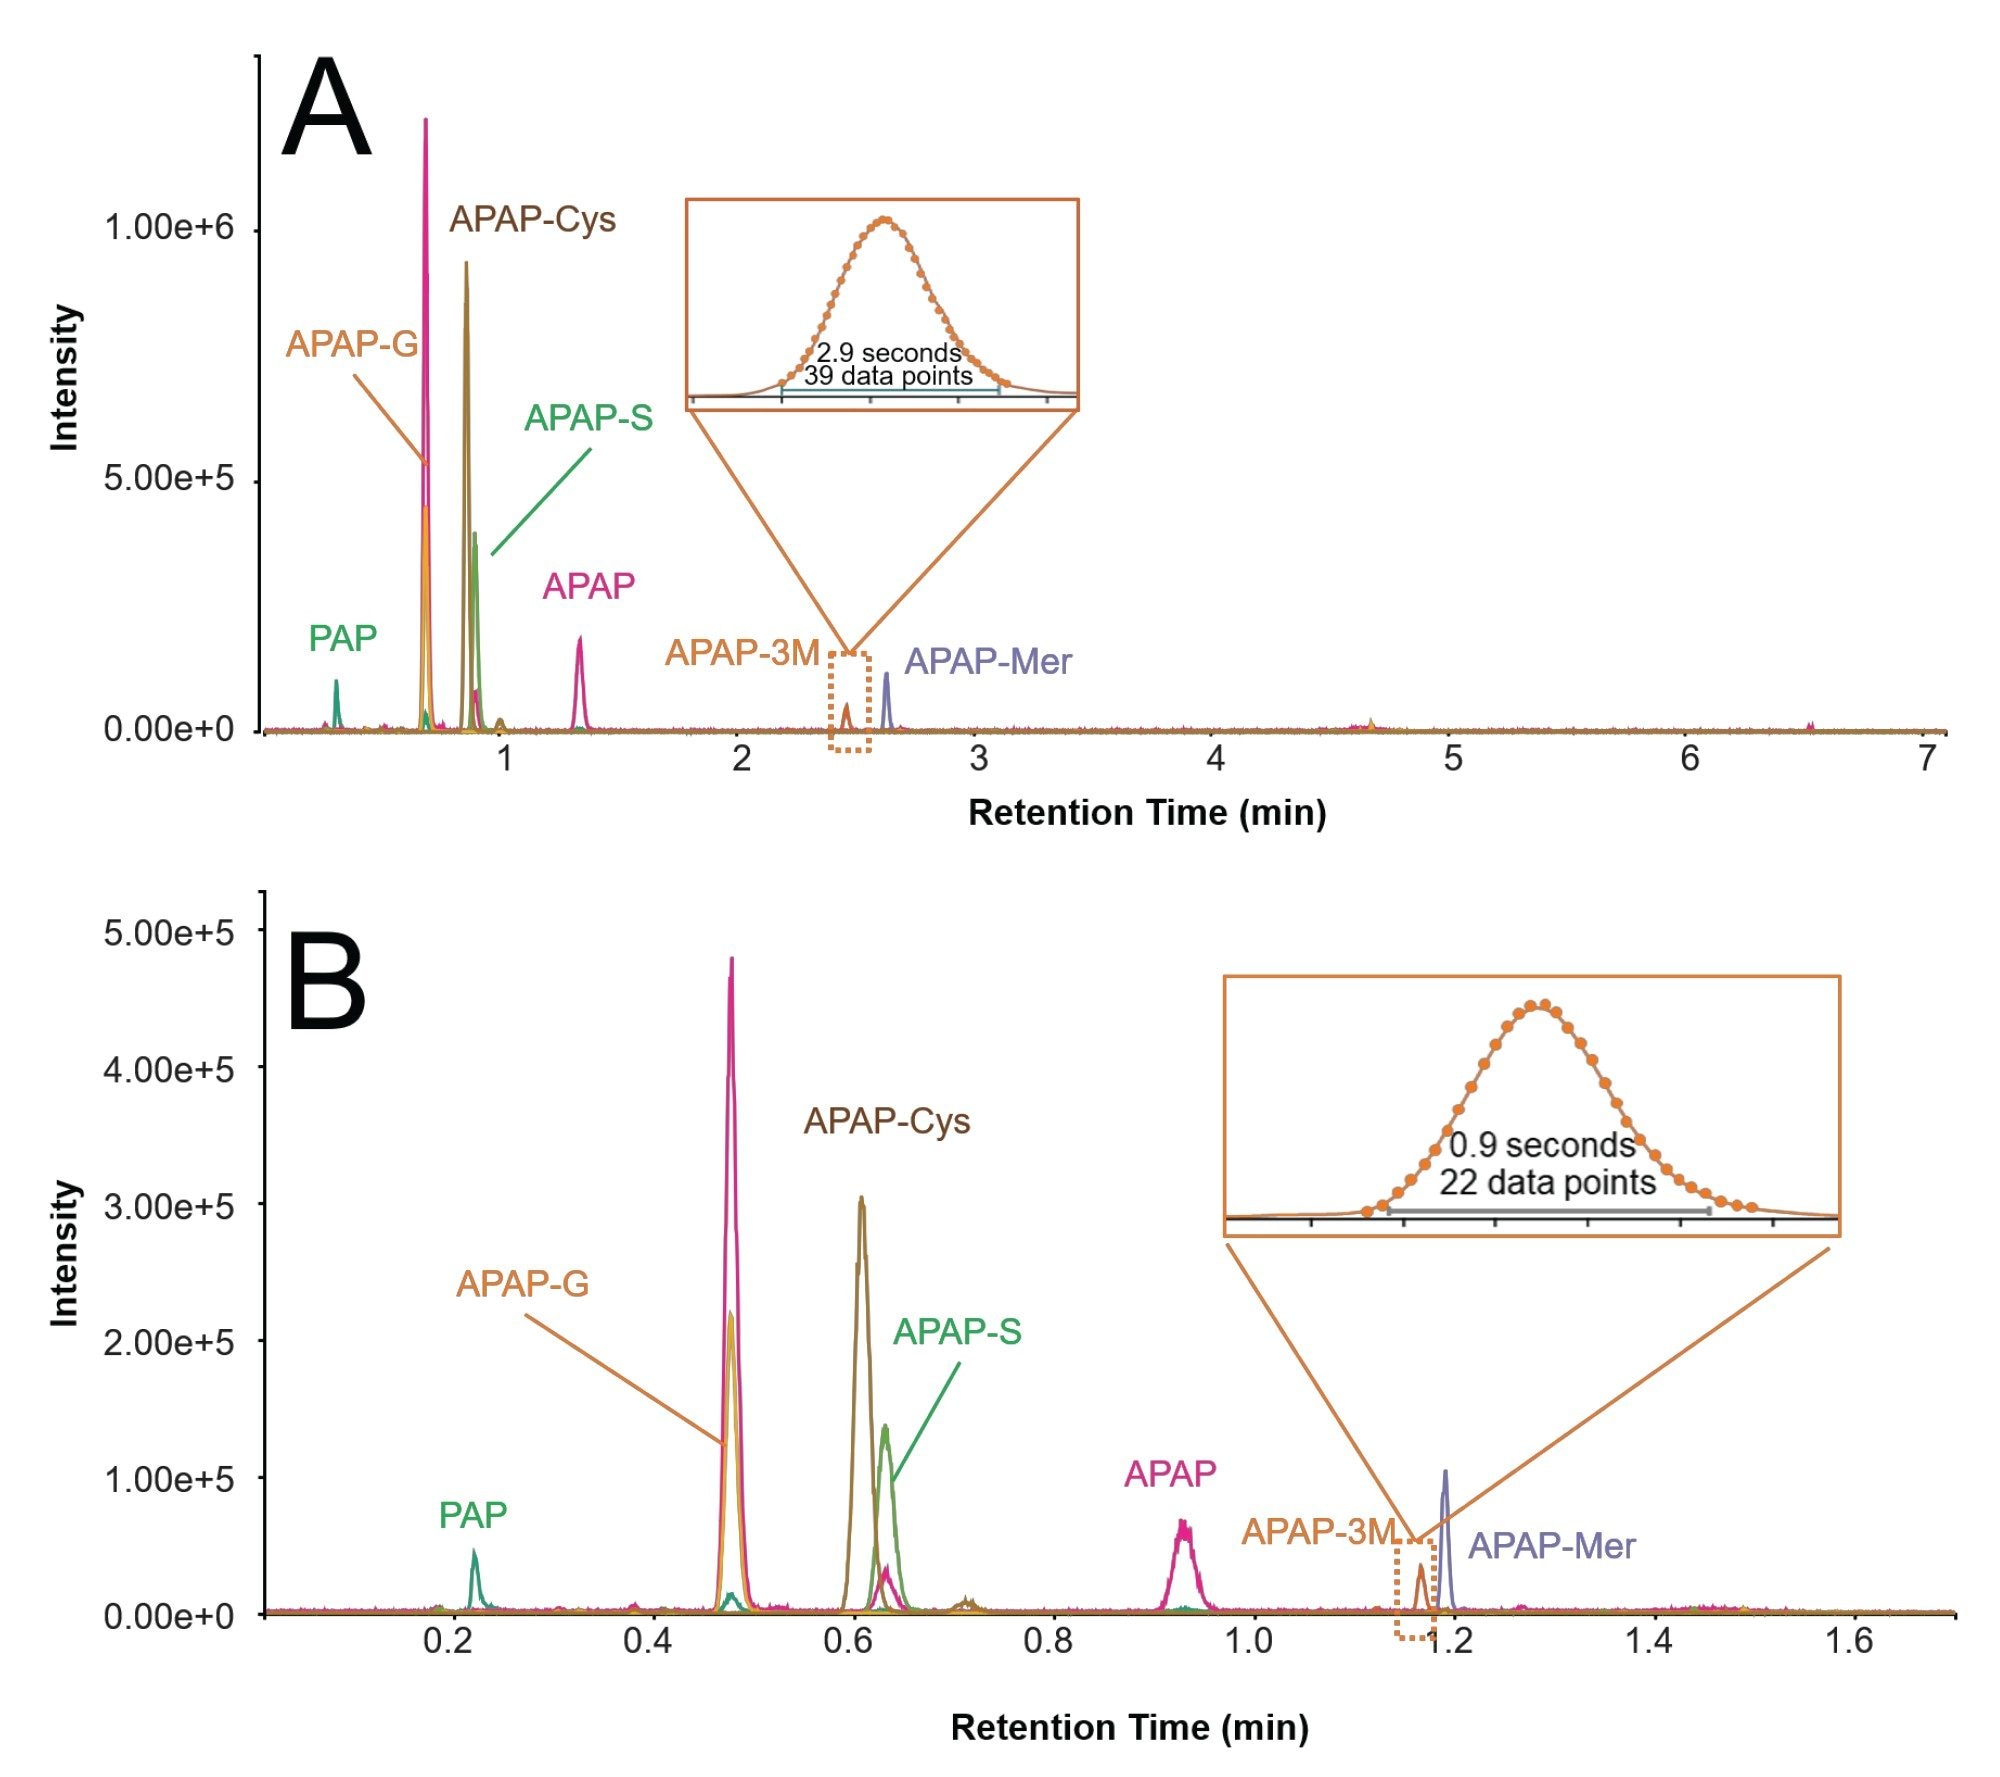
Figure 2 shows that by reducing the gradient from 6 minutes (Figure 2A) to 90 seconds (Figure 2B), the chromatographic resolution of the different metabolites was maintained. The boxed region in Figure 2A and Figure 2B highlights 3-thiomethyl acetaminophen (APAP-3M). By reducing the gradient, the peak width of APAP-3M improved from 2.9 seconds to 0.9 seconds. In addition, at an acquisition rate of 100 Hz and with a peak width of less than 1 second, at least 22 measurement points were collected across the peak.
All the metabolites were identified with a RMS of mass measurement accuracy of 0.754 ppm. Table 1 summarizes the observed m/z, the ion formula, mass measurement accuracy and the isotopic similarity between the observed and theoretical compound.
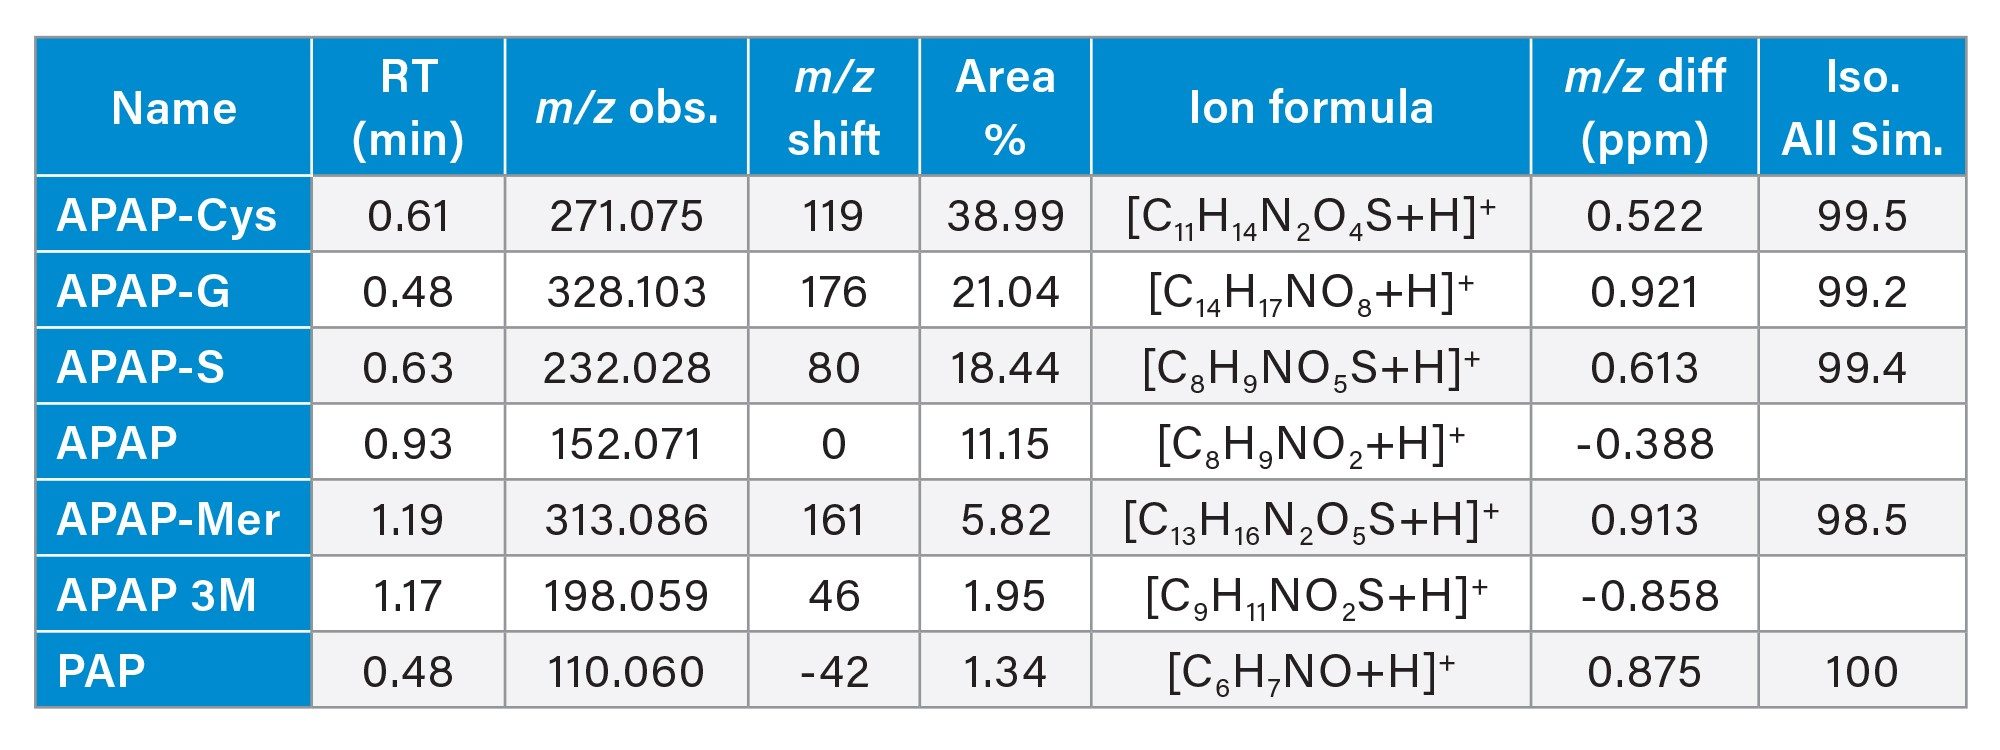
Table 1. Acetaminophen’ s metabolites identified in urine 6 hours post i.v. administration in a 90 second gradient. All metabolites were identified with RMS mass measurement accuracy < 0.754 ppm.
APAP: Acetaminophen (acetaminophen), PAP: 4-aminophenol, APAP-G: acetaminophen glucuronide, APAP-Cys: acetaminophen cysteine conjugate, APAP-S: acetaminophen sulfate, APAP-3M: 3-thiomethyl acetaminophen APAP-Mer: acetaminophen mercapturinc acid.
MassMetaSite software performs the identification of metabolites and assigns chemical structures to automatically detected chromatographic peak based on the MS and MS/MS spectra of the substrate (APAP) and its metabolites. Figure 3 depicts the MS/MS spectra of the 3 main metabolites obtained using DDA acquisition at 100 Hz, with the structural assignment of each of the fragments. Boxed structures correspond to the proposed parent ion structure.
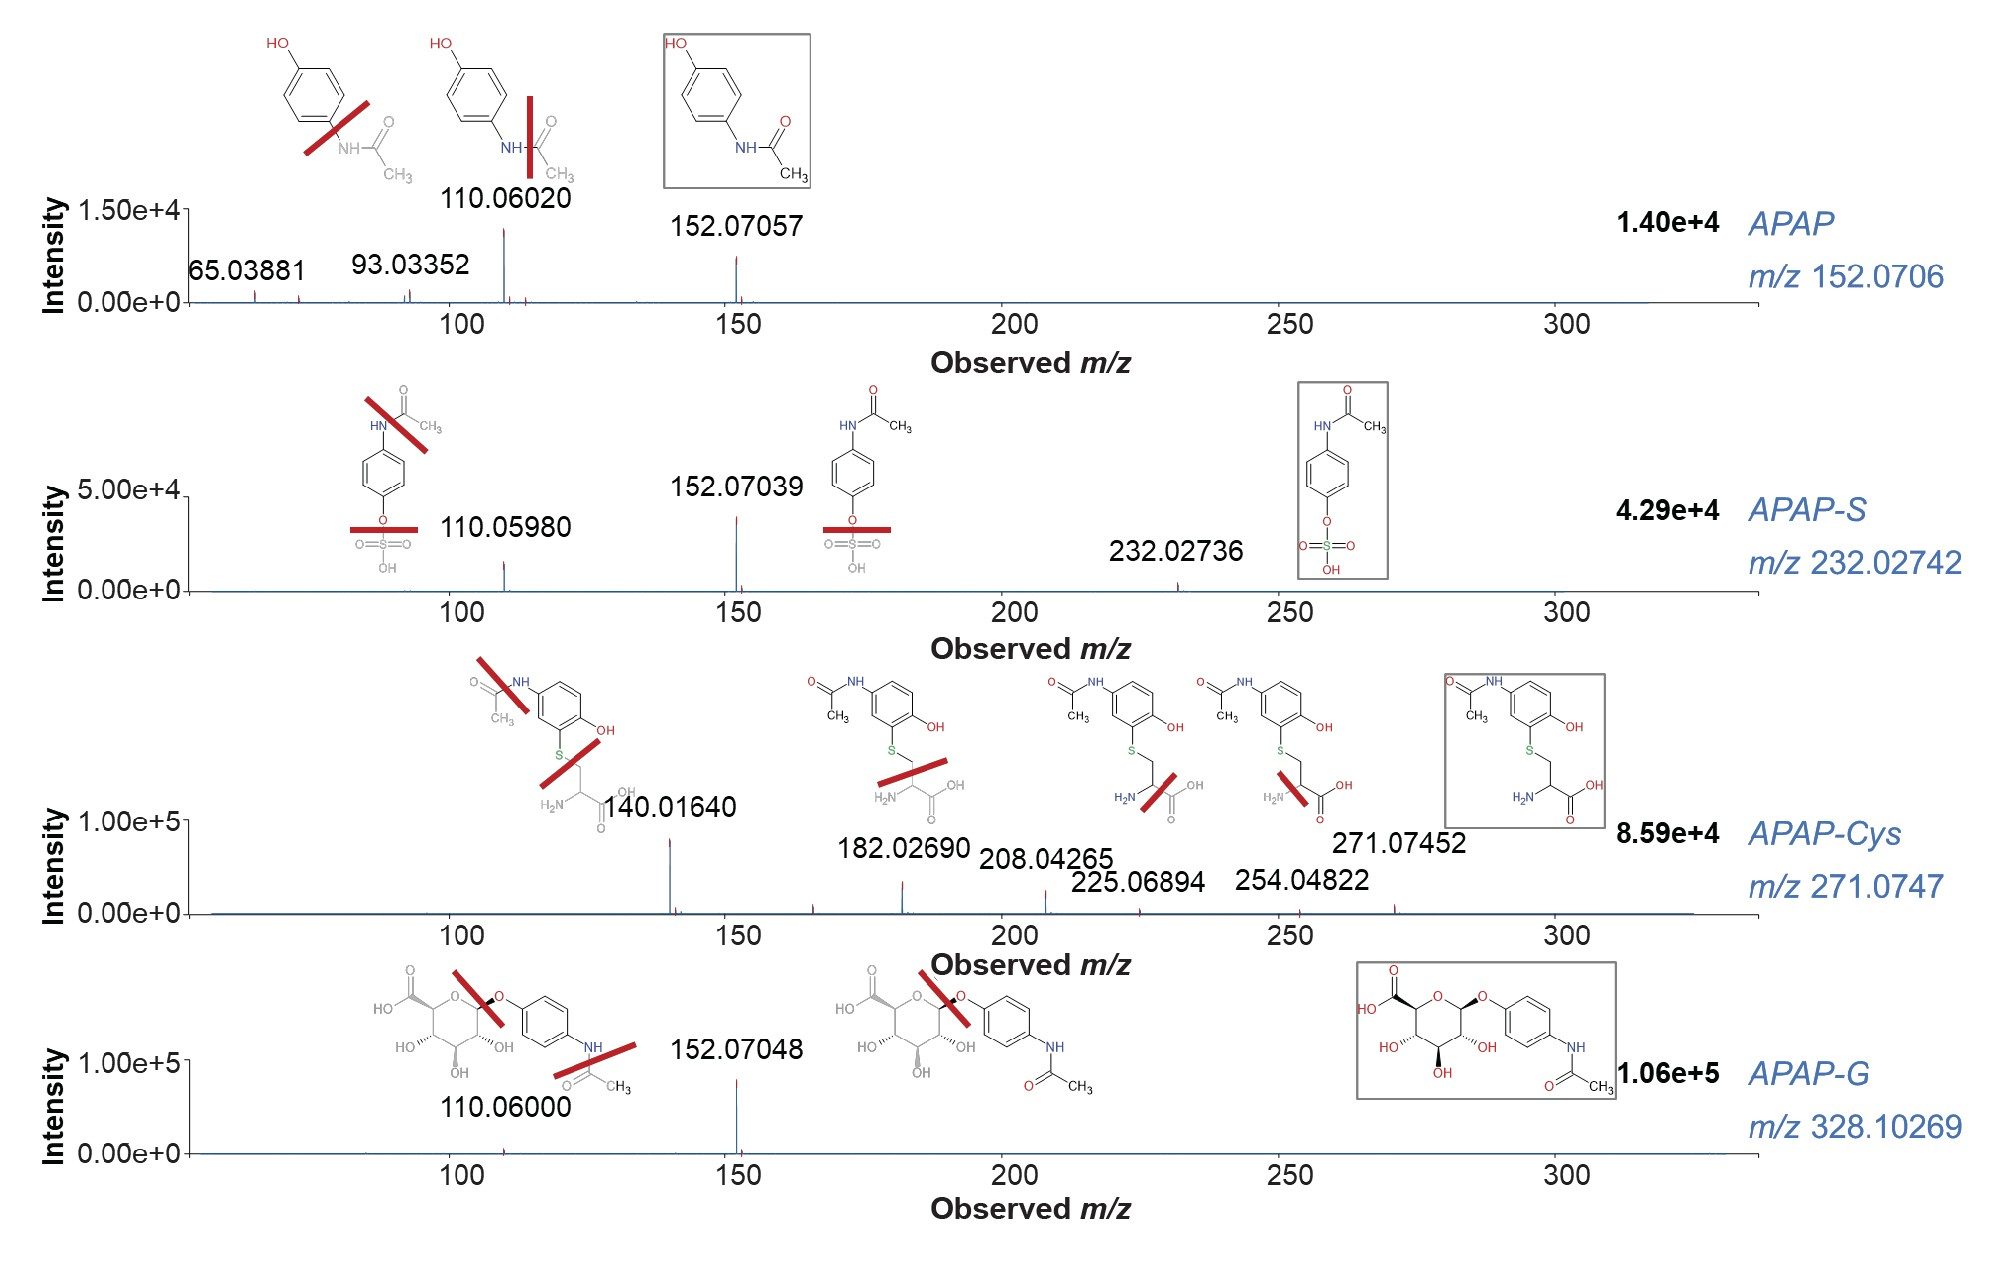
Herein, shorter gradients combined with higher flow rates produced narrower chromatographic peak widths; consequently, the acquisition rate was increased. The data presented above demonstrate that the acquisition rate was sufficient to collect multiple measurements across sub-second peaks (Figure 2B, box, Figure 3). Importantly, overall instrument performance was maintained under these demanding conditions, with data quality matching that achieved using gradients ~30x longer and slower scan rates.
Conclusion
Excellent instrument performance under fast chromatographic conditions allowed reducing the total analytical run time at least by 8-folds (on the basis of a total run time of 14 minutes). The Xevo MRT P10 MS maintained the high data quality, including mass accuracy and high quality of MS/MS spectra. The data dependent acquisition mode ensured the correct assignment of the precursor and fragment ions.
Improved data quality enabled faster data interpretation and increased confidence in both expected and novel acetaminophen metabolites, minimizing false identifications. Automated processing with MassMetaSite software leveraged these unique data attributes, significantly reducing human bias and the need for extensive manual data interrogation.
The end-to-end workflow from the data acquisition to the data interpretation using MassMetaSite was completed in less than 5 minutes, compared to an hour (for an average runtime of 14 minutes). This novel methodology achieved higher sample throughput while maintaining (and, in key areas, improving) data quality, delivering high-confidence results and reduced analytical compromise.
Acknowledgments
The authors gratefully acknowledge Professor Ian Wilson of Imperial College London and the Royal Veterinary College for kindly donating the samples used in this work.
References
- DrugBank https://go.drugbank.com/drugs/DB00316
- Savides, M. C., Oehme, F. W., Nash, S. L. Leipold, H.W. The toxicity and biotransformation of single doses of acetaminophen in dogs and cats. Toxicol Appl Pharmacol. 74:26-34 (1984). doi: 10.1016/0041-008x(84)90266-7.
- Fadel, C., Sartini, I., Giorgi, M. Acetaminophen: A focus on dogs. Am. J. Anim. Vet. Sci. 16: 247.262 (2021).
- McConkey SE, Grant DM, Cribb AE. The role of para-aminophenol in acetaminophen-induced methemoglobinemia in dogs and cats. Journal of Veterinary Pharmacology and Therapeutics. 2009;32(6):585–595. doi:10.1111/j.1365-2885.2009.01080.x
- Mazaleuskaya, L.L, Sangkuhl, K., Thorn, C., F., FitzGerald, G., A., Altman, R., B., Klein, T., E. PharmGKB summary: Pathways of acetaminophen metabolism at the therapeutic versus toxic doses. Pharmacogenet Genomics. 25: 416–426 (2015). doi:10.1097/FPC.0000000000000150.
Featured Products
720009385, May 2026


