Validated LC-MS/MS Method for Vitamin E Acetate in Cannabis Plants and Derived Products
Cullen Millera, Darcy Owensa, Olivia Howgilla, Josh Kollmeyera, Dimple Shahb, Narendra Meruvab
aGreen Precision Analytics, MO, United States
bWaters Corporation, Milford, MA, United States
Published on November 18, 2025
Abstract
Vitamin E acetate (VEA) has been recognized as a critical marker in cannabis testing following its association with vaping-related lung injury and subsequent regulatory action. In February 2024, Missouri’s Division of Cannabis Regulation (DCR) revised the action limit for VEA in cannabis products, relaxing the threshold from 0.2 ppm to 5 ppm. This change has sparked health concerns, highlighting the continued need for reliable analytical approaches to ensure product safety and compliance. This application note presents the development and validation of a sensitive and selective LC-MS/MS method for the quantitation of VEA in cannabis flower and cannabis concentrates. The method utilizes the ACQUITY™ UPLC™ H-Class System coupled with a Xevo™ TQ-S micro Mass Spectrometer and reversed-phase ACQUITY UPLC BEH™ C18 Column. A simplified sample preparation workflow was applied to both matrices to maximize efficiency and throughput. The method was validated at Green Precision Analytics (GPA, MO, USA) in accordance with acceptance criteria defined by the Missouri Department of Health and Senior Services (DHSS). Evaluation of calibration range, linearity, limit of detection (LOD), limit of quantification (LOQ), accuracy, precision, recovery, repeatability, and robustness demonstrated that the method delivers accurate, reproducible, and regulatory-compliant quantification of VEA across cannabis product types.
Benefits
- The validated LC-MS/MS method provides high sensitivity and specificity for VEA quantification in complex cannabis matrices, including flower and concentrates.
- Minimal sample preparation reduces handling time and improves laboratory throughput, supporting efficient routine analysis.
- The method demonstrates robust performance across multiple matrices, ensuring reliable detection even in lipid-rich, chemically diverse samples.
- Use of Waters ACQUITY UPLC H-Class System and Xevo TQ-S micro Mass Spectrometer enables accurate quantitation well below regulatory requirements.
- The validated method complies with Missouri DCR and DHSS regulatory limits, enabling laboratories to confidently monitor VEA in cannabis products.
Introduction
VEA is used as a diluent and viscosity modifier in certain cannabis-derived products, including vaping formulations. Following increased public health awareness during 2019, VEA became a marker of interest for quality control and regulatory surveillance across cannabis supply chains due to its potential impact on lung health. In addition to concentrates and vape liquids, trace residues may be present in infused products and processing intermediates. Therefore, reliable quantification of VEA in these chemically diverse, lipid-rich matrices requires an analytical method that is sensitive, selective, and robust against matrix effects. In February 2024, Missouri’s DCR revised the tolerance limit for VEA in cannabis products from 0.2 ppm to 5 ppm.1
Liquid chromatography coupled with tandem quadrupole mass spectrometry (LC-MS/MS) provides the sensitivity and specificity required to distinguish VEA from endogenous cannabinoids, terpenes, and other lipophilic excipients, while also offering the sensitivity to support low-ppm and sub-ppm action limits. Unlike UV-based methods, where co-eluting chromophores may interfere, LC-MS/MS enables targeted multiple reaction monitoring (MRM) for confident identification and accurate quantitation in complex cannabis matrices.
This application note describes the validation of an LC-MS/MS method for the quantitation of VEA in two inhalable products, cannabis flower and cannabis concentrates. The method was developed and validated using the Waters ACQUITY UPLC H-Class System coupled with a Xevo TQ-S micro Triple Quadrupole Mass Spectrometer. Chromatographic separation was achieved with a reversed-phase ACQUITY UPLC BEH C18 Column. A streamlined sample preparation approach was applied for cannabis flowers and concentrates, which minimizes handling time and increases sample throughput.
The validation study was conducted at GPA. Method performance was evaluated for calibration range, linearity, LOD, LOQ, accuracy, precision, recovery, repeatability, and robustness. The results of these are evaluated against acceptance criteria set by State of Missouri DHSS and presented in this application note.
Experimental
LC Conditions
|
LC system: |
ACQUITY UPLC H-Class Plus System |
|
MS detection: |
Xevo TQ-S micro Mass Spectrometer |
|
Column: |
ACQUITY UPLC BEH C18 Column, 2.1 x 50 mm, 1.7 µm (p/n: 186002350) |
|
Solvent manager: |
Quaternary Solvent Manager |
|
Sample manager: |
Sample Manager FTN |
|
Mobile phase A: |
5mM ammonium formate, 0.1% formic acid in DI H2O |
|
Mobile phase B: |
50:25:25 MeOH:Acetonitrile:IPA |
|
Purge solution: |
Acetonitrile: H2O (80:20) |
|
Wash solution: |
Acetonitrile: H2O (80:20) |
|
Pre-inject wash: |
10 seconds |
|
Post-inject wash: |
30 seconds |
|
Column temperature: |
65 °C |
|
Sample temperature: |
10 °C |
|
Seal wash: |
20% Acetonitrile in water |
|
Injection volume: |
10 µL |
|
LC isocratic: |
90%B |
|
Run time: |
3.5 min |
|
Flow rate: |
0.8 mL/min |
MS Conditions
|
Ionization mode: |
Electrospray Positive |
|
Capillary voltage (kV): |
0.8 |
|
Cone voltage (V): |
68 |
|
Collision energy (eV): |
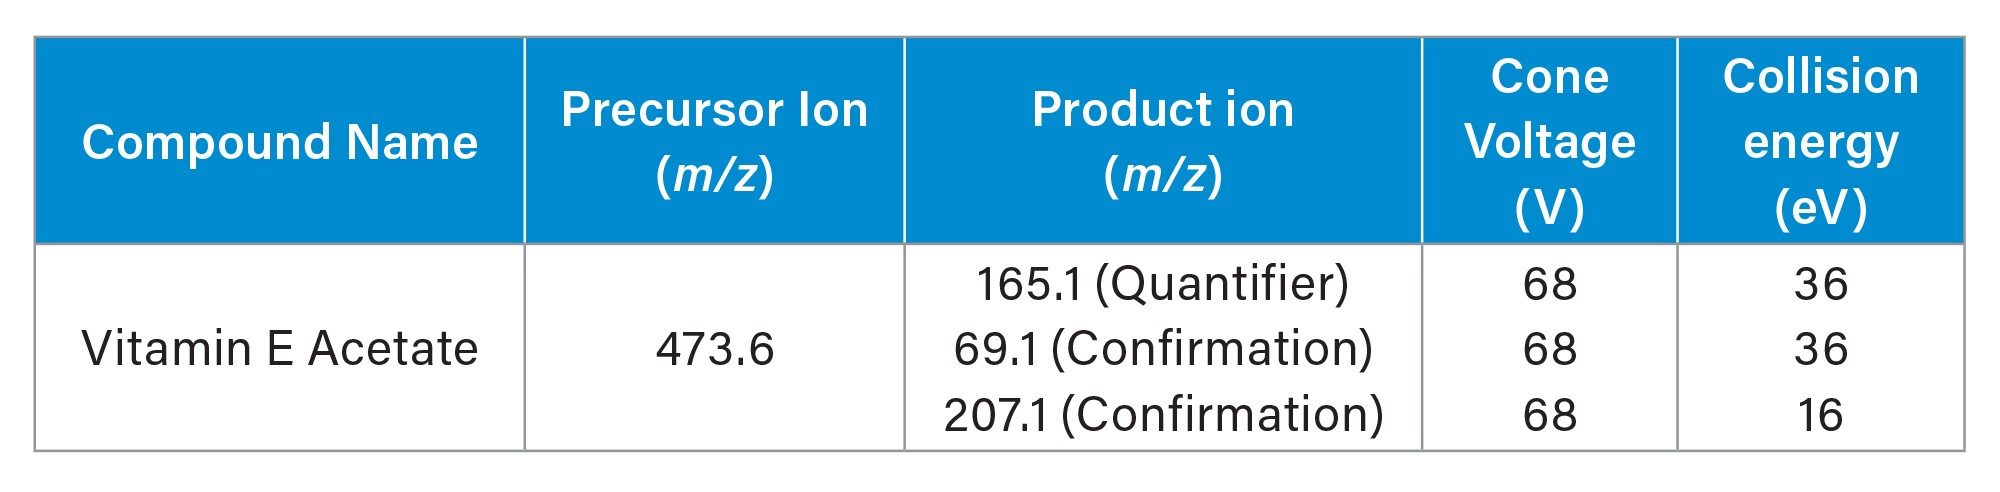
Table 1 |
|
Source temperature (°C): |
150 |
|
Desolvation temperature (°C): |
550 |
|
Desolvation gas flow (L/hr): |
800 |
Data Management
|
Software: |
MassLynx™ 4.1 Software |
|
Data processing: |
TargetLynx™ Application |
Preparation of Standards and Samples
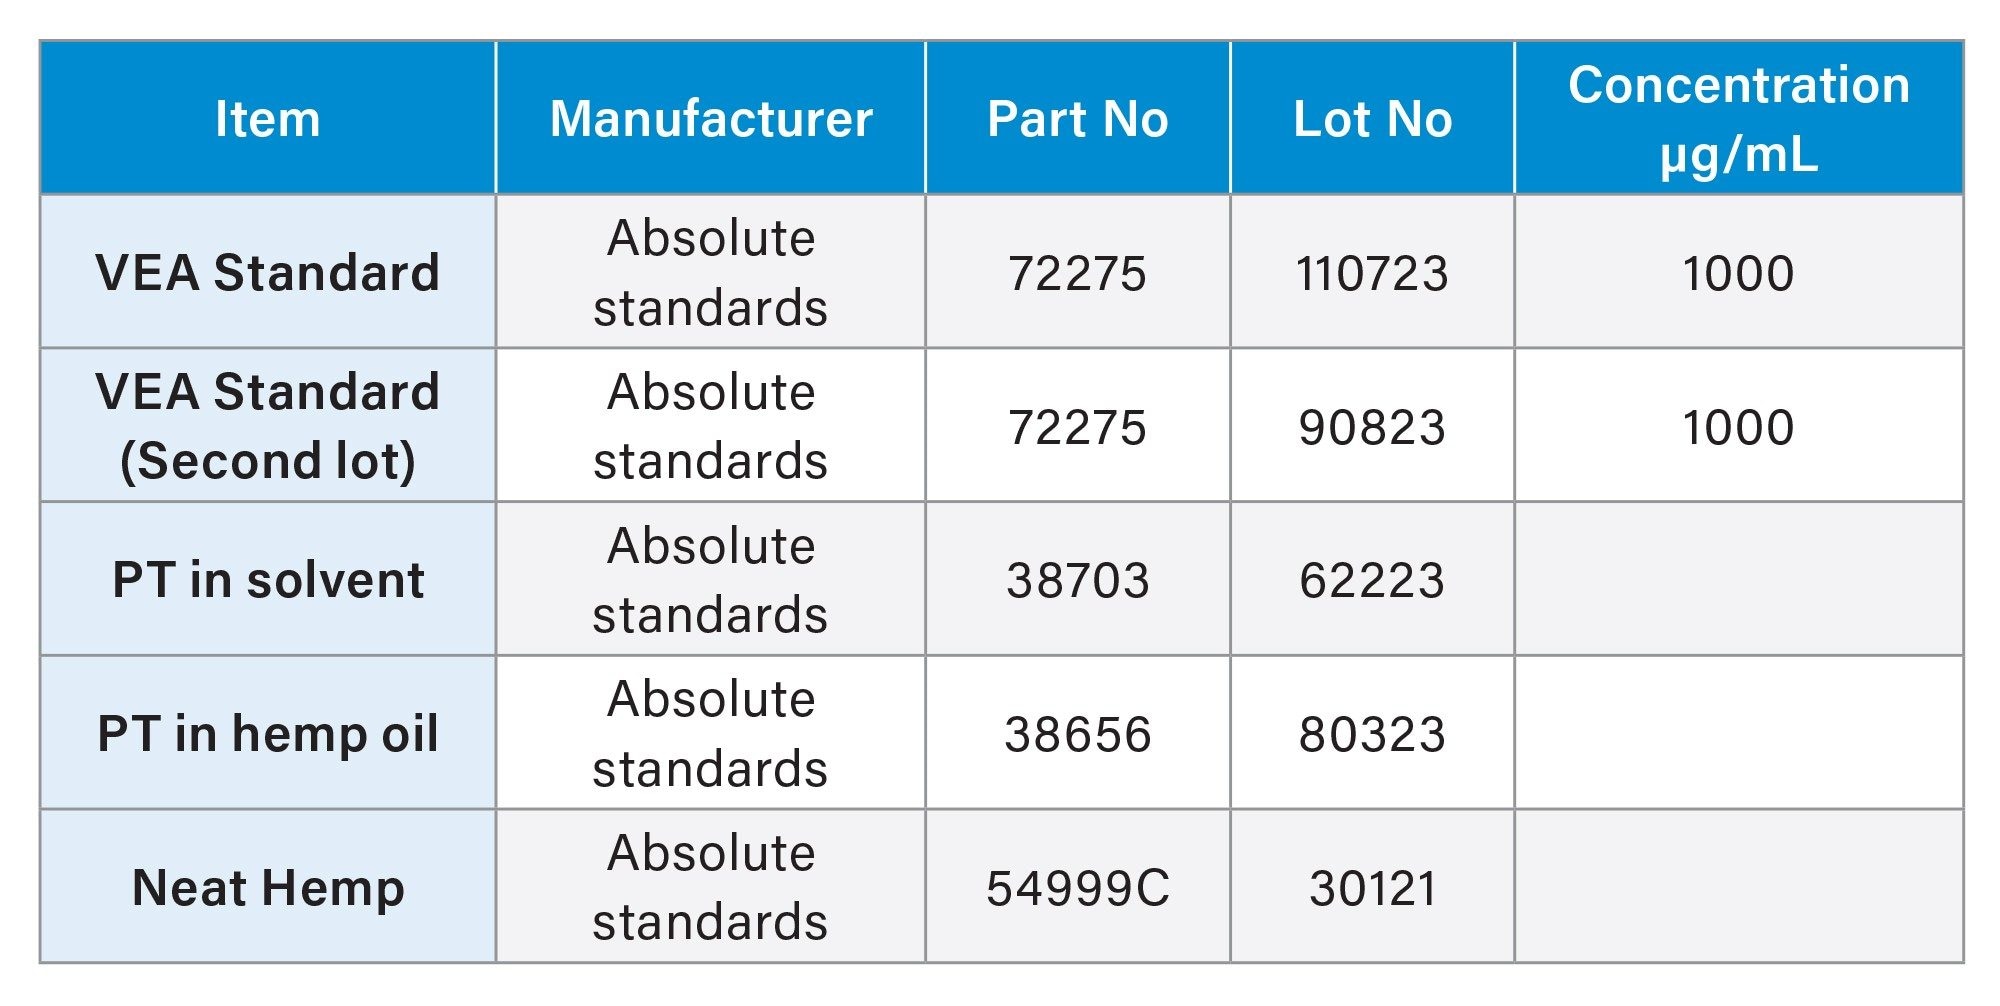
Table 2 provides the standards and proficiency testing (PT) samples employed in this validation study, including their part numbers, lot numbers, and sources of procurement.
Calibration Standards
The VEA reference standard (p/n: 72275, lot #110723) was supplied at 1000 ppm in methanol (primary stock). An intermediate working solution of 10 ppm was prepared by diluting the primary stock in a solvent mixture of acetonitrile:isopropanol:methanol (25:25:50, v/v/v). From this intermediate solution, a series of dilutions was prepared to generate a six-point calibration curve ranging from 10 ppb to 400 ppb (10, 25, 50, 100, 200, and 400 ppb) in the same solvent mixture.
Independent Calibration Verification (ICV)
The ICV standard is a calibration mixture prepared from a different lot than used for the calibration curve, serving to verify calibration accuracy. The VEA standard was supplied at 1000 ppm in methanol, and the ICV was prepared by diluting this standard to 100 ppb in the solvent mixture.
Continuing Calibration Verification (CCV)
The CCV standard is a calibration mixture of known concentration, injected periodically to verify calibration during extended runs. The VEA standard was obtained from a different lot (p/n: 72275, lot #90823) at 1000 ppm in methanol and diluted to 100 ppb in the solvent mixture.
Method Blank (MB)
A solvent blank consisting of acetonitrile was used as a method blank to monitor carryover or background contamination.
Preparation Blank
A preparation blank was prepared using a solvent mixture consisting of 50% methanol, 25% acetonitrile, and 25% isopropanol (v/v/v).
Sample Preparation
Weigh out approximately 0.25 grams (±0.02g) of sample into a 50 mL polypropylene conical tube and record exact mass. Dilute up to 10 mL with the 25:25:50 (v/v/v) acetonitrile:isopropanol:methanol mixture. Vortex sample in the multi-tube shaker at 2500 rpm for 1 minute or until dissolved. Centrifuge the sample for 5 minutes at 3000 rpm. Using a disposable syringe, draw 2 mL of supernatant. Pass the sample through a 0.2 µm PTFE syringe and filter into a 2 mL vial. Dilute as needed. Both cannabis flowers and concentrates were prepared with this method.
Matrix Spiked
Matrix spiked cannabis flower, cannabis concentrate and neat hemp (for certain studies - see recovery section) from the CRM were prepared using VEA. For spiking the matrix, the same VEA standard was taken as the CCV, and spiked from the 1000 ppm solution.
Results and Discussion
Chromatographic Separation
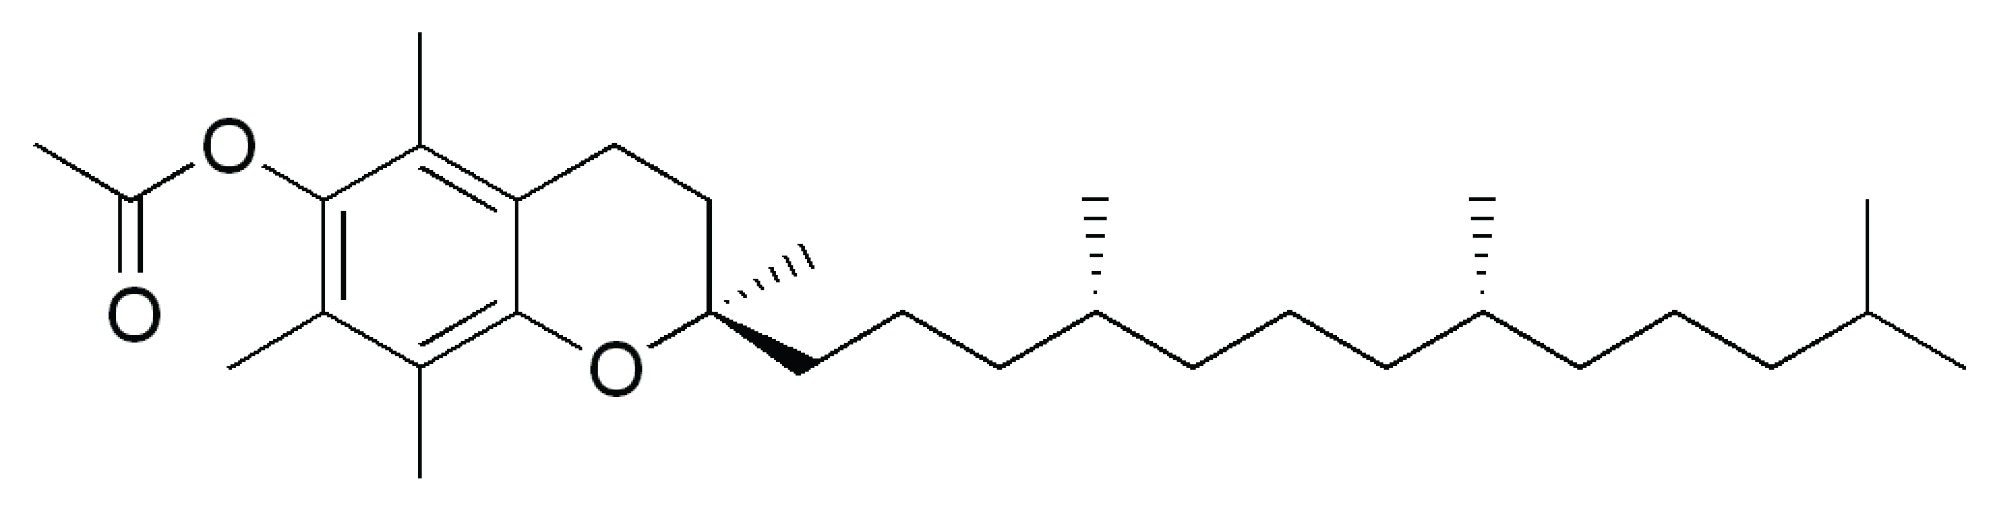
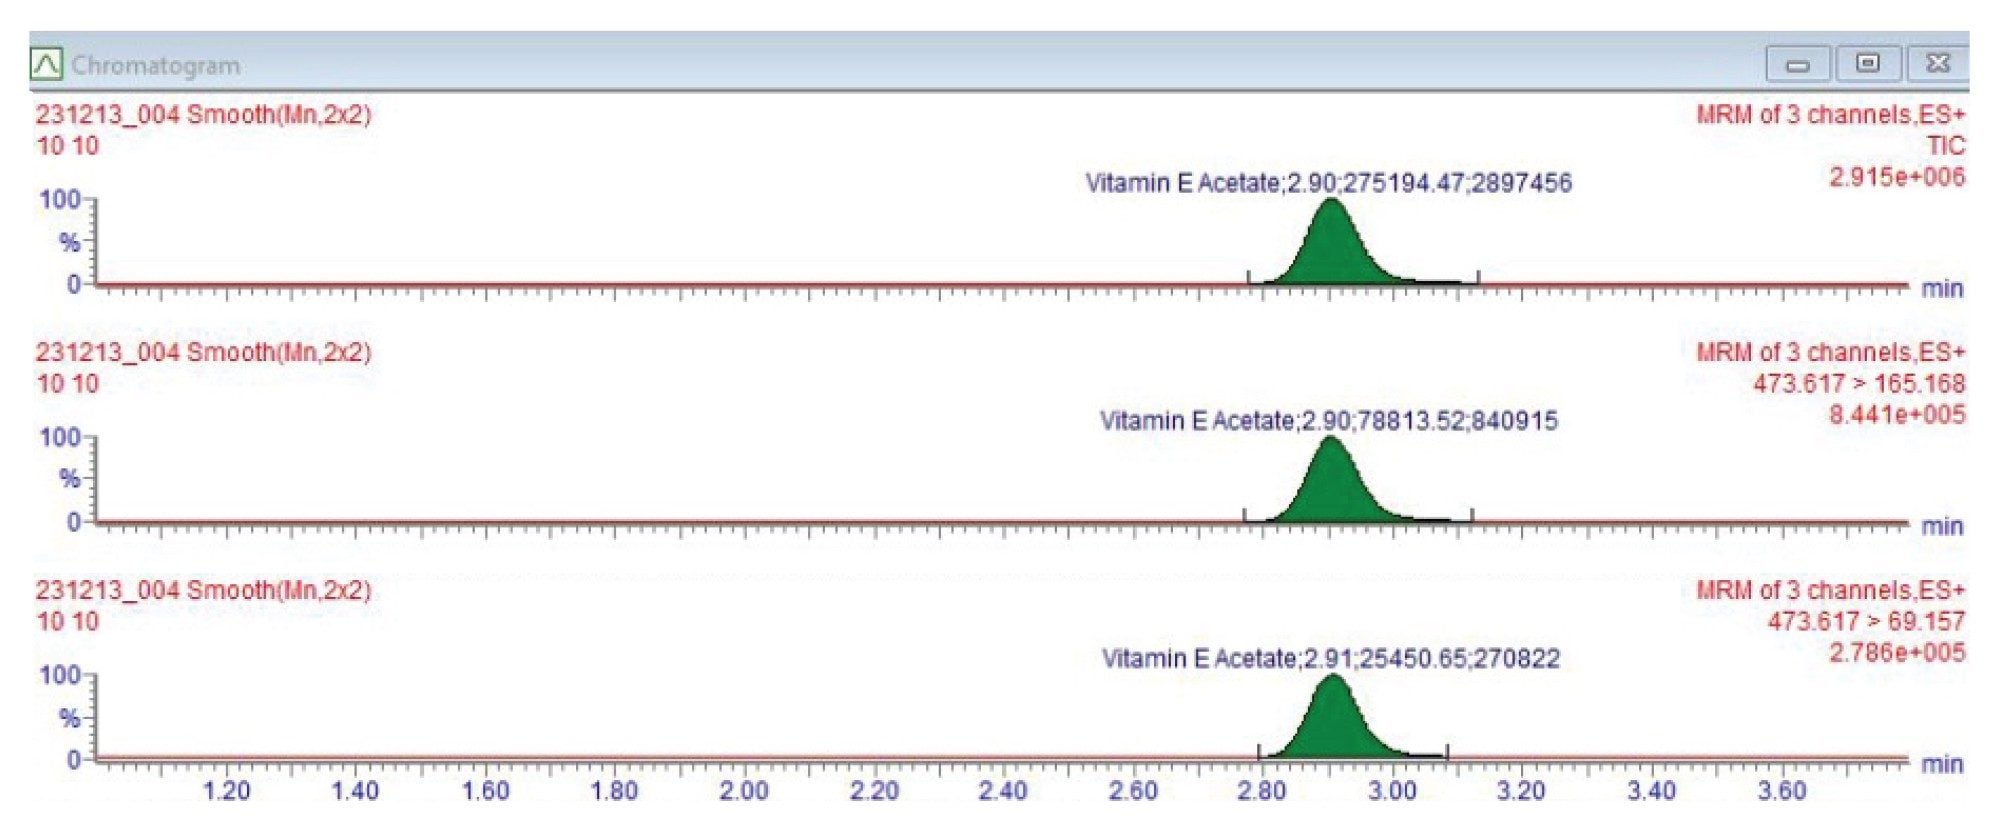
The method was developed and validated for quantitative and qualitative screening of VEA in cannabis products using UPLC-MS/MS. Figure 1 shows the chemical structure, formula, and molar mass for VEA. The solvent standard of VEA was optimized using Intellistart™ Fluidics to obtain two MRM transitions, one for quantification and the other for confirmation. The chromatographic retention time of VEA (RT 2.90 minutes) was obtained in solvent standard at 100 ppb as shown in Figure 2.
Method selectivity was evaluated by calculating the standard deviation of retention times from ten replicate injections of a 25 ppb solvent standard. The retention times yielded a mean of 2.887 minutes with a standard deviation of 0.015 minutes, corresponding to a range of 2.872–2.902 minutes.
Lab Quality Control (QC) Verification
Laboratory quality control procedures are essential for the validation and routine application of LC-MS/MS methods. Incorporation of method blanks (MB), ICV standards, and CCV checks within each analytical sequence provides assurance that the method is performed within established acceptance criteria. These controls help detect potential sources of error such as carryover, matrix interferences, or instrument drift, thereby maintaining the accuracy, precision, and reproducibility of the assay. The QC samples also contain the preparation blanks, matrix spikes, and sample duplicates in the analytical sequence.
In this study, each analytical sequence began with a method blank followed by an ICV. After every set of 20 samples, a CCV and an additional method blank were analyzed. This sequence was repeated in the same pattern for the duration of the batch, as required by the batch size.
For batch acceptance criteria, QC samples were required to be within ±30% of their designated concentrations. MB were evaluated to confirm that carryover remained below the LOQ. The accuracy and stability of calibration standards were verified using ICV and CCV samples, which were expected to demonstrate recoveries within the range of 70–130%.
Method Verification and Validation
A verification study was carried out in three phases. Linearity and calibration range were established in the first phase through correlation coefficients (R²), LOD, LOQ, and measurement uncertainty values. These values are compared against the acceptance criteria set by DHSS.
Accuracy and precision of the method were evaluated in the second phase by matrix spiked replicates across representative matrix classes, and the results were evaluated and compared with acceptance criteria set by DHSS.
In third phase, robustness was performed by different laboratory personnel and verified through LQC results and unknown samples. Results were evaluated and compared with acceptance criteria set by DHSS.
The acceptance criteria per DHSS:
1) The calibration curves should be generated from a minimum of five calibration points with the correlation coefficient (R²) ≥ 0.990.
2) Experimentally derived LOD and LOQ values for each analyte should be based on minimum seven replicates and should be below Missouri state regulatory limits (5 ppm).
3) Accuracy and precision are measured by % recovery and should be within 70% to 130% for QC standards as well as for matrix (spiked).
4) Also, QC samples should be ±30% recovery on all matrix spiked recovery QC, ICV, and CCV samples.
5) QC replicates should be less than or equal to 30% relative percent difference (RPD).
6) All blank, QC, preparation blanks, and calibration blanks should be less than or equals to LOQ.
Linearity and Calibration Range (Phase 1)
Calibration curves ranging from 10 to 400 ppb were prepared as described in the preparation of standards. The regression analysis yielded an R² value greater than 0.9997 using linear regression with a 1/X weighting across the full range (see Figure 3), meeting the acceptance criteria. The deviations for all calibration levels were within 6%.
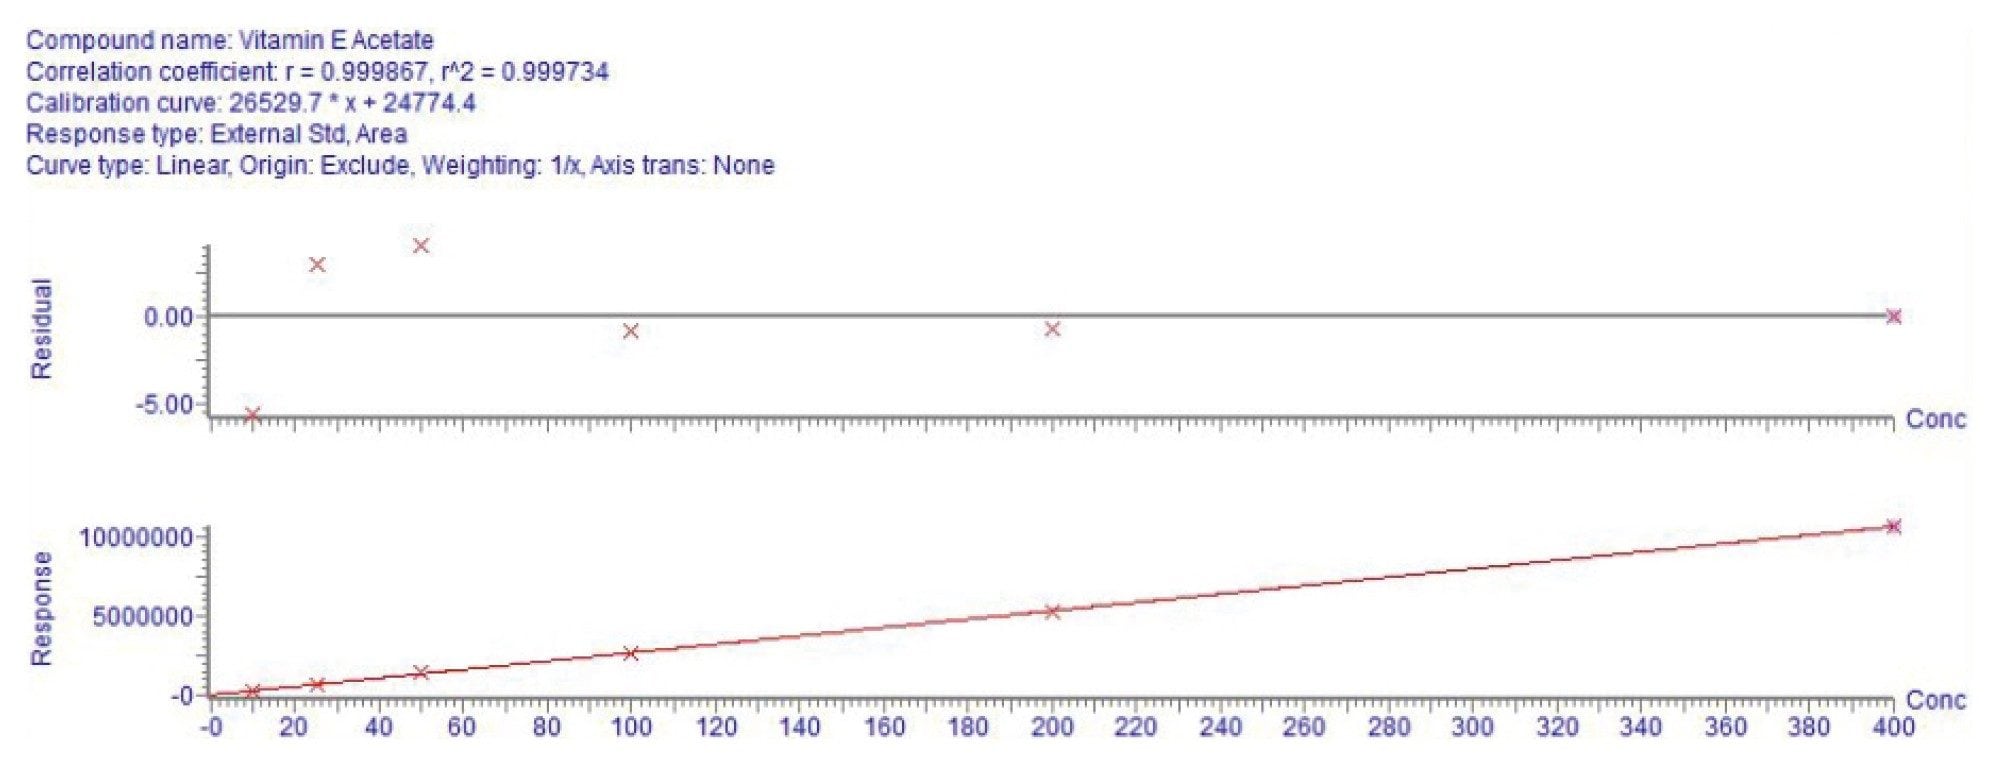
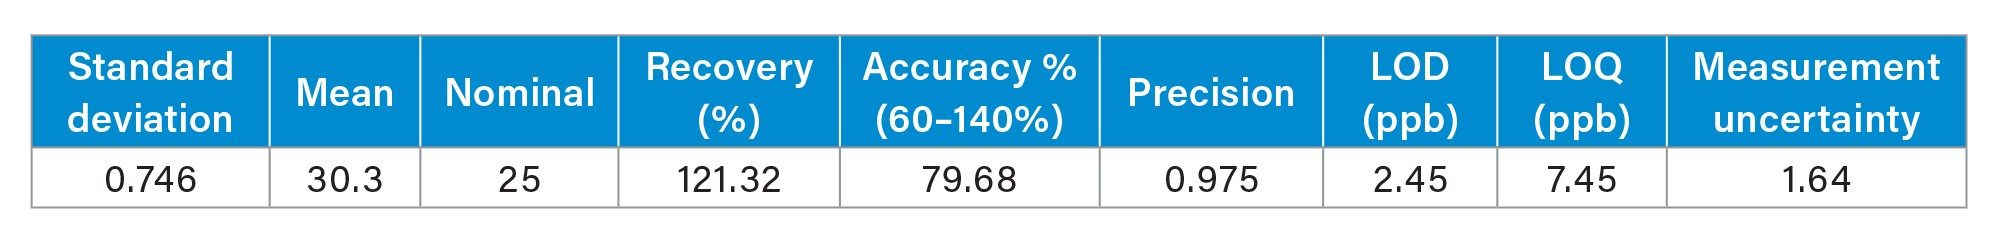
For the evaluation of LOD and LOQ, ten replicates of the 25 ppb solvent standard were injected and results are reported in Table 3. LOD and LOQ were determined using the formula below.
LOD = 3.3 X standard deviation (n=10 injections)
LOQ = 10 X standard deviation (n=10 injections)
Accuracy and Precision (Phase 2)
Accuracy and precision were also calculated from ten replicates of the 25 ppb solvent standard. The following formulas were applied for calculations and results are outlined in Table 3.
Recovery = 100 x [Mean value)/Nominal value)
Accuracy = 100% - Error rate
Error rate = 100 x [| (Nominal value -Mean value) |/Nominal value)]
Precision = [1- (standard deviation/Mean value)]
Measurement uncertainty = k* standard deviation, k = 2.2
Recovery
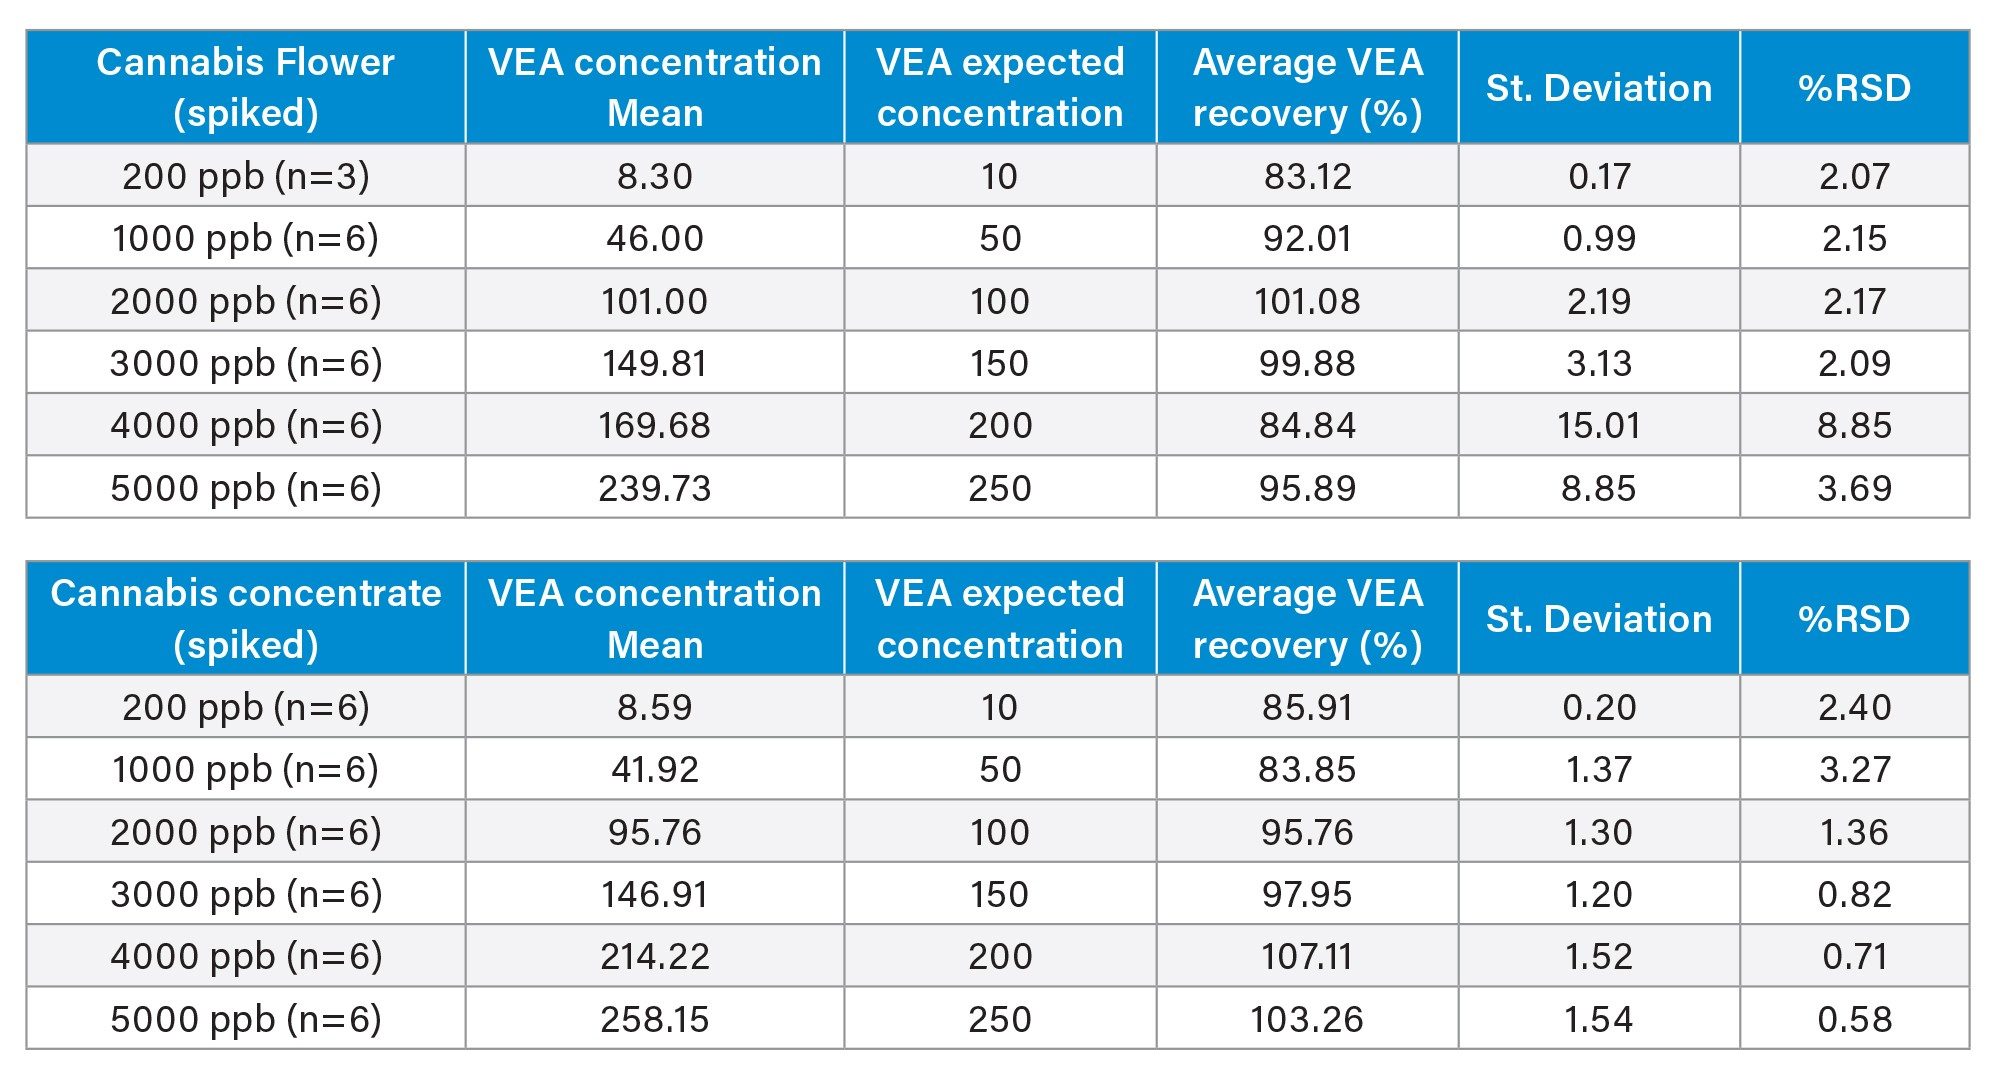
Method recovery was evaluated for cannabis flower and cannabis concentrate. Whenever possible, the laboratory used CRM containing known analyte concentrations. In cases where CRM materials were not available, blank matrices were spiked with VEA for testing. Once a suitable blank matrix was identified, it was designated as the matrix blank (MB) and spiked to prepare the matrix-spiked (MS) sample. For this study, neat hemp was used in place of cannabis flower for spiking. The expected concentration of each matrix-spiked sample was calculated based on the sample extraction procedure outlined in the SOP, by multiplying the spike volume by the spike concentration. A spike volume of 1 mL was consistently applied, with 20 mL used for extraction/dilution.
Formula:
Matrix spike at Instrument/ Concexpected = (Vspike) x (Concspike)/(Vextract)
For example: 250 ppb/mL = 1mL*5000 ppb/20 mL
As noted previously, the Missouri DCR revised the action limit for VEA from 0.2 ppm to 5 ppm. To evaluate recovery, cannabis flower and concentrate matrices were spiked at multiple levels to demonstrate accurate quantitation of VEA below the current action limit.
Table 4 summarizes the spike data for each level and matrix. The acceptance criterion for recovery was 70–130% of the spiked concentration. All spiked samples met this criterion, with recoveries ranging between 83% and 108% of the target value.
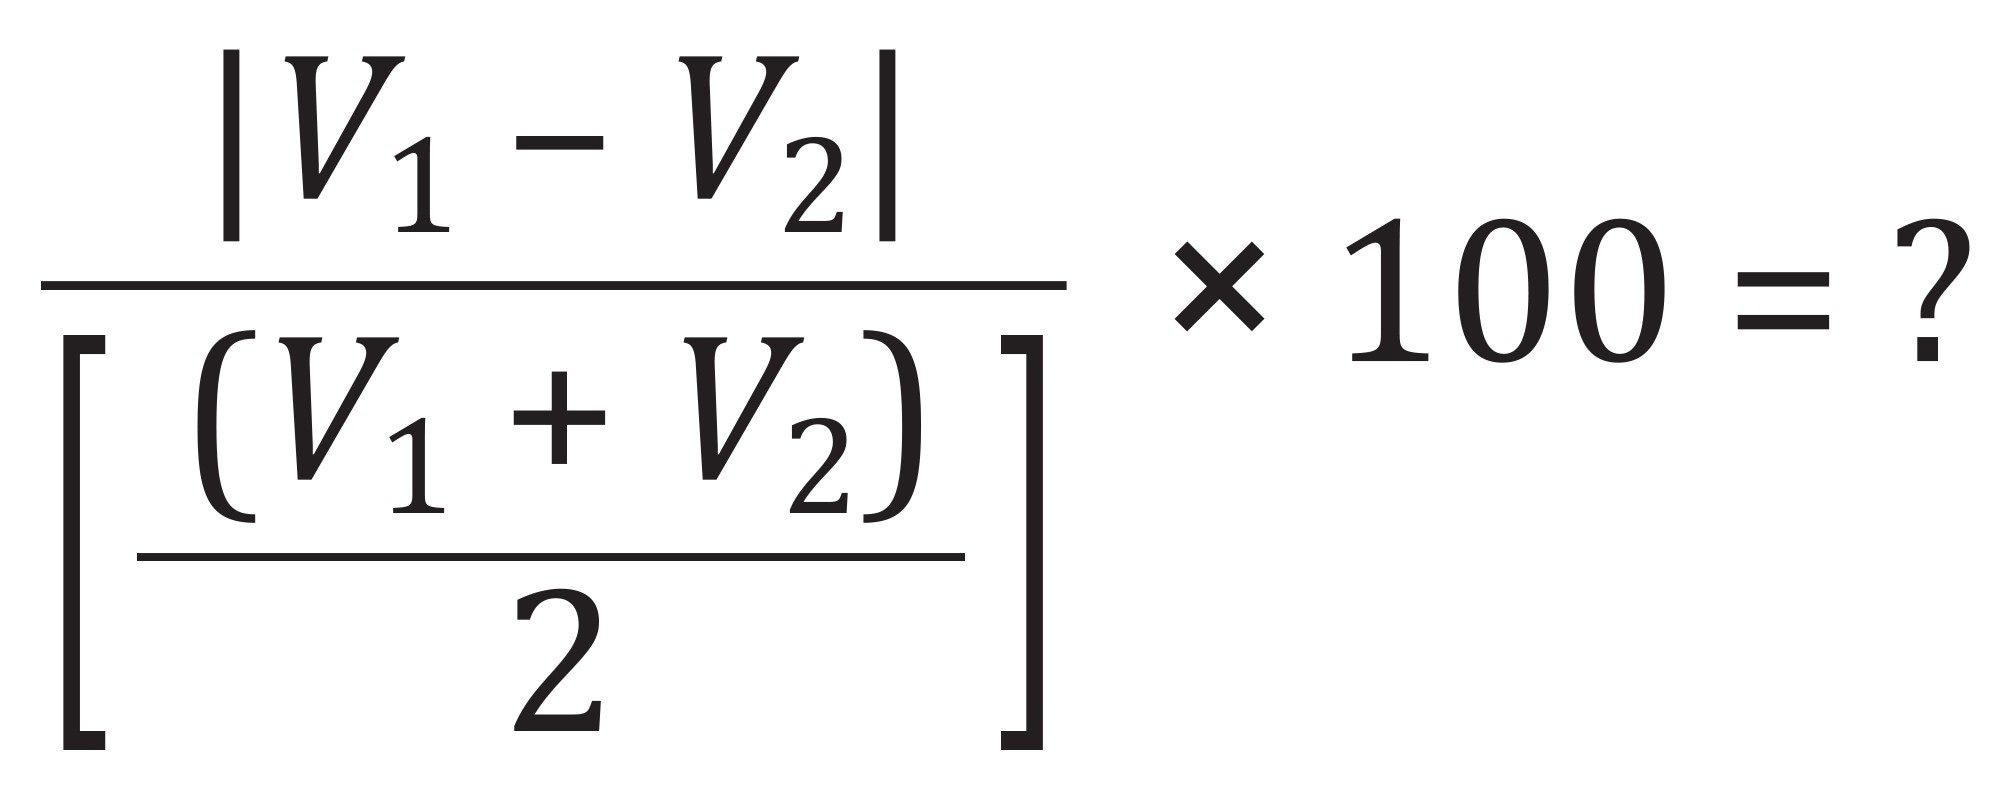
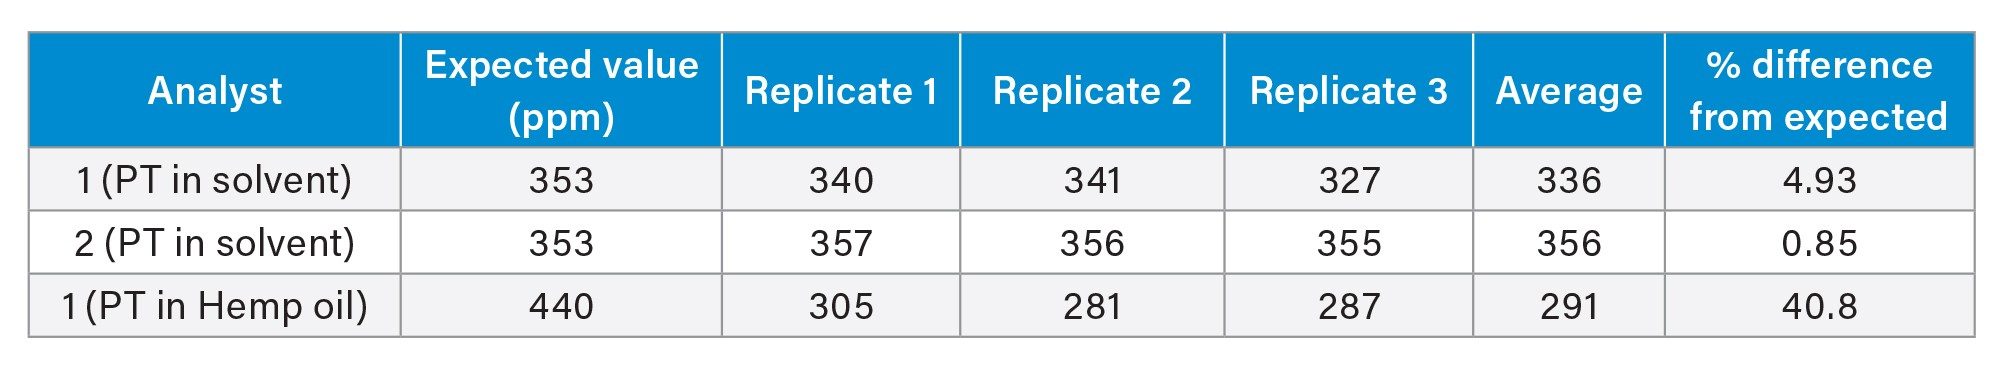
Robustness (Phase 3) and Repeatability
To assess method robustness, an analytical batch including a full LQC calibration curve, ICV, CCV, preparation blank, and proficiency testing (PT) samples (solvent and hemp oil) were prepared independently by two analysts, and the results were evaluated. Due to limited sample availability, only Analyst 1 performed the study with hemp oil. The results from both analysts are summarized in Table 5 and were consistent with the established acceptance criteria, demonstrating the robustness of the method. The % difference was calculated using the formula below.
Conclusion
The LC-MS/MS method developed and validated for VEA quantification in cannabis flower and concentrates demonstrates excellent linearity, accuracy, precision, and robustness, and meets the regulatory requirements.
Calibration curves achieved R² values greater than 0.999, with LOD and LOQ well below the Missouri action limit of 5 ppm. Matrix-spiked recoveries across flower and concentrate samples were within the 70–130% acceptance range, and QC samples met all performance criteria, confirming method reliability. Robustness testing across analysts and matrices further validated the method’s reproducibility.
Overall, this approach provides a streamlined, sensitive, and regulatory-compliant workflow for laboratories, enabling accurate monitoring of VEA to support quality control, consumer safety, and regulatory compliance in cannabis-derived products.
Acknowledgment
This validation study was carried out by Green Precision Analytics (GPA), who performed all experimental work and data generation.
References
- Missouri Department of Health and Senior Services https://health.mo.gov/safety/cannabis/pdf/vitamin-e-waiver-and-variance.pdf
720009082, November 2025