Analysis of Tricyclic Antidepressant Drugs in Plasma for Clinical Research
For research use only. Not for use in diagnostic procedures.
Abstract
Chromatography and mass detection provide analytical selectivity, allowing for the quantification of 15 TCAs across a broad spectrum of polarities. Additionally, the method involves rapid and cost-effective sample preparation, utilizing only a small sample volume.
Benefits
- Analytical selectivity afforded by chromatography and mass detection
- Quantification of 15 TCAs that span a wide range of polarities
- Quick and inexpensive sample preparation, utilizing a small volume of sample
Introduction
The quantitative analysis of tricyclic antidepressants in plasma, is vital in order to undertake pharmacokinetic studies and monitor therapy efficiently.1
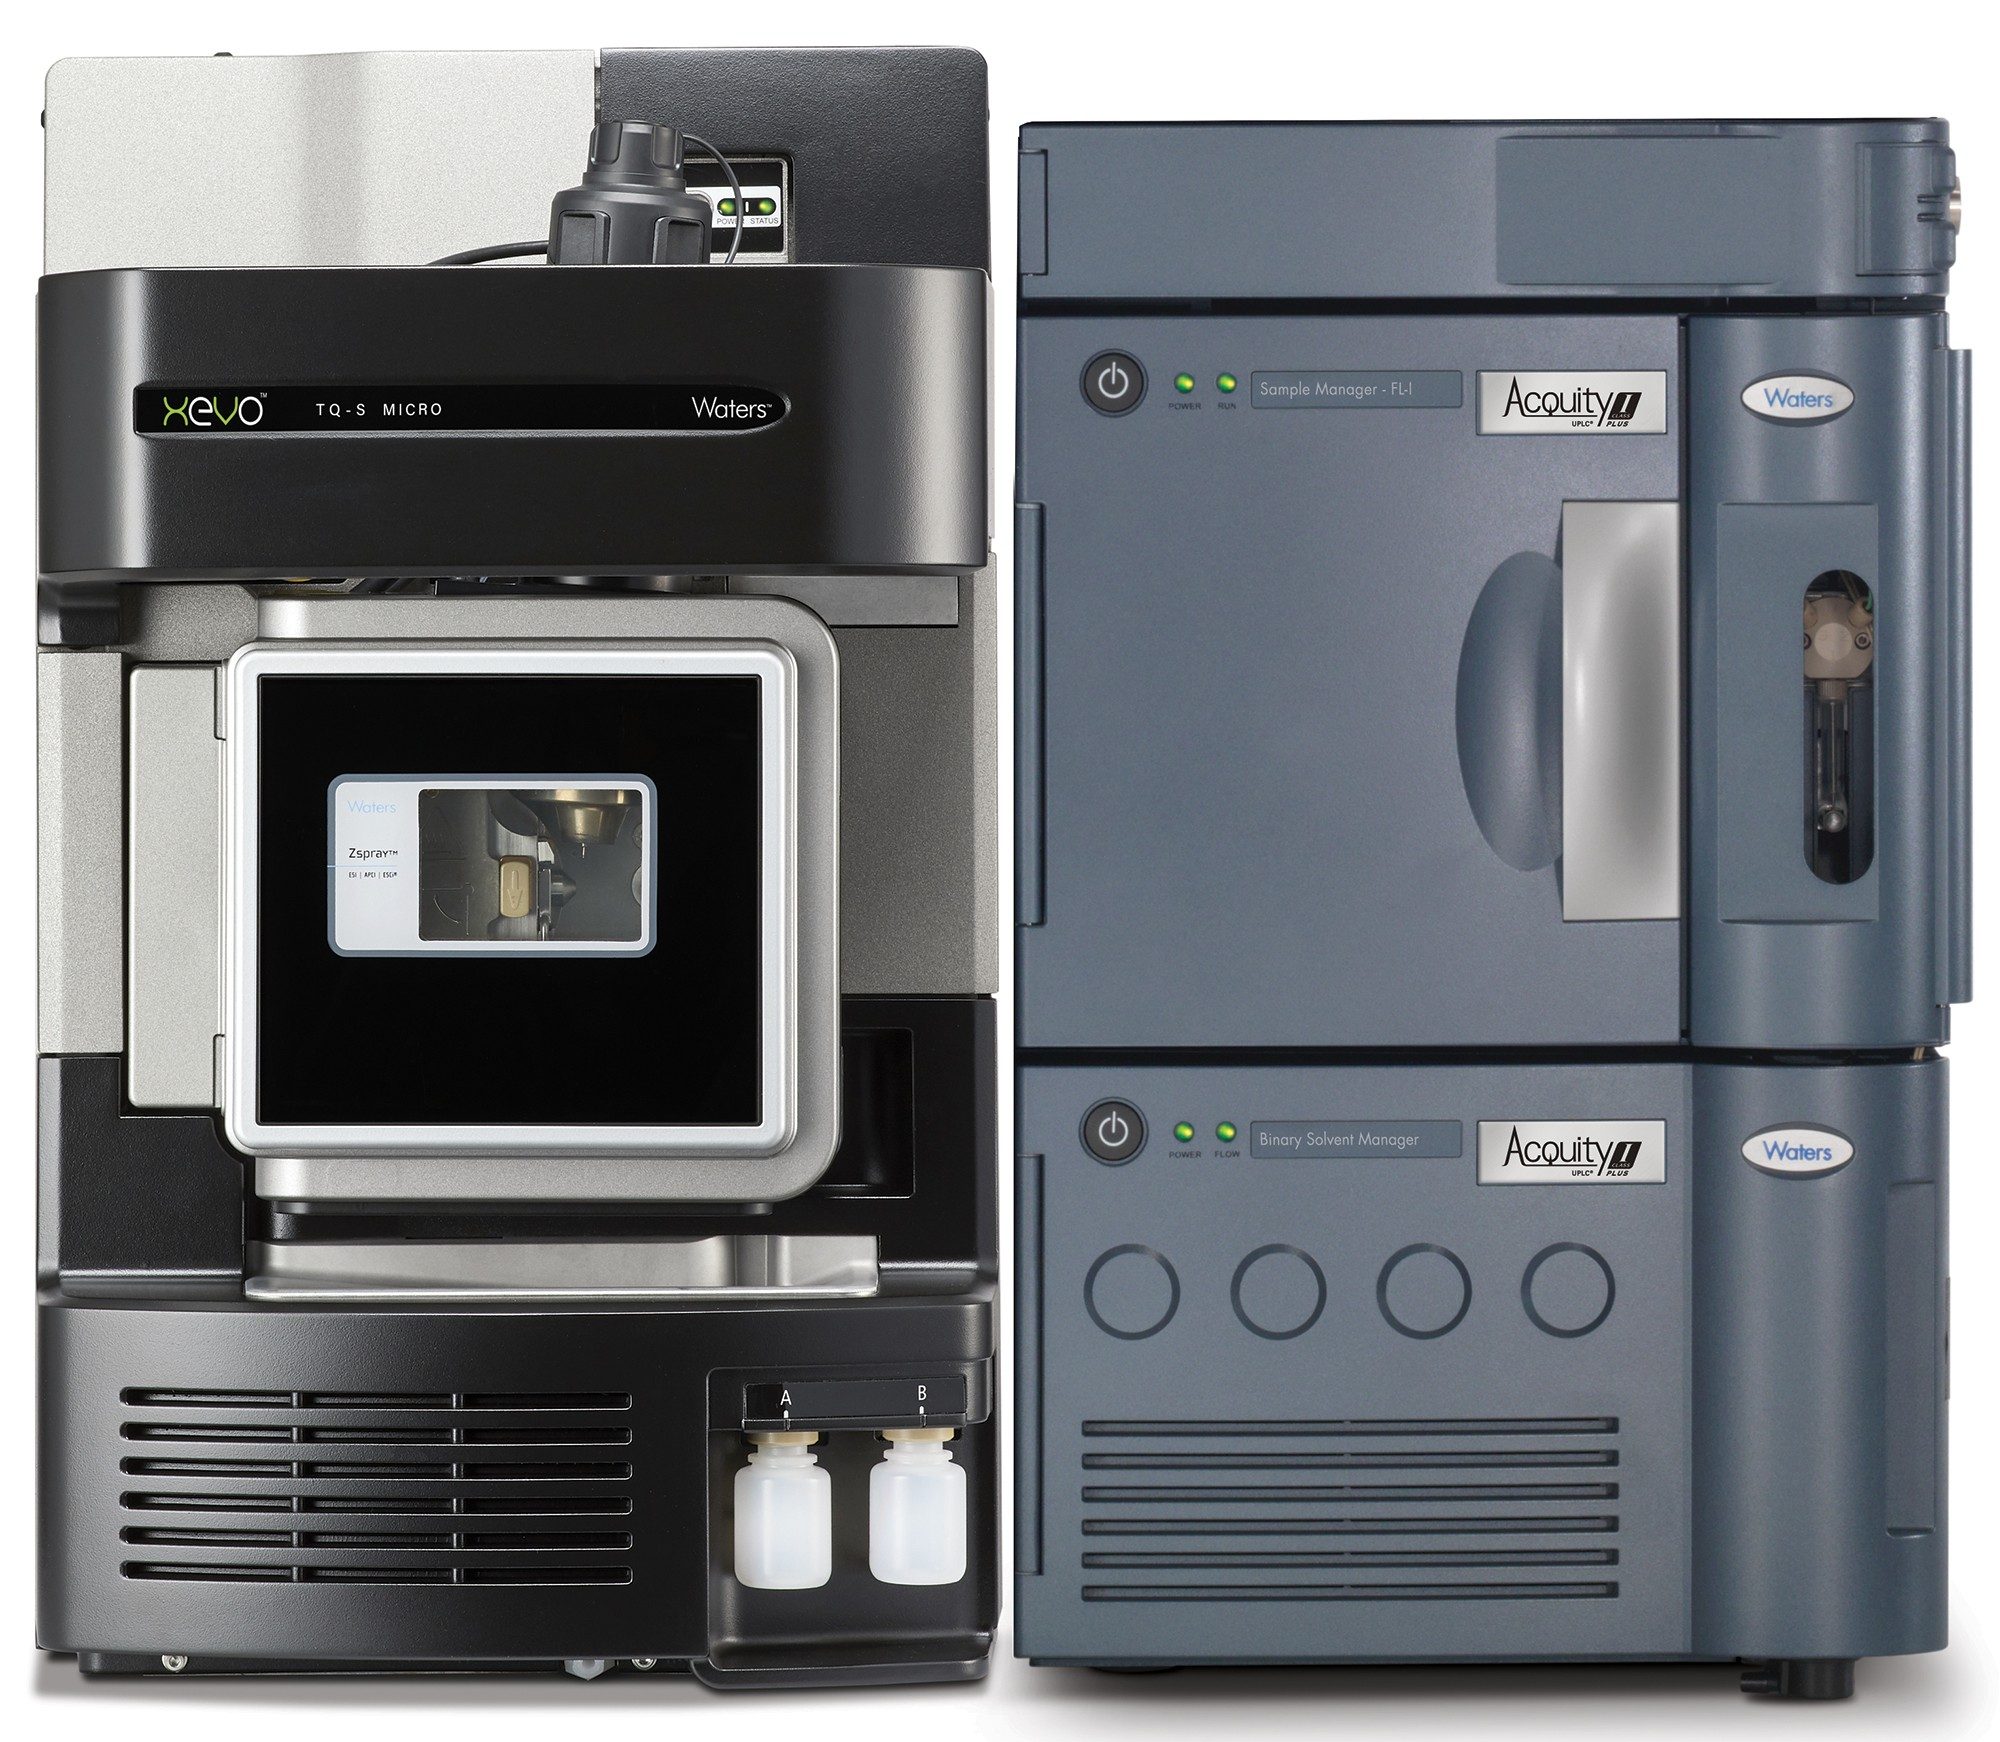
Here we describe a clinical research method utilizing protein precipitation for the extraction of 15 tricyclic antidepressants from plasma. Chromatographic separation was performed using an ACQUITY™ UPLC I-Class FL System, using a XSelect™ Premier HSS C18 Column (2.1 x 100 mm, 2.5 µm). The detector was a Xevo™ TQ-S micro Mass Spectrometer operating in positive electrospray ionization mode (Figure 1).
Experimental
Sample Preparation
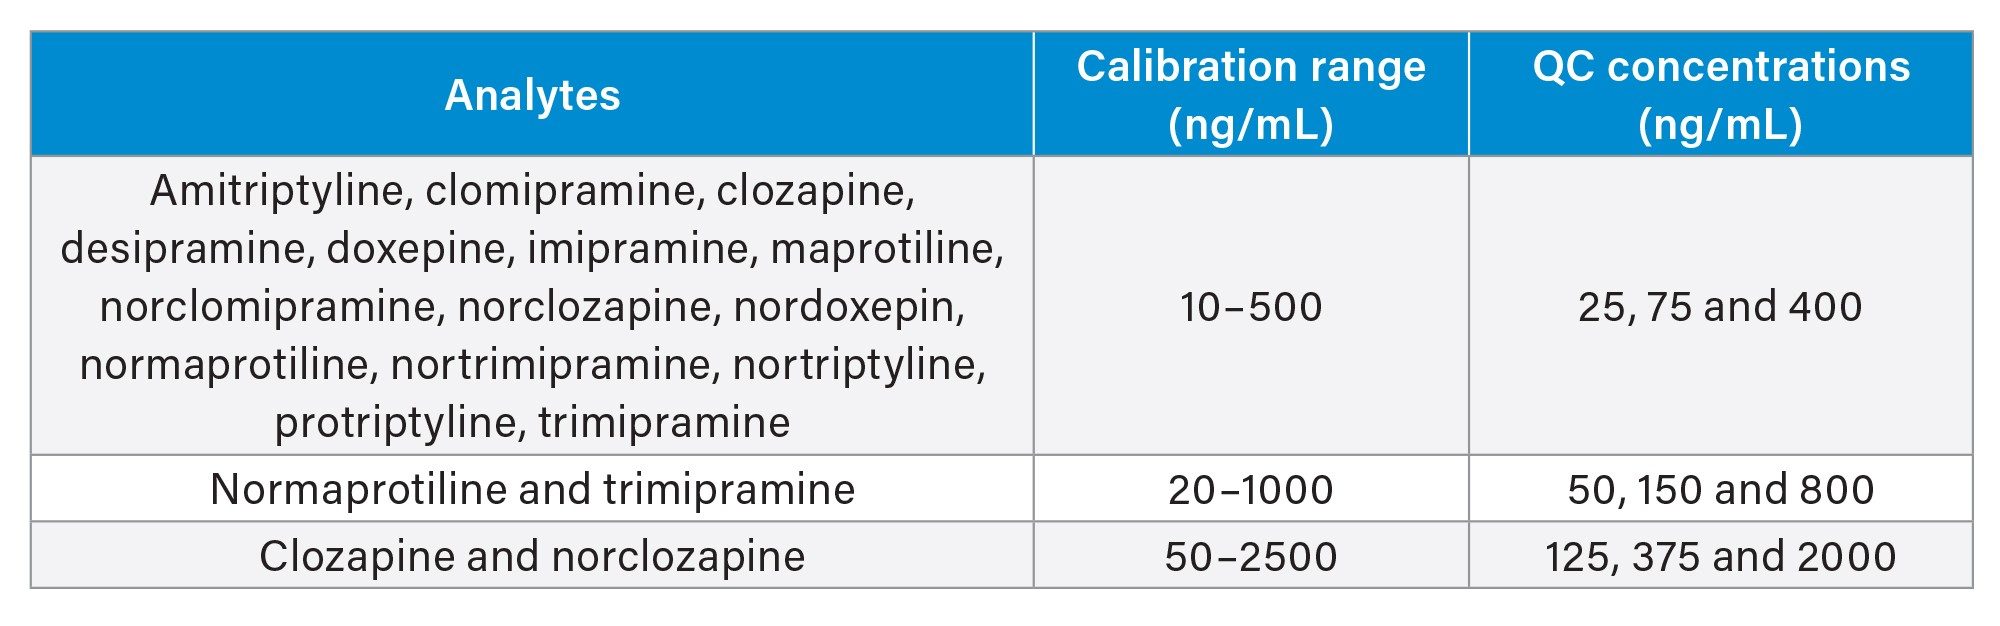
Plasma calibrators and quality control materials were prepared in house using pooled human plasma supplied by BioIVT (West Sussex, UK). Concentrated stock solutions were prepared from certified powders and solutions supplied by Cambridge Bioscience (Cambridgeshire, UK), Sigma-Aldrich (Dorset, UK) and Toronto Research Chemicals (Ontario, Canada). Stable labelled internal standards were supplied by ALSACHIM (Illkirch-Graffenstaden, France), Sigma-Aldrich (Dorset, UK) and Toronto Research Chemicals (Ontario, Canada). The calibration ranges and in-house quality control concentrations for the analytes are as shown in Table 1.
Sample Extraction
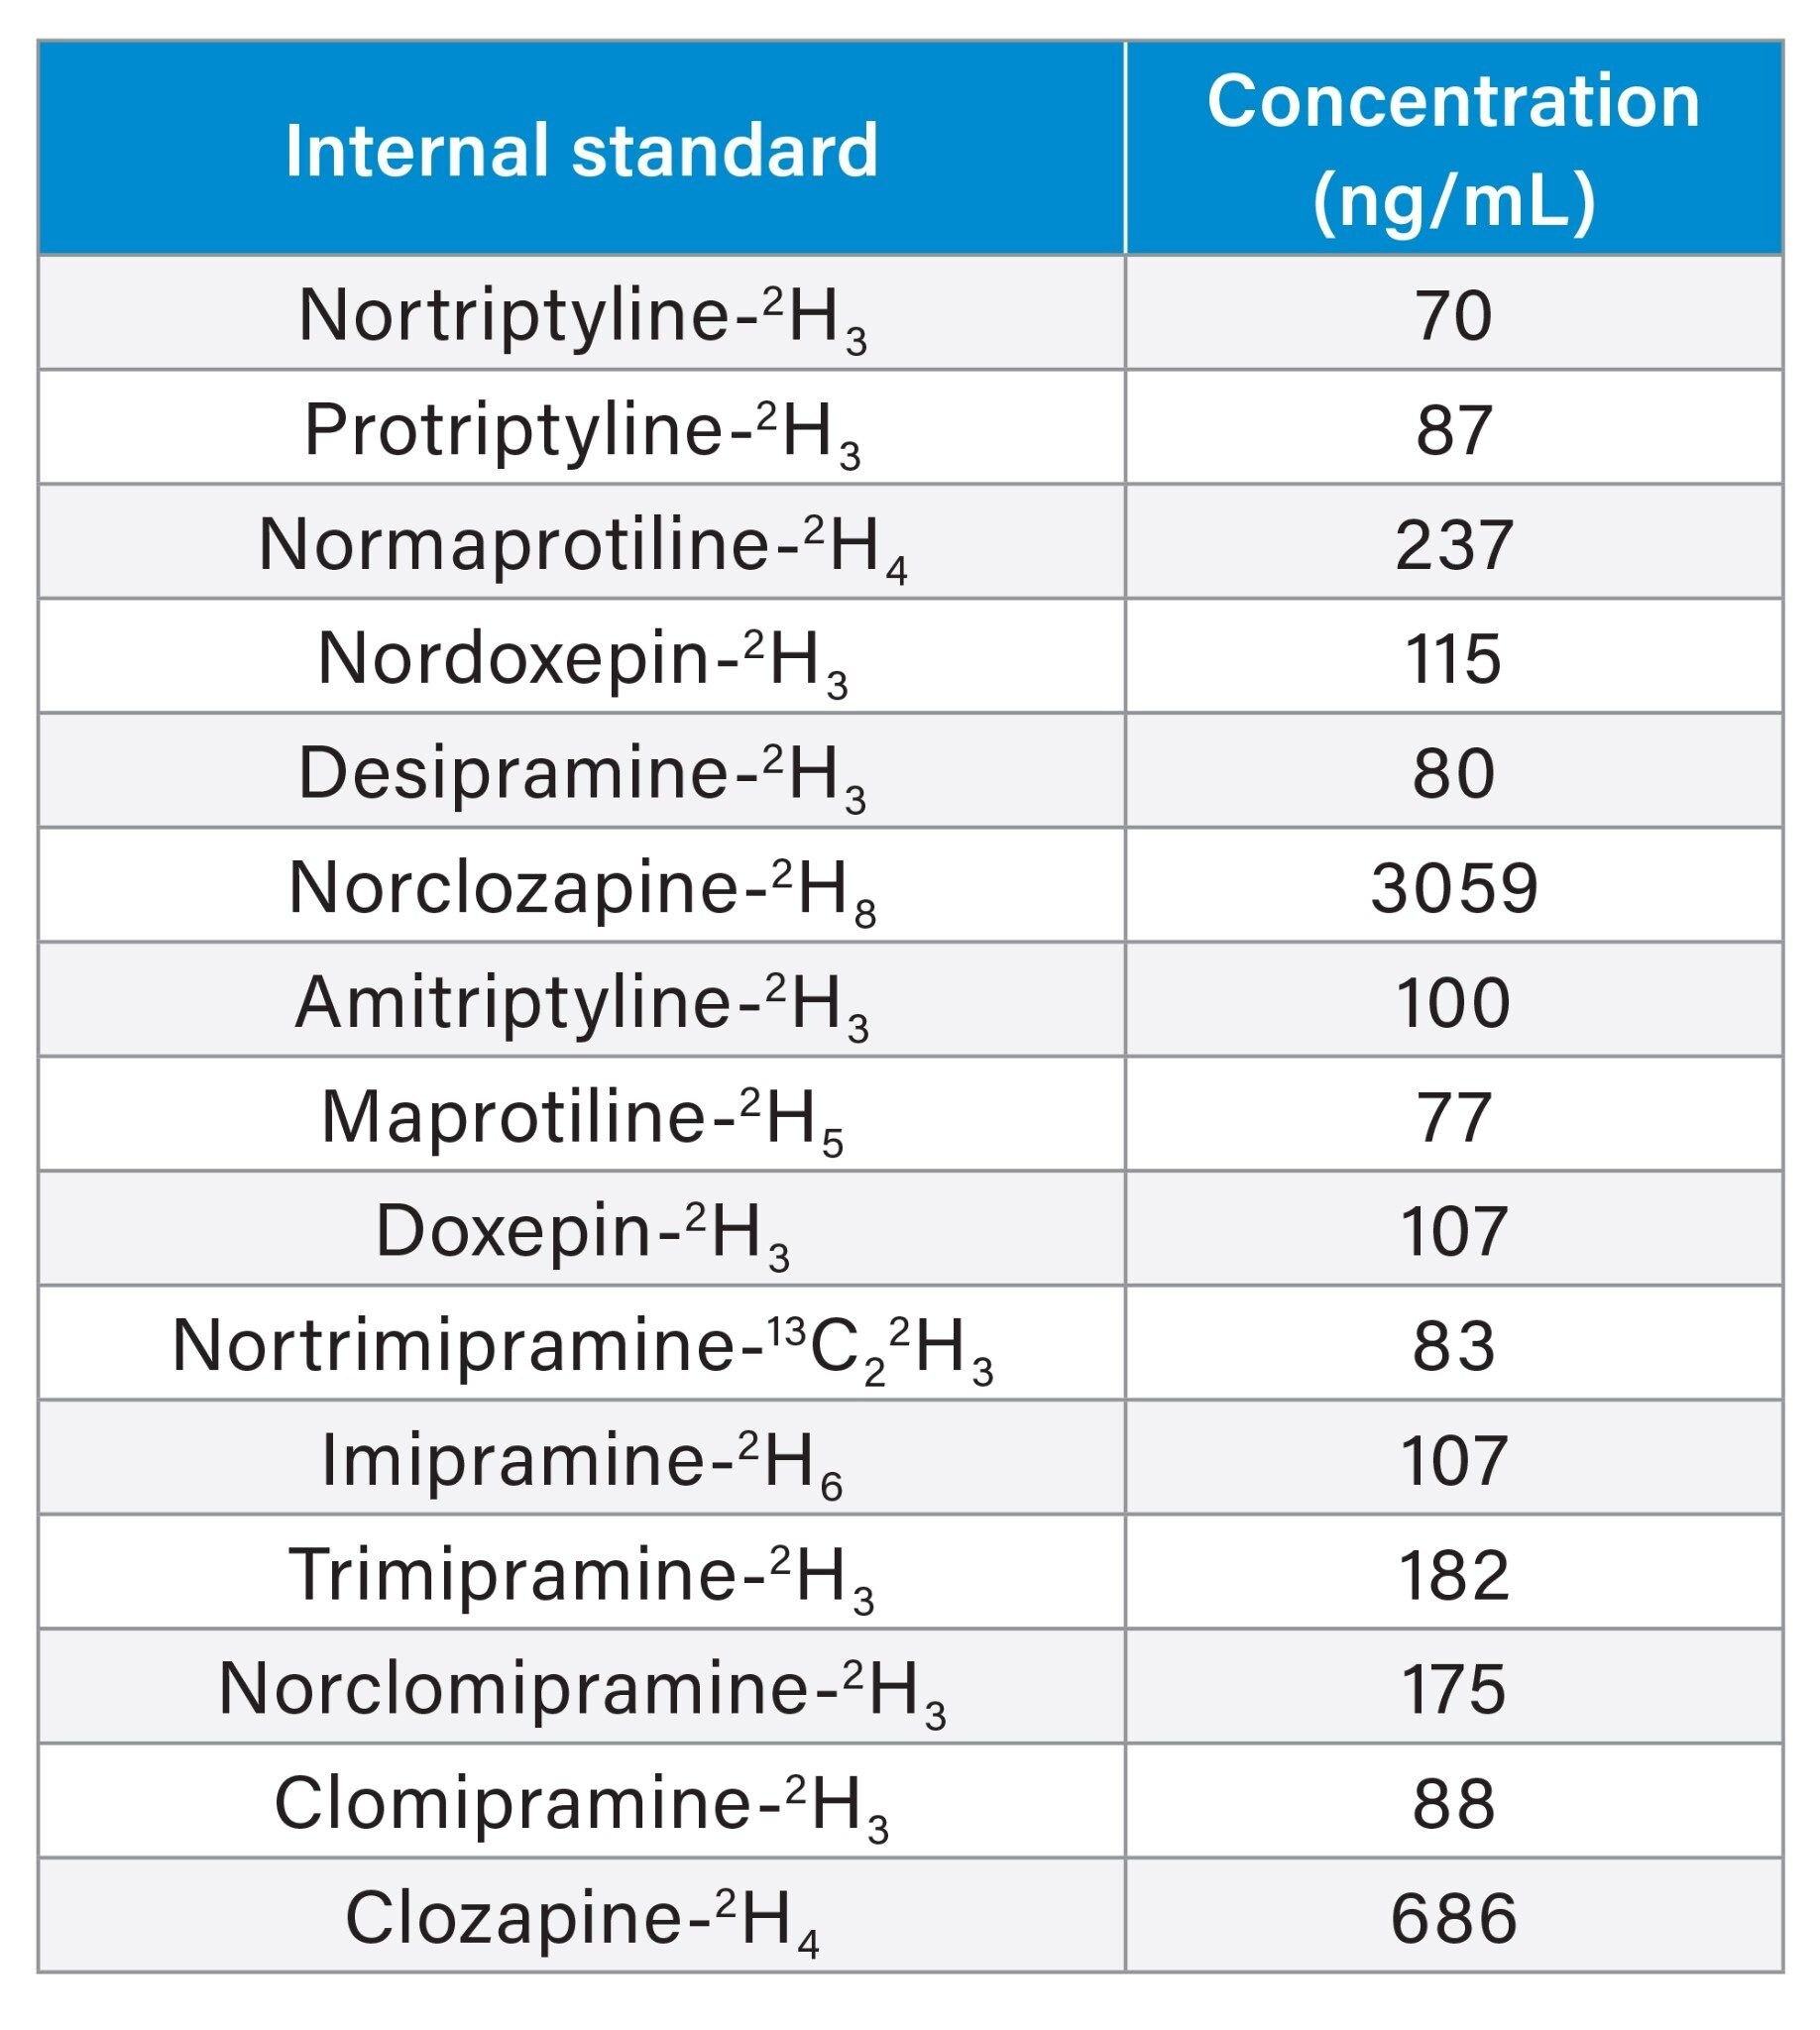
To a 50 µL of sample in a microcentrifuge tube, 150 µL of internal standard in acetonitrile was added. The concentrations of internal standards are detailed in Table 2.
Tubes were placed on a multi-tube vortex mixer at 1500 rpm for three minutes, then centrifuged for two minutes at 16, 100 g. 25 µL of supernatant was transferred to a 1 mL 96 well plate and 475 µL water added. The plate was capped and vortexed for two minutes at 1500 rpm prior to analysis.
UPLC Conditions
|
System: |
ACQUITY UPLC I-Class FL System |
|
Needle: |
30 µL |
|
Column: |
XSelect Premier HSS T3 Column; 2.5 µm, 2.1 x 100 mm (p/n: 186009831) |
|
Mobile phase A: |
Water + 5 mM ammonium formate + 0.1% formic acid |
|
Mobile phase B: |
Methanol + 5 mM ammonium formate + 0.1% formic acid |
|
Needle wash solvent: |
80% aqueous methanol + 0.1% formic acid |
|
Purge solvent: |
Water: Methanol 40:60 v:v |
|
Seal wash: |
20% aqueous methanol |
|
Column temperature: |
45 °C (precolumn heater active) |
|
Injection volume: |
20 µL |
Gradient Table
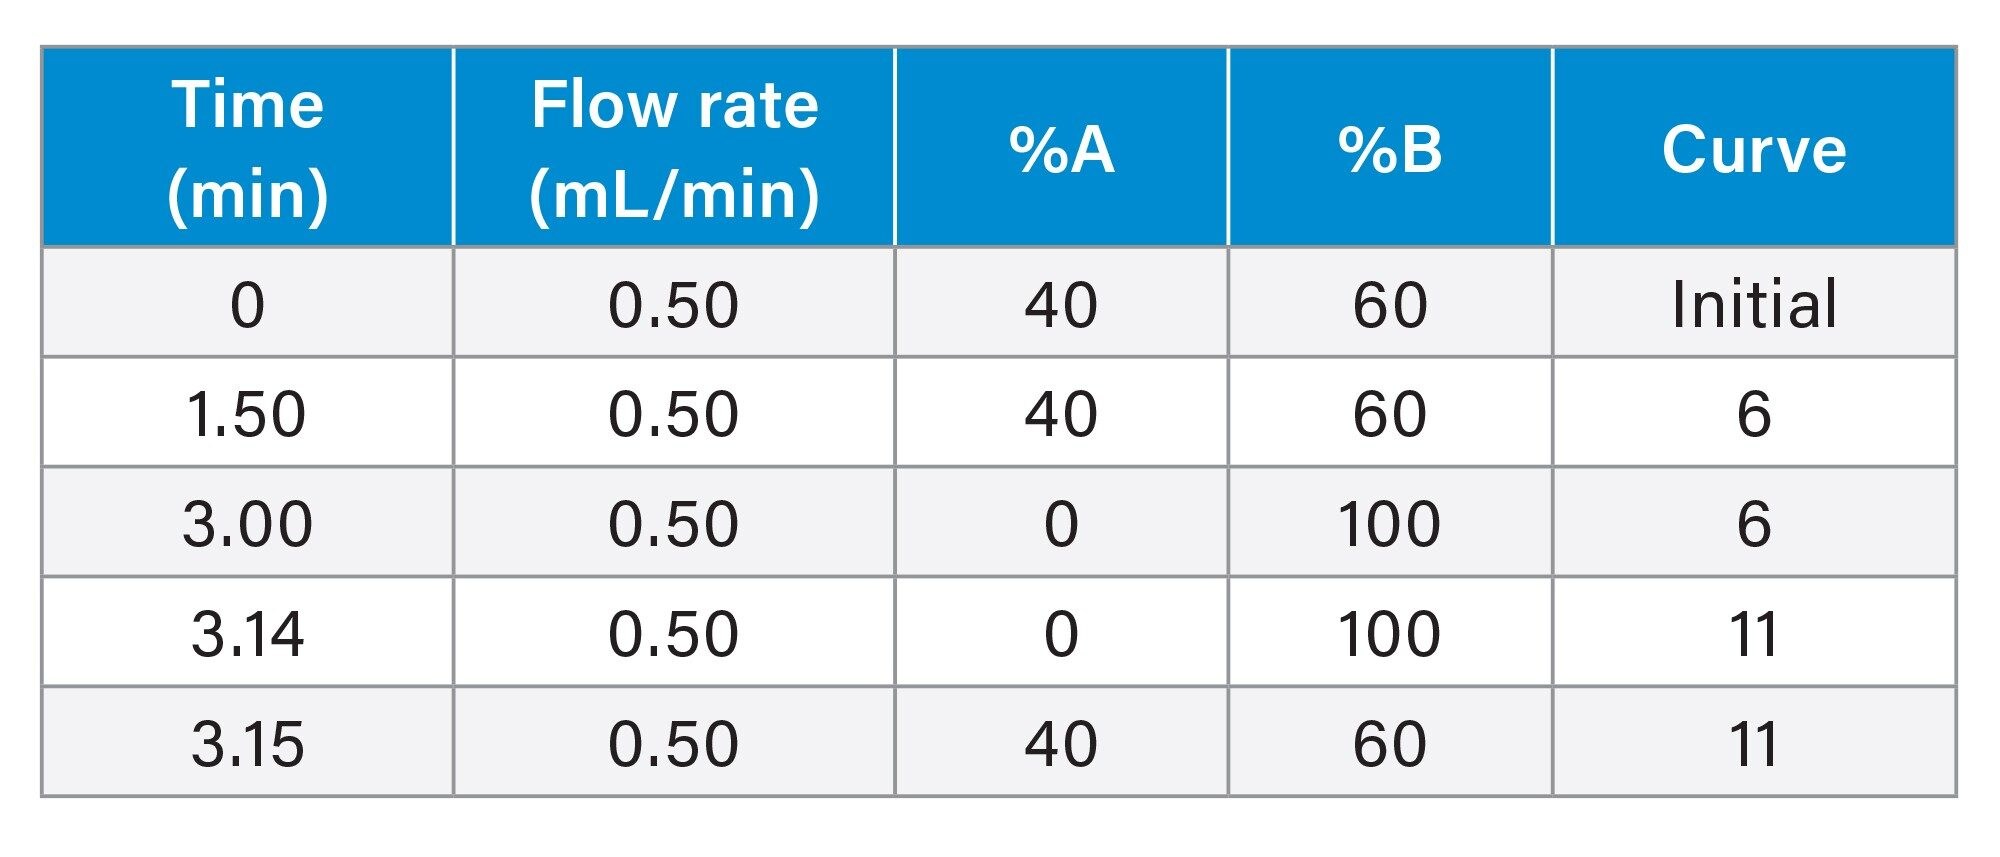
Run time: 4.0 minutes (4.5 minutes injection-to-injection)
MS Conditions
|
System: |
Xevo TQ-S micro |
|
Resolution: |
MS1 (0.7 FWHM) MS2 (0.7 FWHM) |
|
Acquisition mode: |
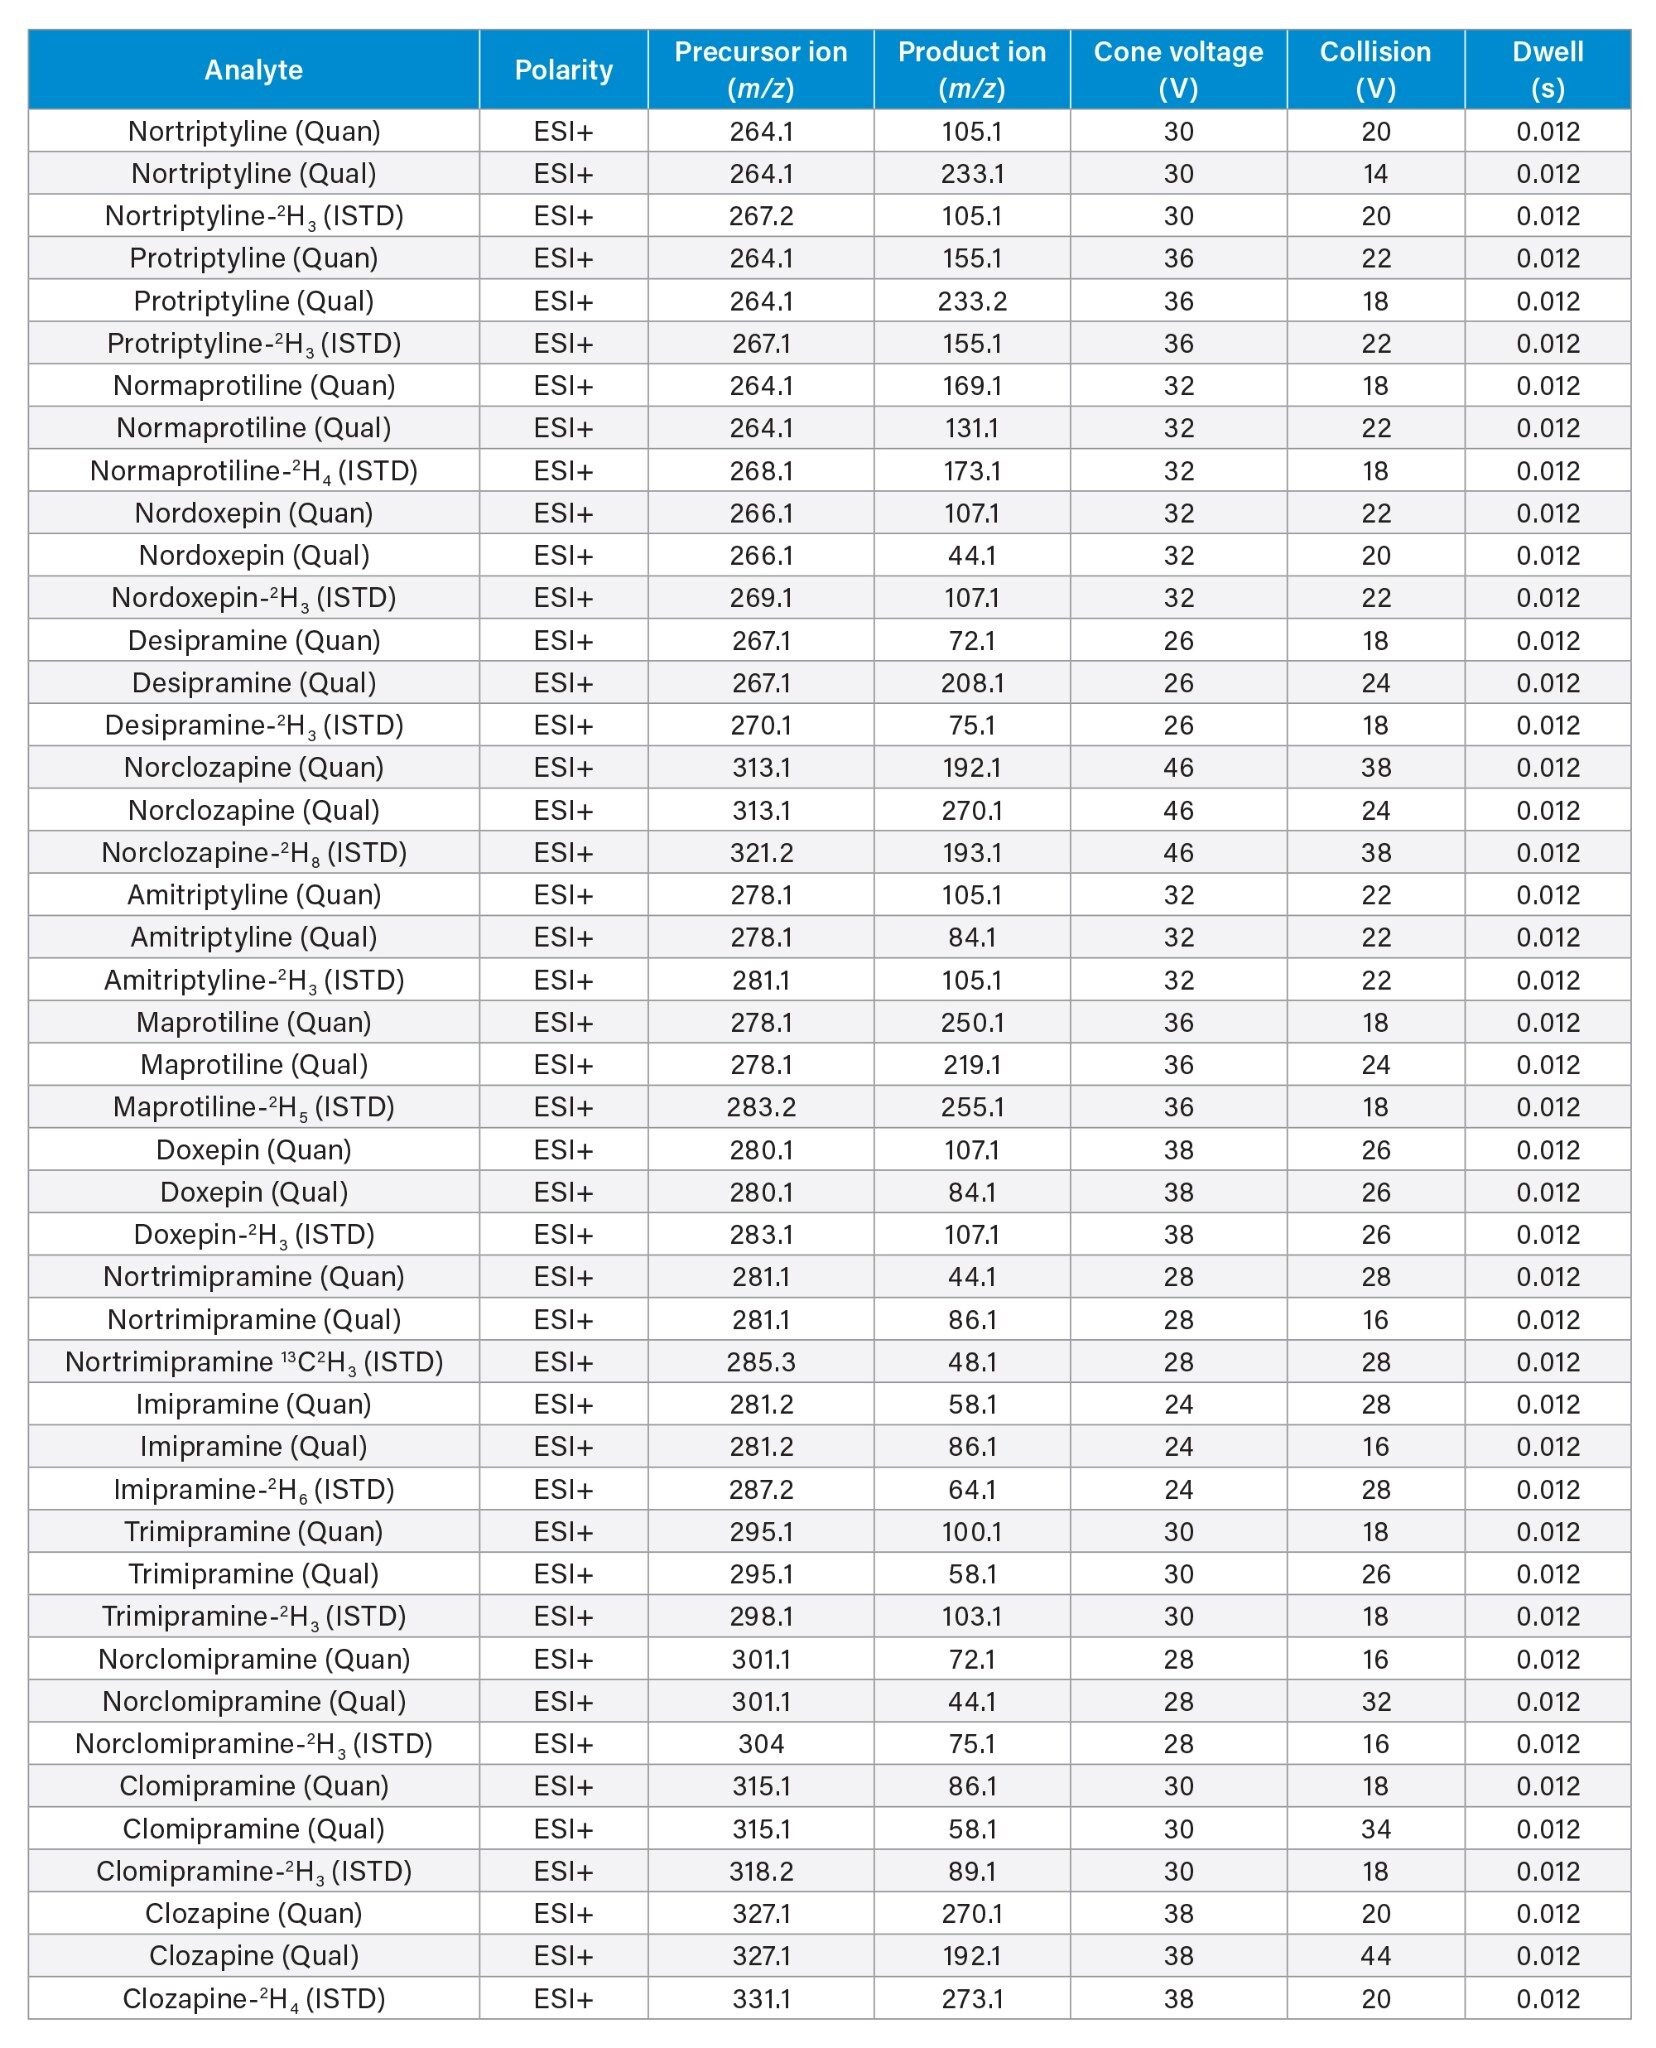
Multiple Reaction Monitoring (MRM) (see Table 3 for details) |
|
Polarity: |
ESI + ionization |
|
Capillary: |
0.5 kV |
|
Source temperature: |
150 °C |
|
Desolvation temperature: |
600 °C |
|
Cone gas: |
150 L/hr |
|
Desolvation gas flow: |
1000 L/hr |
|
Inter-scan delay: |
automatic |
|
Polarity/Mode switch inter-scan delay: |
0.020 seconds |
|
Inter-channel delay: |
automatic |
Data Management
|
Chromatography software: |
MassLynx™ v4.2 with TargetLynx™ Application Manager. |
Results and Discussion
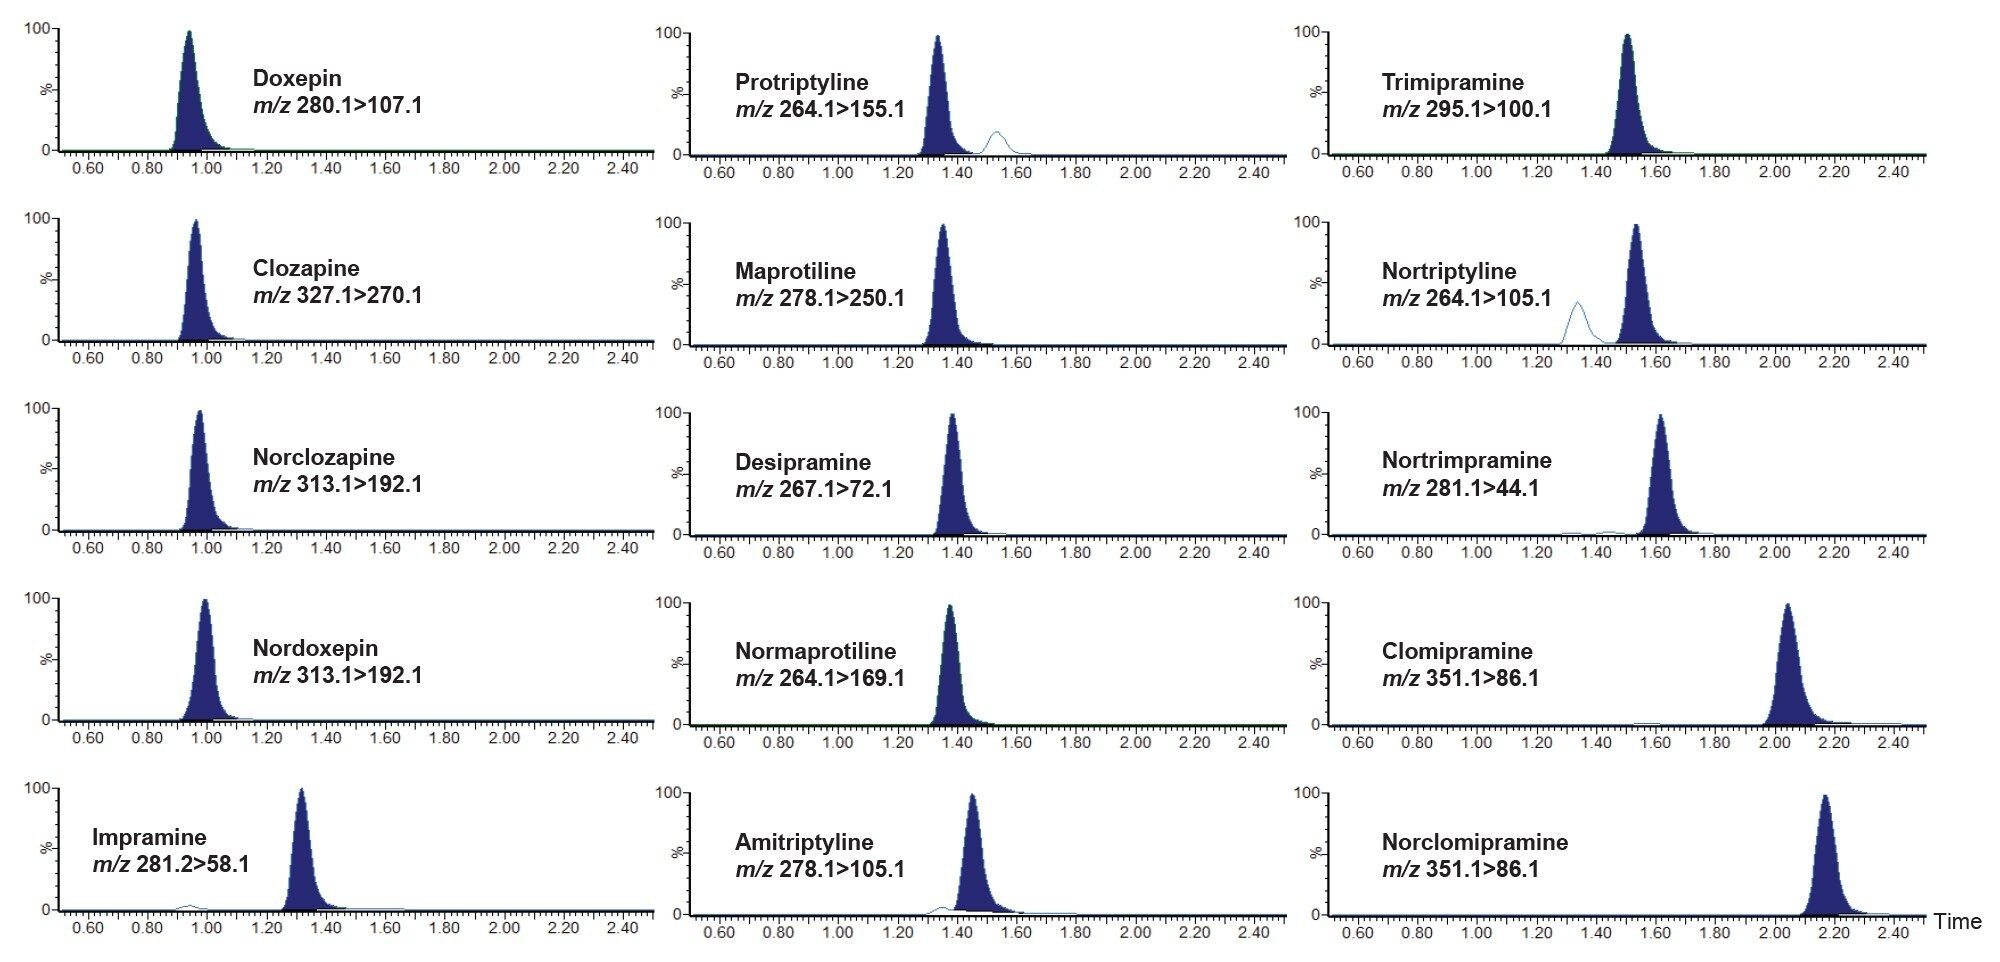
Chromatographic separation was achieved for isobaric compounds (nortriptyline and protriptyline) and interfering qualifier transitions (281.2>86.1) of imipramine and nortrimipramine. This ensured selective quantification of these analytes. An example chromatogram is shown in Figure 2 of a pooled plasma mid-level calibrator sample.
There was no significant carryover observed from high concentration plasma sample into subsequent blank injection. The high concentration sample contained 500 ng/mL of amitriptyline, clomipramine desipramine doxepin, imipramine, maprotiline norclomipramine, nordoxepin, nortrimipramine, nortriptyline, and protriptyline, 1000 ng/mL of normaprotiline, and trimipramine, and 2500 ng/mL of clozapine, and norclozapine. A dilution of 1:5 of the high concentration sample was performed that gave a mean % bias of < 10% for all analytes.
No significant interference was observed when the TCAs were analysed with endogenous compounds (albumin, bilirubin, cholesterol, creatinine, triglycerides, and uric acid) spiked at low and high concentrations. This was assessed by determining the recovery (n=3) from low and high pooled plasma samples at low (QC1) and high (QC3) concentrations. The recoveries for the low and high pools were within 15%, except for amitriptyline, clomipramine, clozapine, imipramine, norclomipramine, nortriptyline, protriptyline, and trimipramine which exhibited some interference (17%) from triglycerides at low concentration samples.
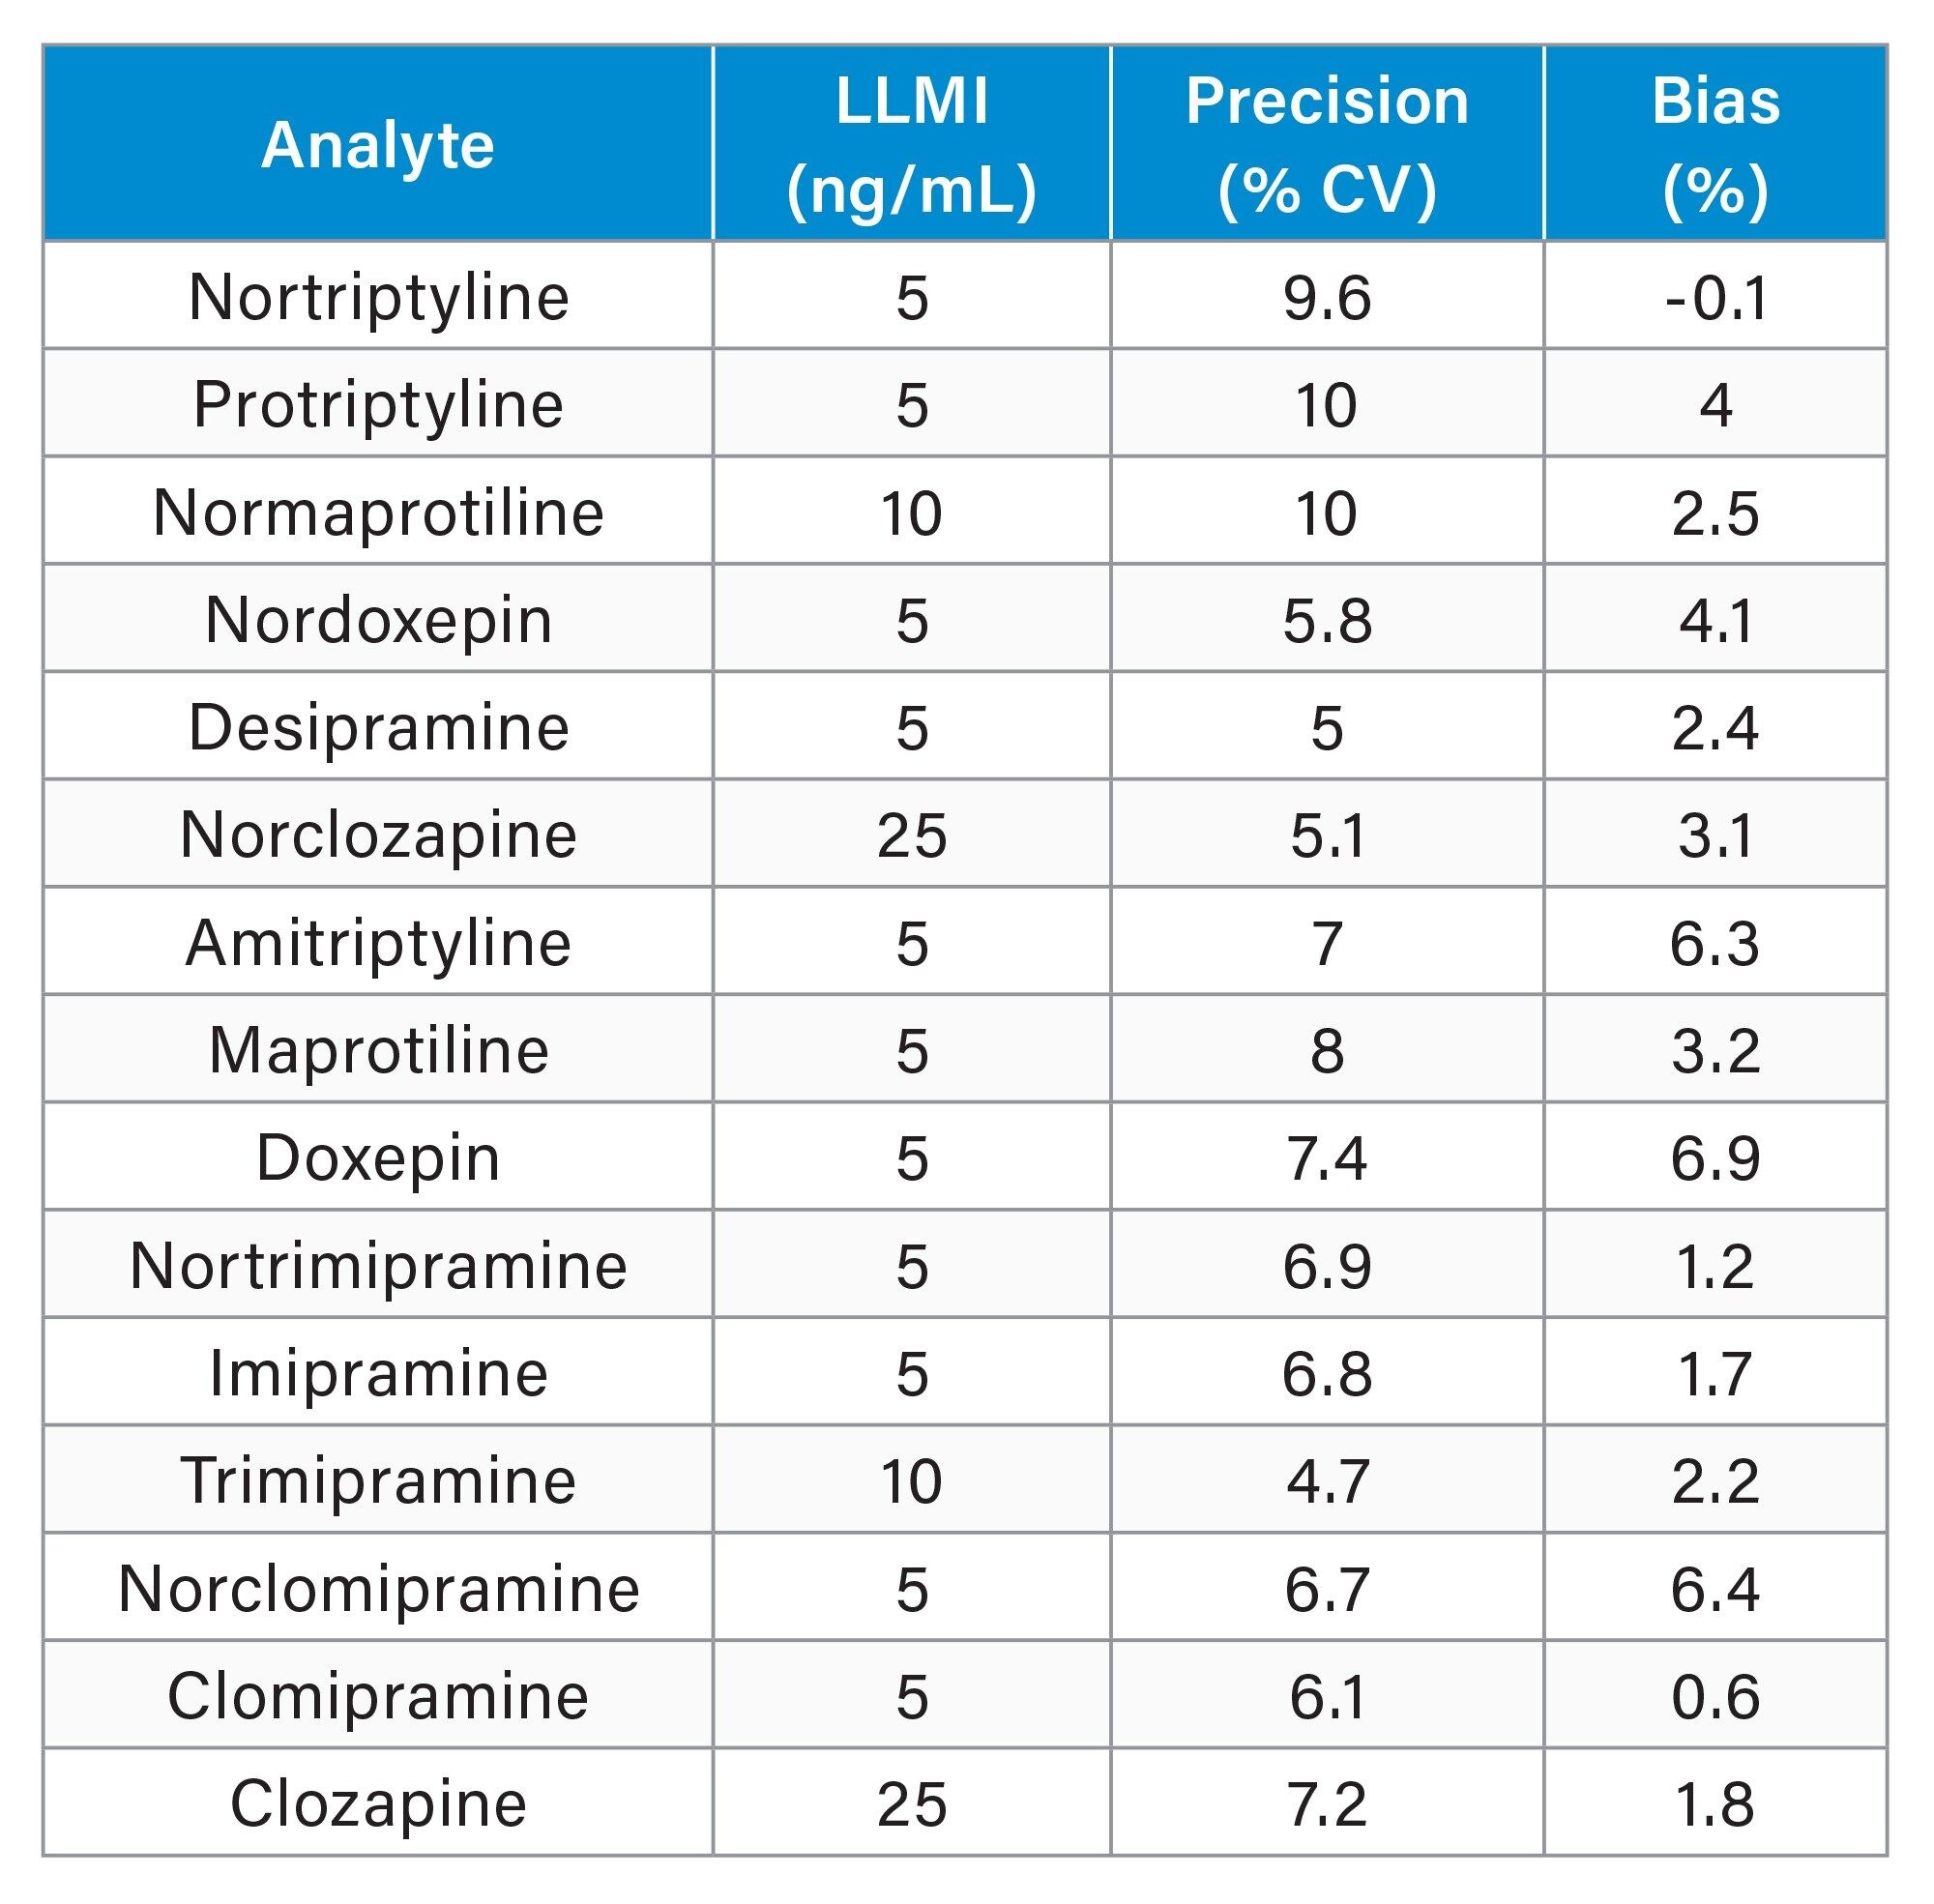
Analytical sensitivity studies were performed by extracting and quantifying ten replicates of four levels of low concentration samples prepared in plasma, over five days (n=40). Results obtained demonstrated that the method would allow for precise quantification (≤20% CV, ≤15% bias) at the concentrations shown below in Table 5.
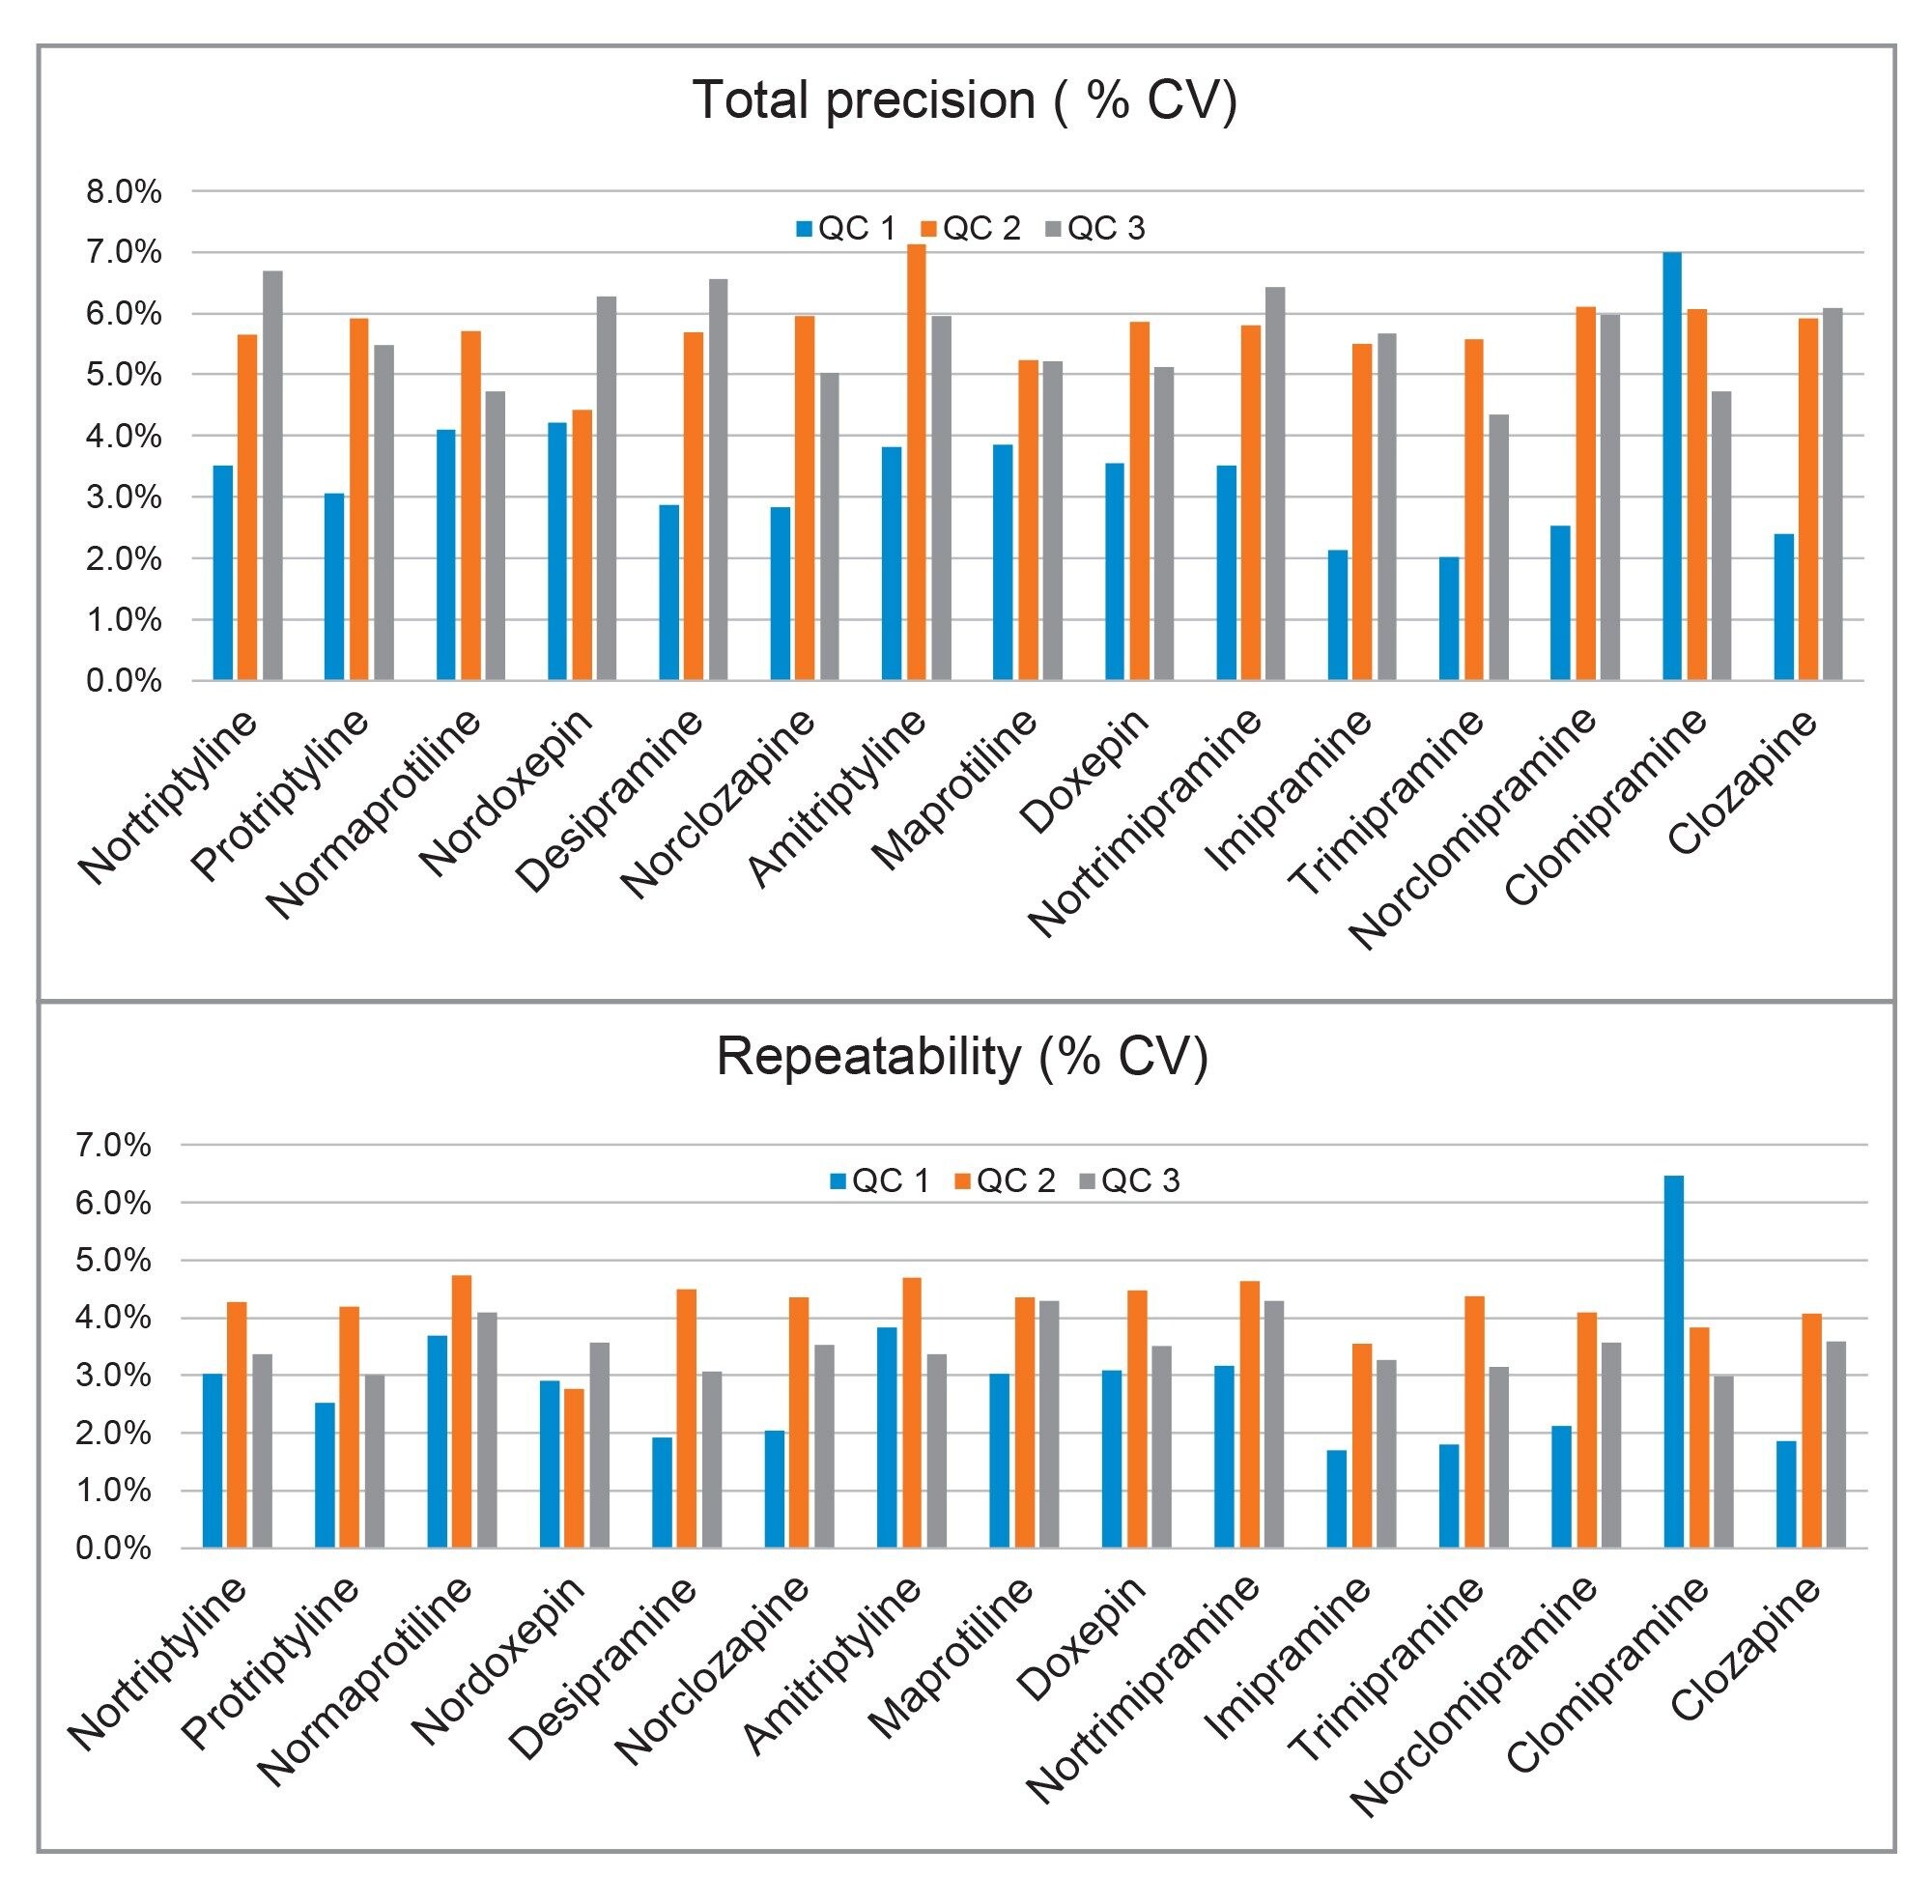
Total precision was determined by extracting and quantifying five replicates of three concentration levels of plasma pools over five separate days (n=25). Repeatability was assessed by analysing five replicates at each QC level. The results presented in Figure 3 demonstrated the total precision and repeatability assessed at the three concentration levels (25, 75, and 400 ng/mL) for all analytes, with the exception of normaprotiline, and trimipramine at 50, 150, and 800 ng/mL, and clozapine, norclozapine assessed at 125, 375, and 2000 ng/mL, was ≤8.0% CV.
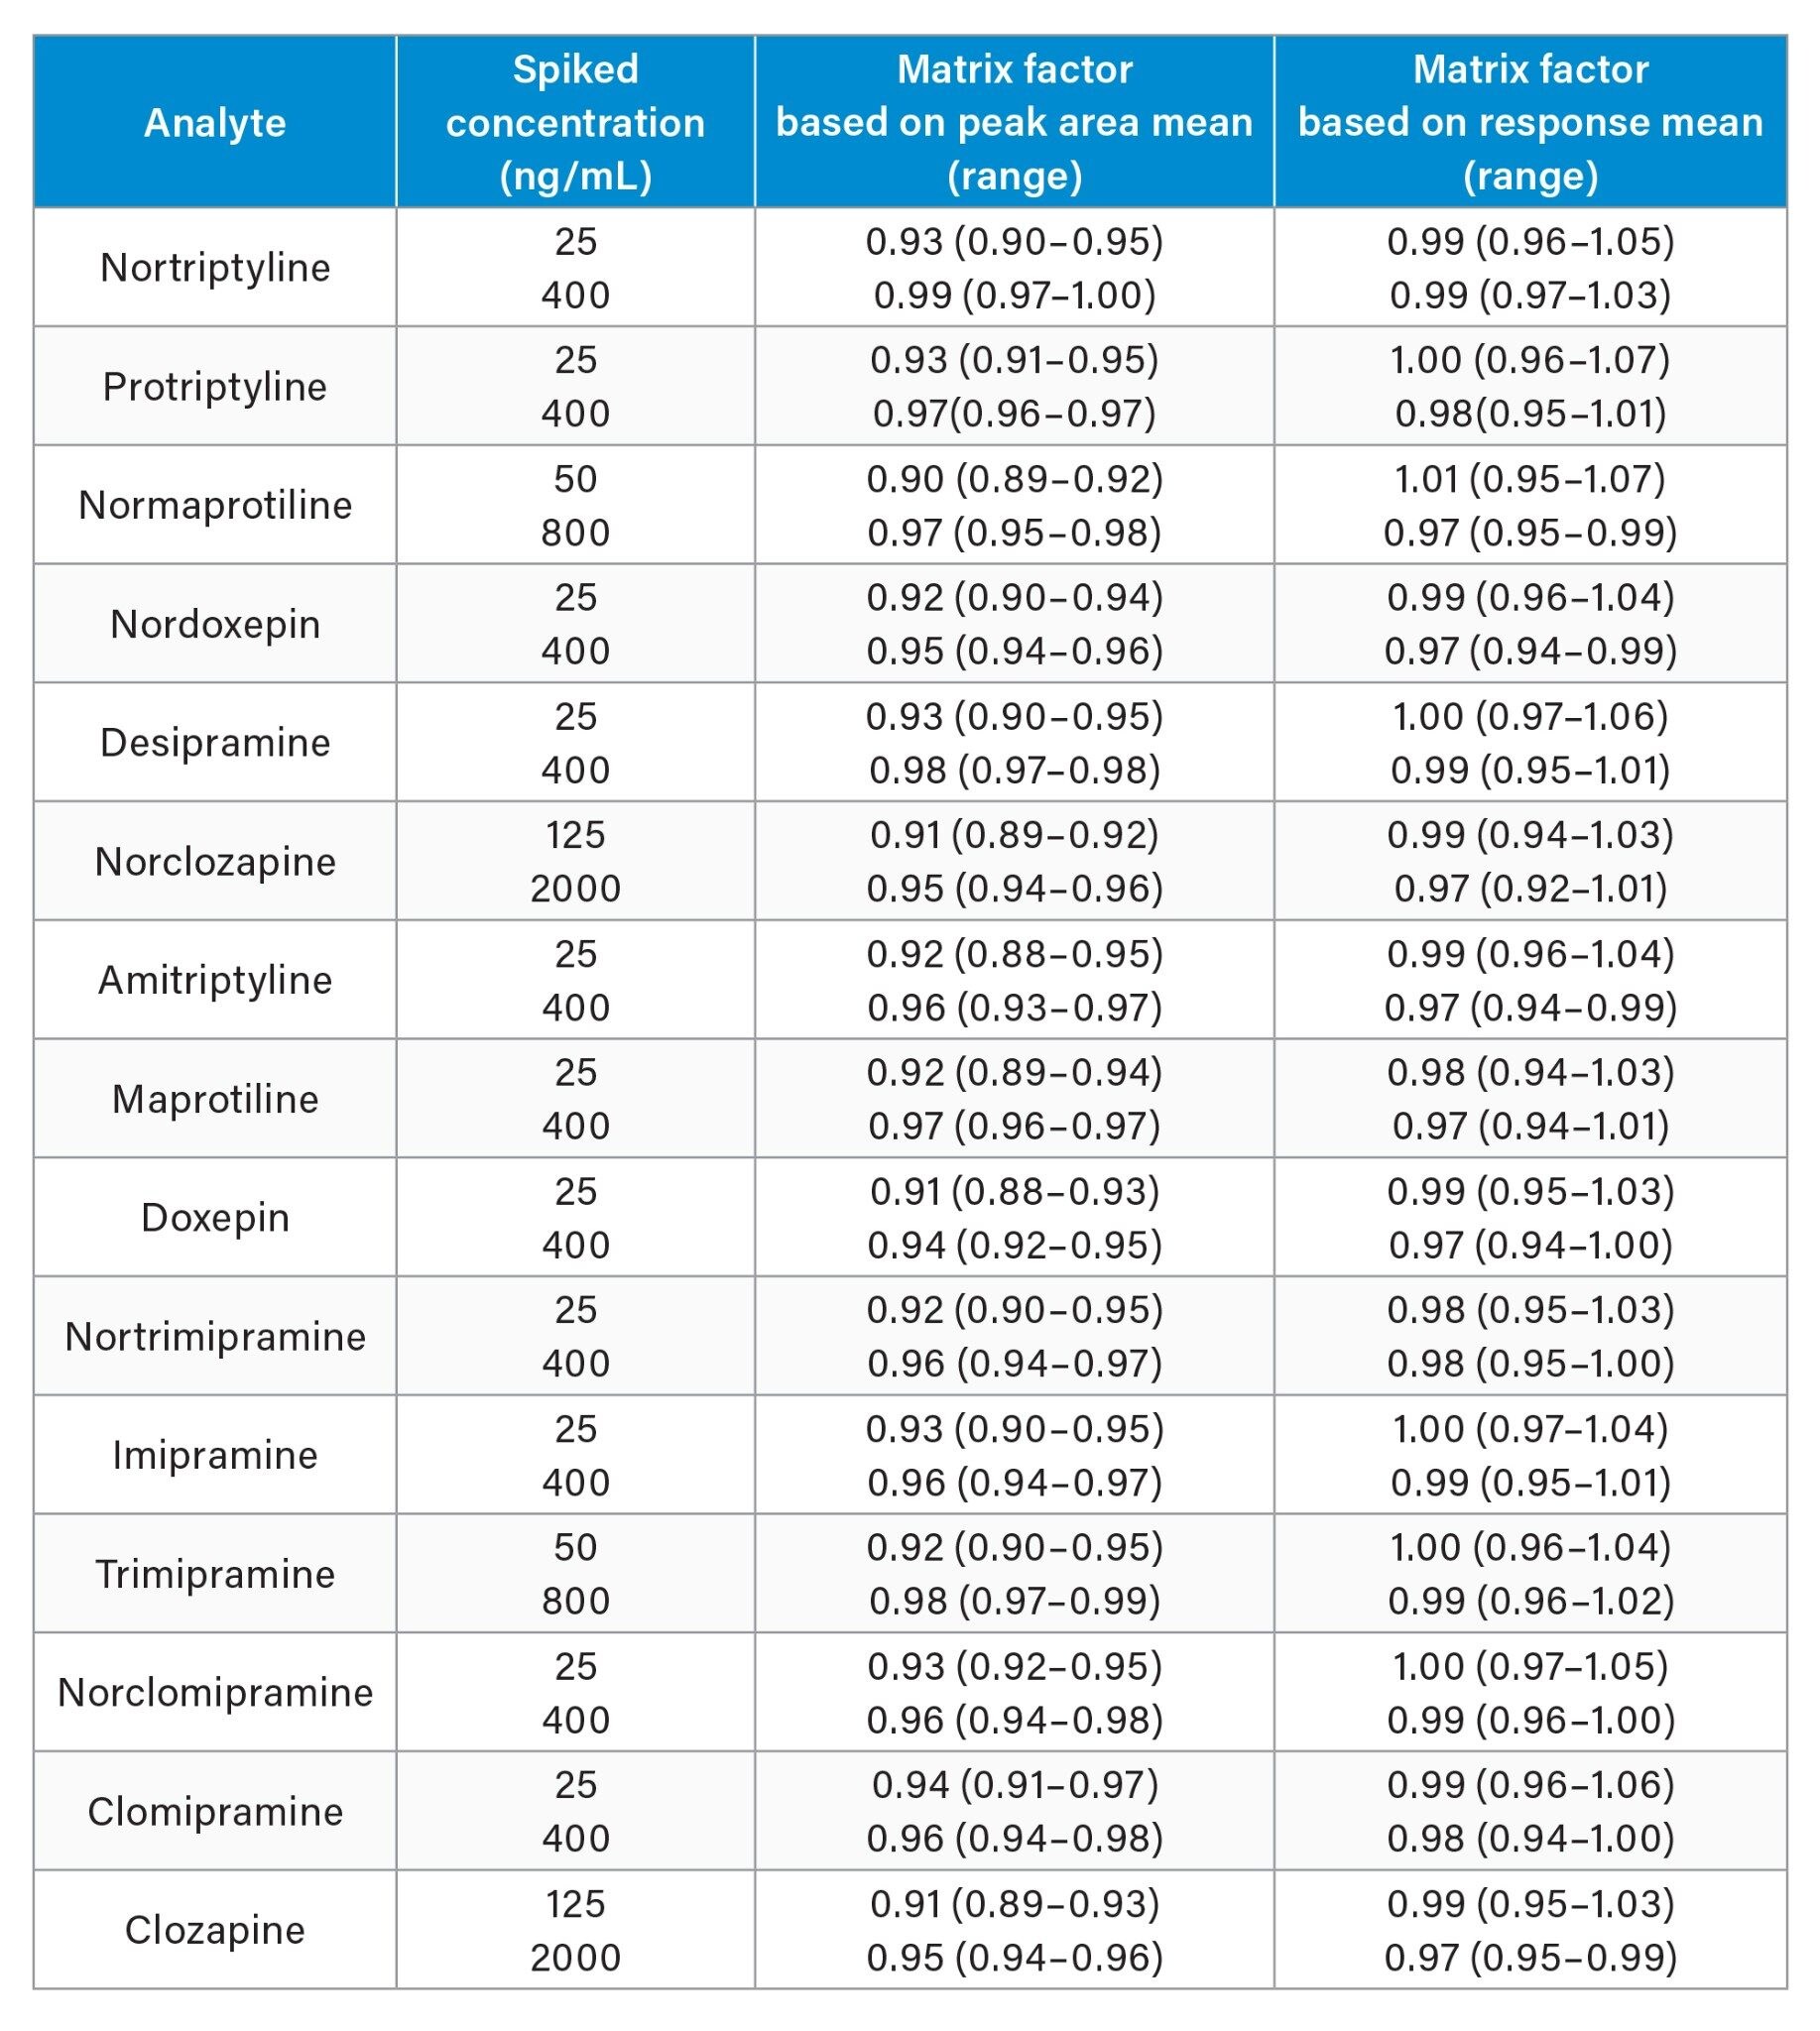
Matrix effects investigations were performed using donor human plasma samples (n=6) at low (QC1) and high (QC3) levels and evaluated as a percentage of extracted solvent samples spiked to equivalent concentrations. As shown in Table 6, the matrix factor calculations using analyte: internal standard response ratio, demonstrated that the internal standard compensated for any signal enhancement or suppression observed.
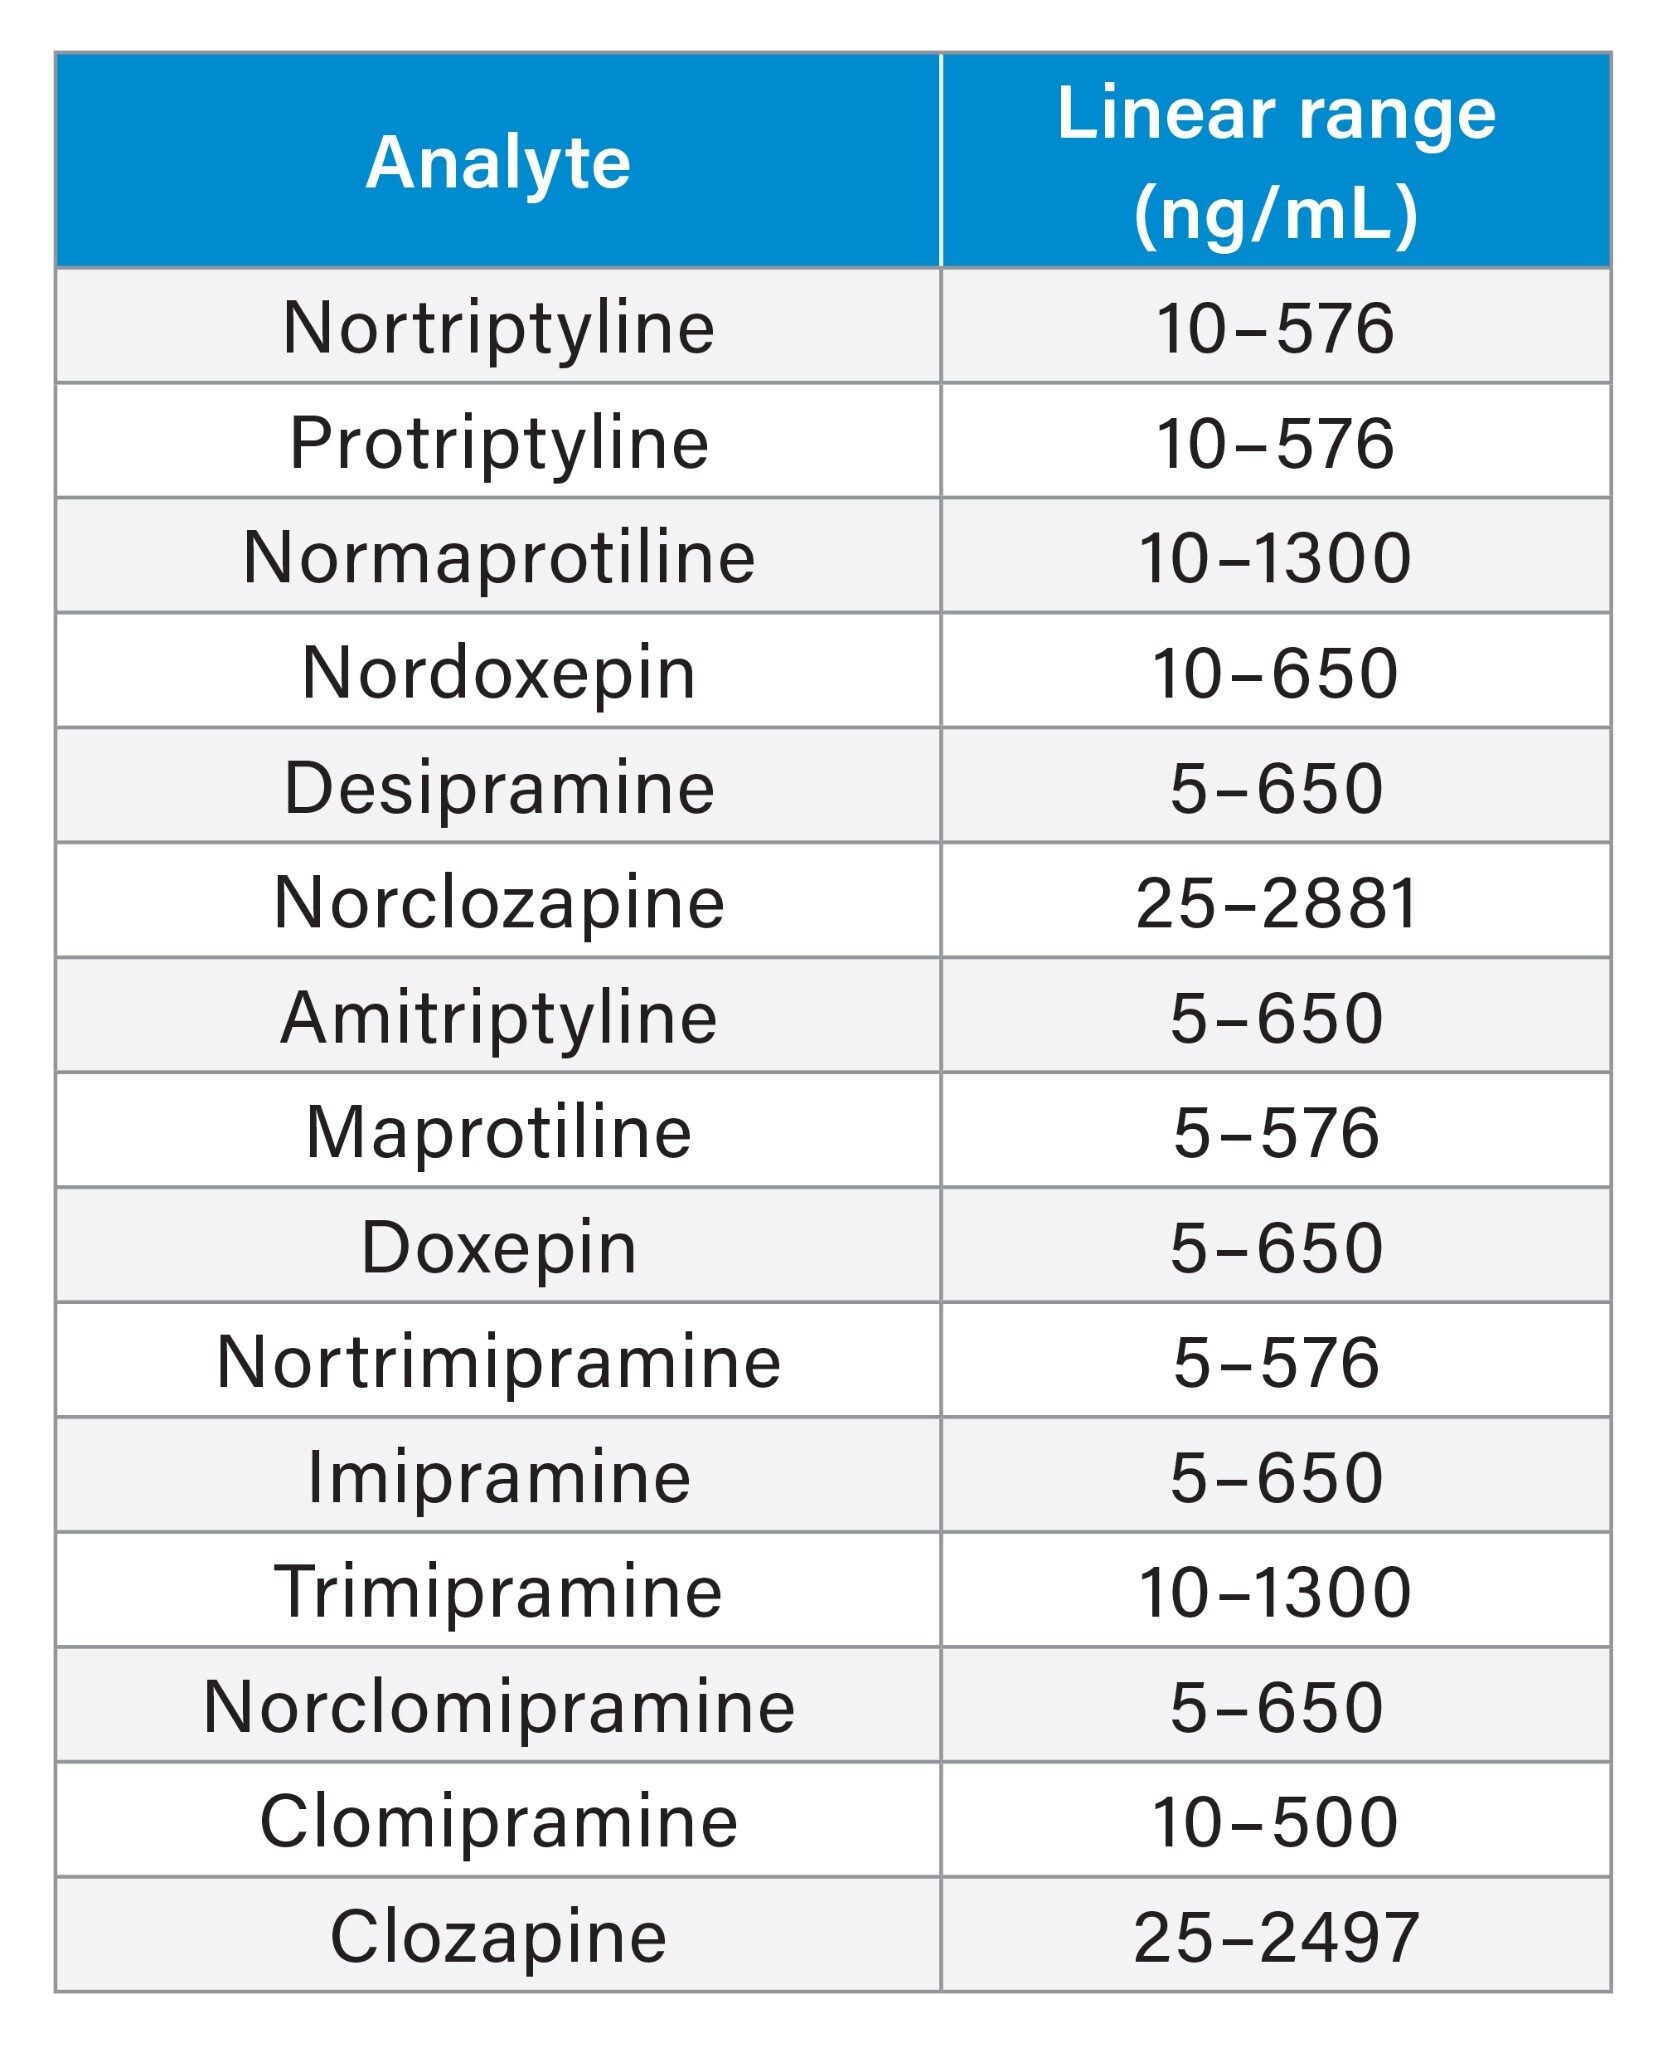
The method demonstrated good linearity for all analytes as shown in the Table 7 below. This was evaluated when different ratios of low and high concentration pools of the analytes were combined and analyzed. In addition, calibration lines exhibited coefficient of determination (r2) of >0.995 for all analytes.
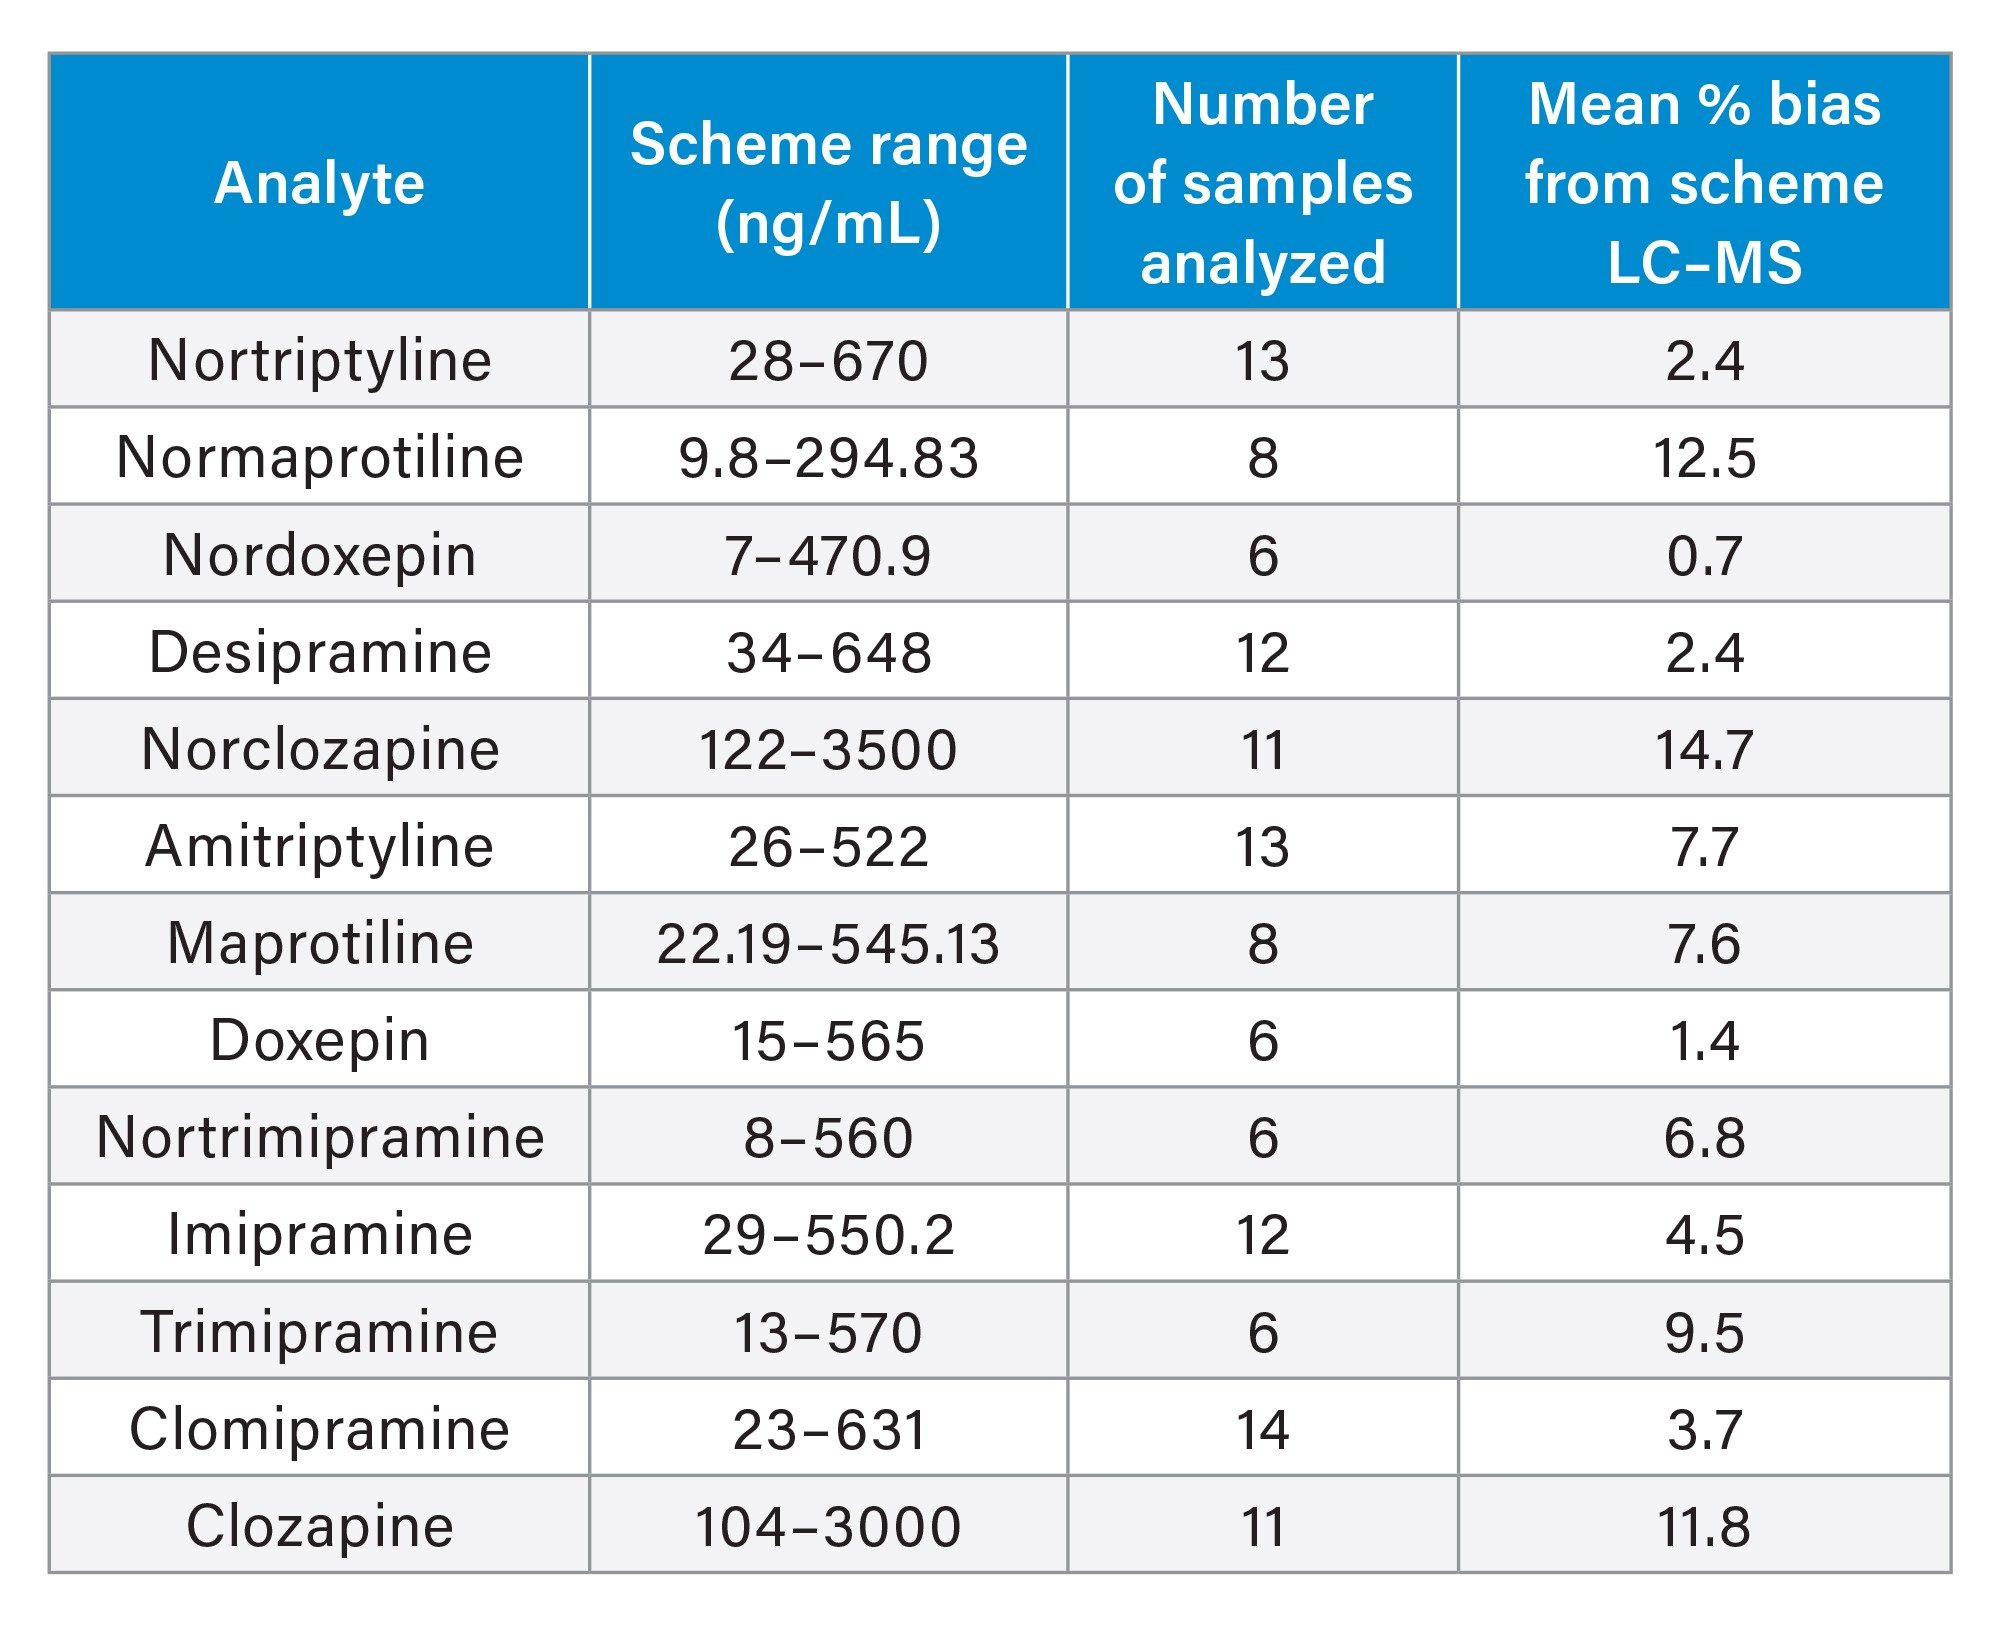
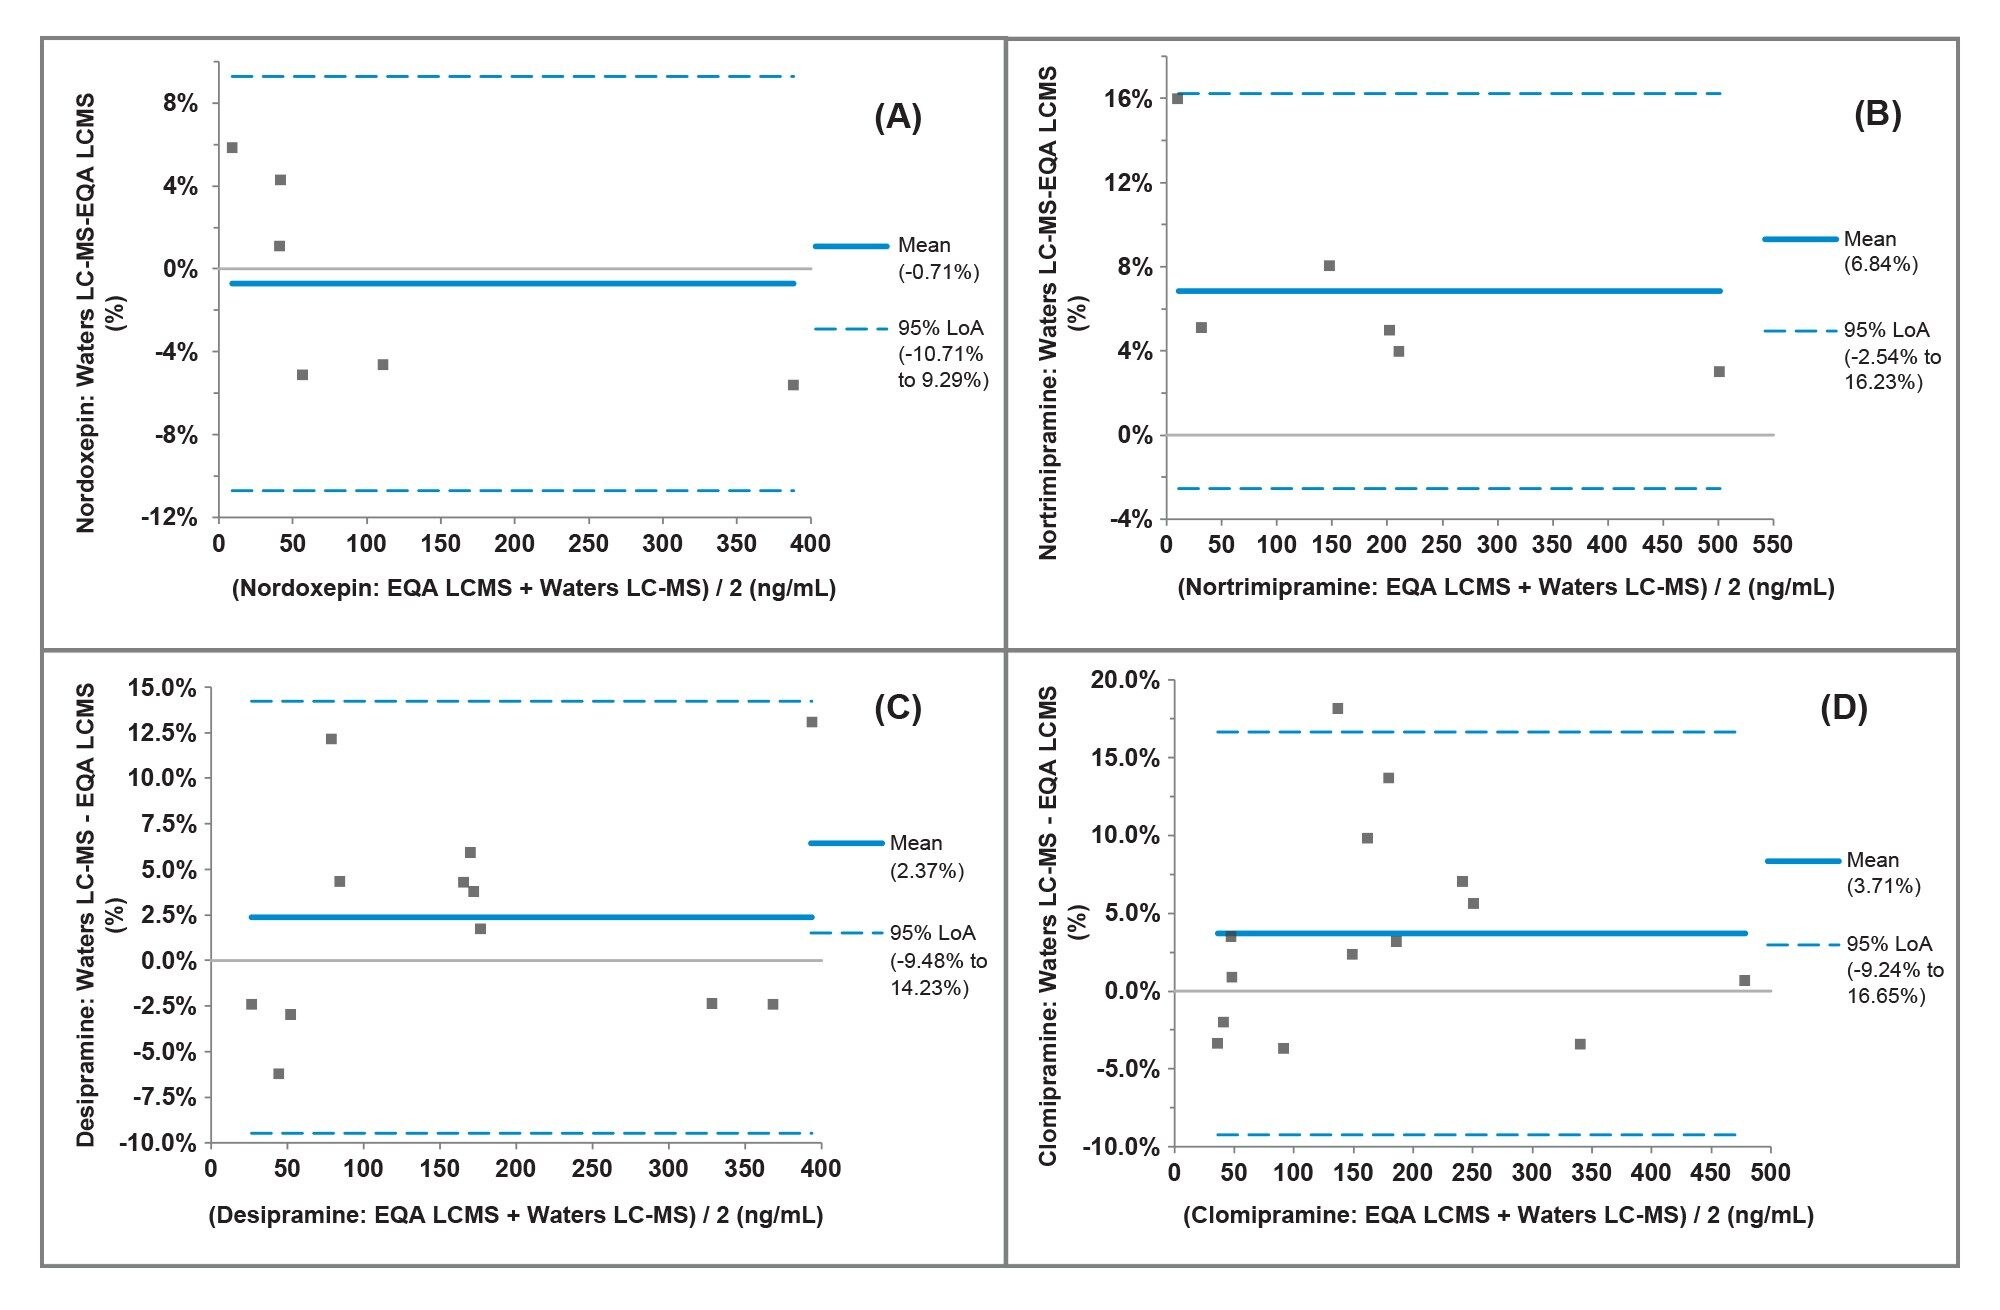
Accuracy was evaluated using external quality assurance (EQA) serum samples provided by LGC (Greater London, UK) for all analytes with the exception of protriptyline which was not included in the scheme. The results obtained were compared to the LC-MS method mean for the samples. Bland-Altman agreement (Figure 4) provided a mean method bias of <14.75% demonstrating very good agreement with the EQA LC-MS mean values for the analytes evaluated except for norclomipramine. A summary of results is shown in Table 8.
Conclusion
- The analysis of 15 tricyclic antidepressants with different polarities was achieved by a selective and robust UHPLC-MS/MS clinical research method and used the XSelect Premier HSS Technology to separate isobaric compounds
- The sample preparation and analysis was simple and inexpensive, requiring only 50 µL of plasma and taking less than 4.5 minutes per injection
- The method showed excellent precision, no significant carryover or matrix effects, and accuracy was confirmed by the analysis of EQA samples
References
- Gillman PK, Tricyclic antidepressant pharmacology and therapeutic drug interactions updated, British Journal of Pharmacology (2007) 151, 737–748.
720008285, March 2024