• Note d'application

Peptide Mapping with Higher Confidence: The Application Capability of IMS QTof Mass Spectrometry with Four-dimension (4D) Peak Detection (RT, m/z, intensity, and CCS values)

Peptide Mapping with Higher Confidence: The Application Capability of IMS QTof Mass Spectrometry with Four-dimension (4D) Peak Detection (RT, m/z, intensity, and CCS values)

  • Jing Fang
  • Ying Qing Yu
  • Min Du
  • Weibin Chen
  • Waters Corporation

Abstract

This application note demonstrates the use of Vion IMS QTof with compliant-ready UNIFI Software for routine peptide mapping. Vion IMS QTof with UNIFI enables collection of highly accurate and stable mass measurement over a wide detection dynamic range. Routine ion mobility for peptide mapping provides a higher level of confidence as robust and consistent CCS measurements are recorded for each peptide, and more confident assignment are made using 4D peak processing.

Benefits

The benchtop Vion IMS QTof Mass Spectrometer – controlled by compliant-ready software, UNIFI Scientific Information System – is utilized for routine peptide mapping analysis of therapeutic mAbs. The 4D peak processing in UNIFI Software for peptide mapping takes advantage of ion mobility separation, and provides collision cross section measurement in addition to accurate mass, retention time, and intensity for each peptide component. With robust mass and CCS measurement, and wide dynamic range and automated instrument setup, Vion IMS QTof is an ideal MS system to generate high-quality data with minimum instrument optimization. 

Introduction

The ability to characterize protein therapeutics during the product development cycle is an important requirement for analytical support in the biopharmaceutical industry. LC-MS has played a critical role in the ensemble of analytical tools to generate in-depth characterization of biologics. 

All too often in biopharmaceutical characterization, catch words such as “robust” or “routine” do not go head-to-head with words like “high performance” and “in-depth.” Scientists naturally want to get the best quality data on a high-resolution mass spectrometer coupled with a UPLC system, but this comes at the expense of suffering with complex instrument operation and data processing. To address this dilemma, we offer an integrated routine biotherapeutic analysis solution: A high-performing ACQUITY UPLC H-Class Bio and Vion IMS QTof System operated by a regulatory compliant-ready software – UNIFI – streamlining automated  data acquisition, processing, and reporting.1,2 In this application note, the system performance on Vion IMS QTof MS with UNIFI is demonstrated for routine peptide mapping analysis including system setup, detector dynamic range, mass accuracy, ion mobility separation, and collision cross section (CCS) measurement.

Experimental

Sample preparation

Peptide mapping analysis: The monoclonal antibody (mAb), trastuzumab, was diluted to 1 mg/mL in a denaturation buffer  (7 M guanidine chloride, 0.2 M Tris, pH 7.5) and diluted samples were reduced with 0.5 M DTT at 37 °C for 30 minutes. The reduced samples were alkylated with 0.5 M idoacetamide at room temperature for 20 minutes. Buffer exchange (0.1 M Tris, pH 7.5) of the mAb sample was performed using a NAP-5 column (GE Healthcare) prior to an efficient tryptic digestion (1 hour at 37 °C). The digested samples were stocked in -80 °C before peptide mapping experiments.

Peptide quantification: Hi3 PhosB standard peptides (Waters, P/N 186002326) were spiked into the trastuzumab digests. Hi3 PhosB standard peptides were re-suspended from lyophilized powder to solution by 0.04 mg/mL trastuzumab digests. The resulting concentration of the standard peptide was 100 pmol/µL. A serial dilution was followed to generate 10000, 1000, 100, 10, 1, and 0.1 fmol/µL of the standard peptides under a constant background of trastuzumab peptides.

LC-MS conditions

LC System:

ACQUITY UPLC H-Class Bio

Analytical column:

ACQUITY UPLC CSH C18, 1.7 μm, 2.1 mm Å~ 100 mm

Column temp.:

65 °C

Mobile phase A:

H2O with 0.1% formic acid

Mobile phase B:

ACN with 0.1% formic acid

LC gradient:

1–33% B in 30 min (Peptide Quan); and in 120 min (Peptide Map)

Acquisition mode:

MSE and HDMSE

MS conditions

Instrument:

Vion IMS QTof

Capillary:

3 kV

Sampling cone:

40 V

Source offset:

80 V

Source temp.:

100 °C

Desolvation temp.:

250 °C

Cone gas flow:

50 L/h

Desolvation gas flow:

600 L/h

Results and Discussion

Automatic system setup and health check

Setting up Vion IMS QTof (see Figure 1 schematic diagram) to start data acquisition is simplified with UNIFI which allows for a single push button step for automating routine setup that includes detector setup, resolution optimization, and mass and CCS calibration for all routine acquisition modes.2 Automatic pre-batch checks ensure that Vion IMS QTof performs at every injection and that automatic health checks (a partial check list is shown in Figure 2) monitor system performance throughout the entire analysis, reducing the need for manual checks.

Figure 1. The schematic illustration of Vion IMS QTof Mass Spectrometer.
Figure 2. UNIFI controls Vion IMS QTof. A health check for the instrument performances prior to data acquisition is automated to help users with system diagnostics to obtain high-quality data.

Vion QTof MS performance for peptide analysis

High mass accuracy (with and without IMS)

To demonstrate the accuracy and stability of Vion IMS QTof in mass measurement, we utilize trastuzumab tryptic digest as an example. The tryptic peptides were separated by a 120 minute UPLC gradient method prior to MS detection and assigned by  UNIFI using the peptide mapping workflow. Leucine-enkephalin was used for lock mass correction during data acquisition. The mass errors (ppm) of assigned trastuzumab tryptic peptides are plotted in Figure 2. In summary, monitored were a total of 1281 peptide ions from 27 injections across three days – collected under DIA mode, MSE acquisition (Figure 3A) – and 630 peptides  from 12 injections under HDMSE mode, ion mobility-enabled precursor ion separation followed by DIA fragmentation (Figure 3B).3 Under MSE acquisition mode, 88% of the identified peptides have mass error within ±2 ppm, and 67% of them within ±1 ppm (Figure 3A). Under HDMSE, 94% of the peptides have mass error within ±2 ppm and 73% of the peptides within ±1 ppm. We observed no compromise in mass accuracy when IMS was used for the peptide mapping analysis.

The peptides’ mass variation on Vion were displayed by plotting the mass error of five representative peptides over 27 sequential injections (72 hours uninterrupted), as shown in Figure 4. The mass accuracy was maintained within ±2.5 ppm of the theoretical mass across three days worth of experimental data.

Figure 4. The mass accuracy of five representative peptides in 27 continuous injections over a three day experimental time period. 

Wide dynamic range

Vion IMS QTof incorporates QuanTof2, the latest iteration of QuanTof Technology (see Figure 1). Ion arrival times are recorded using a dual 3.6 GHz 10 bit analogue-to-digital converter (ADC). The output digitization rate is 7.2 GHz using full high-dynamic range dual-channel operation. Wide-dynamic range dual-channel ADC operation is left on continuously to prevent loss in mass resolution under any acquisition settings. This technology significantly increases the dynamic range of the system, enabling ion mobility to be used routinely.

The quantitation limit and linear dynamic range of the Vion IMS QTof Mass Spectrometer was measured by spiking a standard peptide mixture of Hi3 PhosB into trastuzumab digests to make a dilution series of 10000, 1000, 100, 10, 1, and 0.1 fmol/µL. A volume of 10 µL was loaded onto an ACQUITY UPLC Column, and data collected using both MSE and HDMSE modes. Peak area response was obtained based on UNIFI Tof 2D processing. The extracted ion chromatogram of a representative peptide is displayed in  Figure 5A. Results show that both MSE and HDMSE modes of acquisition produced similar quantitation results. The LOD is 10 fmol; LOQ is 10 fmol with S/N=3. The MS response is linear from 10 fmol to 100 pmol or up to 5-order of linear dynamic range as shown  in Figure 5B MSE mode, and Figure 5C HDMSE mode.

Figure 5. Linearity of MS response is shown for replicate injections from 1 fmol to 100 pmol of the Hi3 PhosB peptide standards. 5A) The XIC of a representative peptide. 5B) Dynamic range of Vion IMS QTof under MSE mode, and 5C) HDMSE mode. 

High peptide mapping sequence coverage

In this study, one hour digestion was applied after protein reduction and alkylation to minimize the artifact PTMs. Trastuzumab tryptic digests mixture was analyzed in triplicate runs by the UNIFI UPLC/MSE peptide mapping workflow, automating batch  data acquisition and processing. After applying a strict criterion, we observed 95% sequence coverage for the light chain and  94% for the heavy chain from a single analysis, as shown in Figure 6. The criteria for assigning the identified peptides for current analysis are:

  1. % matched primary ions (or b/y ions) is greater than 30% (fragment ions/all possible fragment ions × 100)
  2. Mass tolerance window is set within 10 ppm
  3. No semi-tryptic digestion, no missing cleavage, and no in-source fragments

The missing sequence coverage is from minor peptides containing two or three amino acids generated by trypsin digestion, which are not well retained on C18 columns.

Figure 6. Sequence coverage map of trastuzumab with fragmentation information obtained by data-independent acquisition (MSE). The confirmed sequences  are highlighted in gray. The blue lines above and red lines below the sequence indicate that these sequences are confirmed by high-energy fragment b and y ions, respectively.

IMS benefits the routine peptide mapping analysis

The improved usability and dynamic range with Vion IMS QTof enables ion mobility separation to be incorporated into routine peptide mapping analysis, which delivers the following benefits: 1) simplification of MS data obtained from complex samples, and 2) automated CCS calculation and reporting via UNIFI data processing for peptides, adding extra specificity for peptides assignment.

Ion mobility is a gas phase separation technique that separates ions based on their size, shape, and charge. In the Vion IMS  QTof Mass Spectrometer, the mobility cell sits between the ionization source and the quadrupole as shown in Figure 1. Because  the IMS separation can be performed rapidly in milliseconds timescale, this technique is orthogonal to the LC separation that occurs in second time frame. The addition of ion mobility separation increases peak capacity and the resolving power for complex mixtures. A typical ion mobility 3D view of trastuzumab tryptic peptides from a 30 minute LC separation is shown in the left panel  of Figure 7A. The chromatogram, spectrum, and mobility trace (shown in the right panel) are all interactive with the ion mobility  3D view, which allows investigations of all ions in a 4D view (m/z, intensity, and mobility drift time, plus the LC retention time) in UNIFI, showed in Figure 7B.

Figure 7. UNIFI offers 4D peak processing for HDMSE data. The ion mobility 4D view with interactive 2D chromatogram, spectrum, and mobility trace is shown in 7A. The information including LC retention time, m/z, intensity, drift time, and CCS value are obtained for each peptide component after data processing 7B.

High precision of CCS measurement

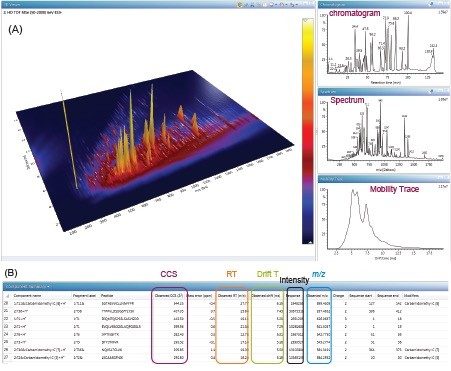
CCS values are generated for every peptide as an integral part of information in additional to retention time, accurate mass, and charge. CCS values, along with other detection results (RT, m/z, etc.), can be automatically stored within the UNIFI scientific library (Figure 7B). The scientific library can also be used for targeted component search/monitoring using UNIFI accurate mass screening workflow, to monitor peptides that are indicative of critical quality attributes from the drug products – all within a single informatics platform. With the combination of Vion IMS QTof Mass Spectrometer and UNIFI Scientific Information System, the IMS parameters, calibration procedures, and processing algorithms are working together to produce CCS values that are reproducible and stable over time, and are consistent across different MS systems.

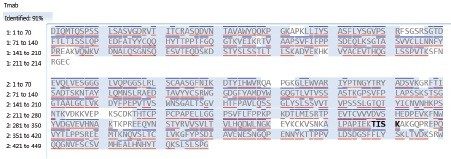
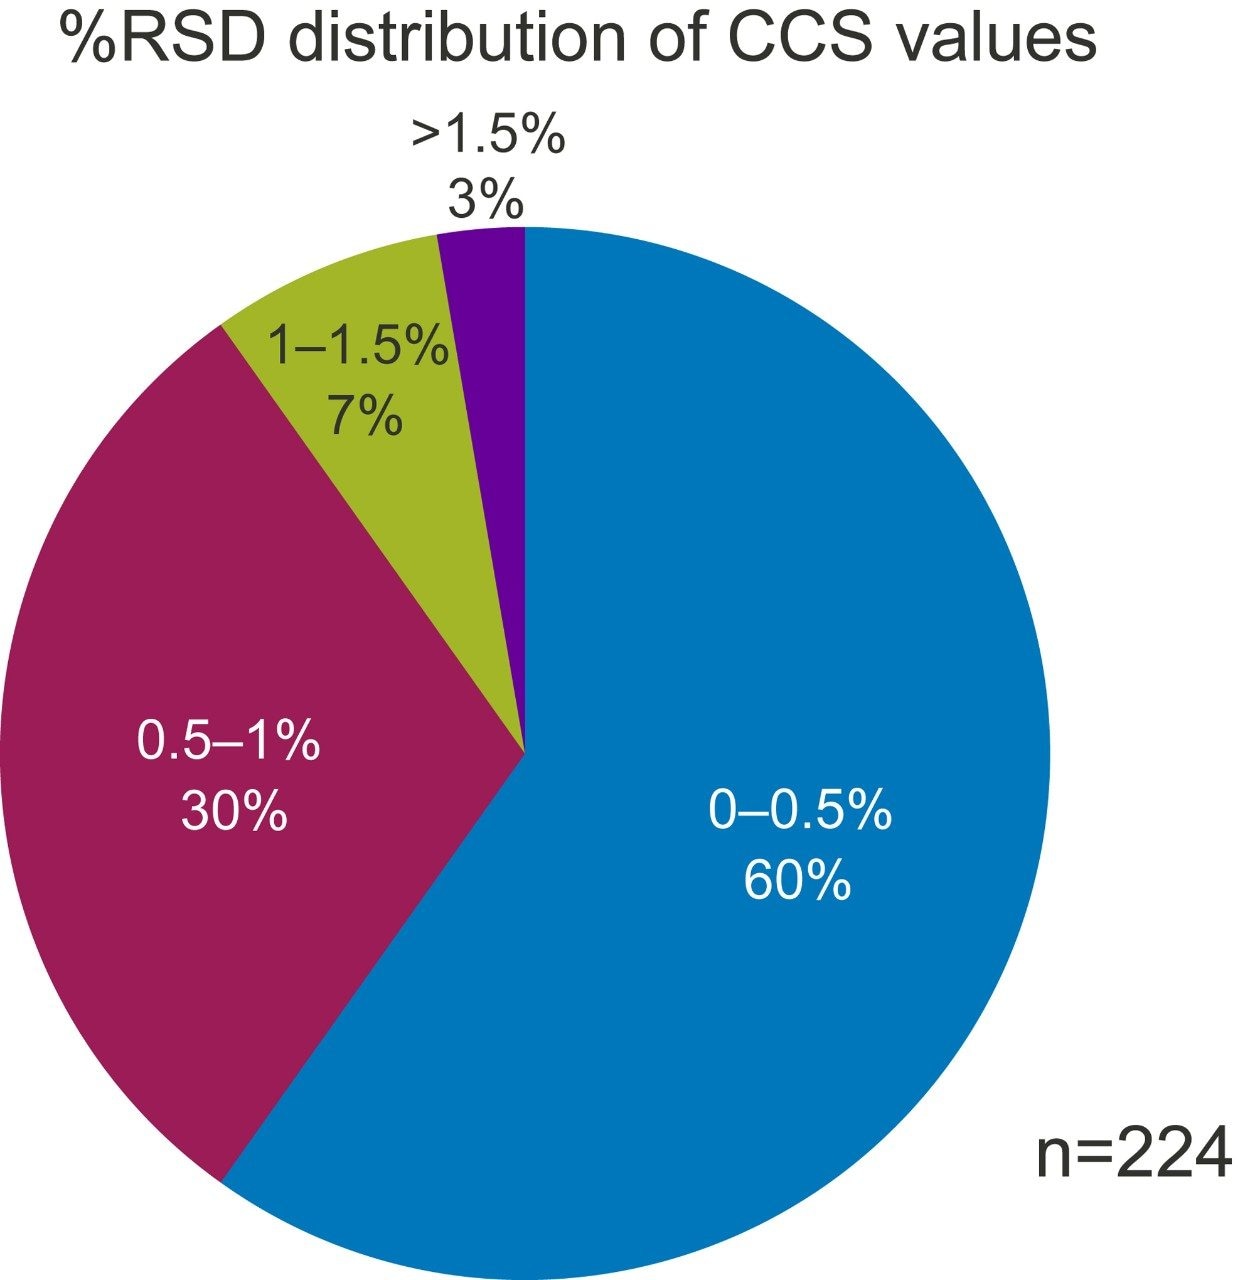
To evaluate the reproducibility of CCS values, the %RSD of 224 ions from trastuzumab digests across 15 injections were investigated (Figure 8). The 224 peptide ions are prepared from control and with oxidation-stressed conditions, different LC gradients (120 minute and 30 minute gradients), and with various MS acquisition parameters, such as collision energy. 90% of the CCS values measured were within 1% RSD; only 3% of the peptide populations have CCS values that are greater than 1.5% RDS – thereby proving the robustness and reproducible nature of CCS values measured on the Vion IMS QTof System. 

Figure 8. The %RSD distribution  of CCS values generated from  224 trastuzmab trypitic digests and across 15 different injections. The %RSD was calculated by UNIFI.

IMS improves peptide mapping specificity

Ion mobility deploys an orthogonal separation in milliseconds that resolves and simplifies spectra. The simplified spectra offer higher specificity for peptide assignment. For low-abundance species coeluting with high-abundance species, the IMS has a more noticeable impact. Figure 9 shows a typical example of MSE data (no IMS): (DIQMTQSPSSLSASVGDR, m/z 626.9669) from the light chain of trastuzumab and coeluted with other high-abundance ions in both low- and high-collision energy channels. When acquiring data using HDMSE (with IMS), that the product ions’ drift times are aligned with their precursor ions in addition to RT alignment, and it is observed that spectra are clarified under both low- and high-energy channels (shown in the bottom panel). Drift time alignment improves the specificity of the fragment ions assigned to their low-energy parent ions, and therefore increases confidence in the peptide assignment.

Figure 9. Spectra comparison of a representative peptide DIQMTQSPSSLSASVGDR (m/z 626.9669 at 3+ charge state) with  and without ion mobility in data-independent acquisition mode. Both low-energy (LE) and high-energy (HE) channels are shown.

Conclusion

Vion IMS QTof is a high-performance benchtop mass spectrometer with ion mobility separation designed for routine use with minimum tuning and optimization. In this application note, we have illustrated the use of Vion IMS QTof with compliant-ready UNIFI Software for routine peptide mapping. Vion IMS QTof with UNIFI enables collection of highly accurate and stable mass measurement over a wide detection dynamic range. Routine ion mobility for peptide mapping provides a higher level of confidence as robust and consistent CCS measurements are recorded for each peptide, and more confident assignment are made using 4D peak processing. 

References

  1. Vion IMS QTof Brochure. Waters literature. 2016. P/N 720005373EN.
  2. Vion IMS QTof Overview and Maintenance Guide. 2016. P/N 715005046.
  3. Geromanos, S.J.; Vissers, J.P.; Silva, J.C.; Dorschel, C.A.; Li, G.Z.; Gorenstein, M.V.; bateman, R.H.; Langridge, J.I. The detection, correlation, and comparison of peptide precursor and product ions from data independent LC-MS with data dependant LC-MS/MS. Proteomics 2009, 9 (6), 1683–1695.

720005905, January 2017

Haut de la page Haut de la page