• Note d'application

Rapid Screening of Fatty Acids in Oil Supplements Using Ambient Ionization (DART) and Mass Detection

Rapid Screening of Fatty Acids in Oil Supplements Using Ambient Ionization (DART) and Mass Detection

  • Kari L. Organtini
  • Giuseppe Astarita
  • Gareth E. Cleland
  • Waters Corporation

Abstract

Typically, fatty acid analysis is performed using GC-FID instrumentation, requiring sample derivatization to the methyl or ethyl ester forms prior to analysis. The derivatization process takes approximately 35 minutes, and the GC method takes close to an hour.

Direct Analysis in Real Time (DART) is an ambient ionization technique that allows the sample analysis to be performed in minutes. DART analysis benefits from the elimination of the need for time-consuming sample preparation and chromatography, making the analyses very rapid. Samples can be deposited on a screen that is moved through a heated ionizing helium beam in an automated fashion. Resulting ions are typically of the [M+H]+ or [M-H]- nature. Coupling DART to the ACQUITY QDa Detector allows the entire system to remain compact and easy to operate. This enables the DART-MS system to be operated outside a typical laboratory space if desired to generate mass spectral information.

In this application note, we demonstrate the utility and ease-of-use of DART coupled to single quadrupole mass detection for the identification and rapid authentication of omega-3 and omega-6 polyunsaturated fatty acids in oil supplements.

Benefits

  • Rapid screening
  • Minimal sample preparation
  • No chromatography needed
  • Ease of use
  • Perform authenticity experiments
  • Sample profiling

Introduction

Polyunsaturated fatty acid (PUFA) oils are popular dietary supplements due to the many health benefits associated with their consumption. Omega-3 fatty acids have been shown to lower the risk of cardiovascular diseases and reduce inflammation, whereas high intake of omega 6 fatty acids has been linked to increased inflammation. Therefore, balancing the omega-3 to omega-6 ratio is important, but the Western diet is known to be high in omega-6 fatty acids. This imbalance promotes the use of dietary oil supplements.

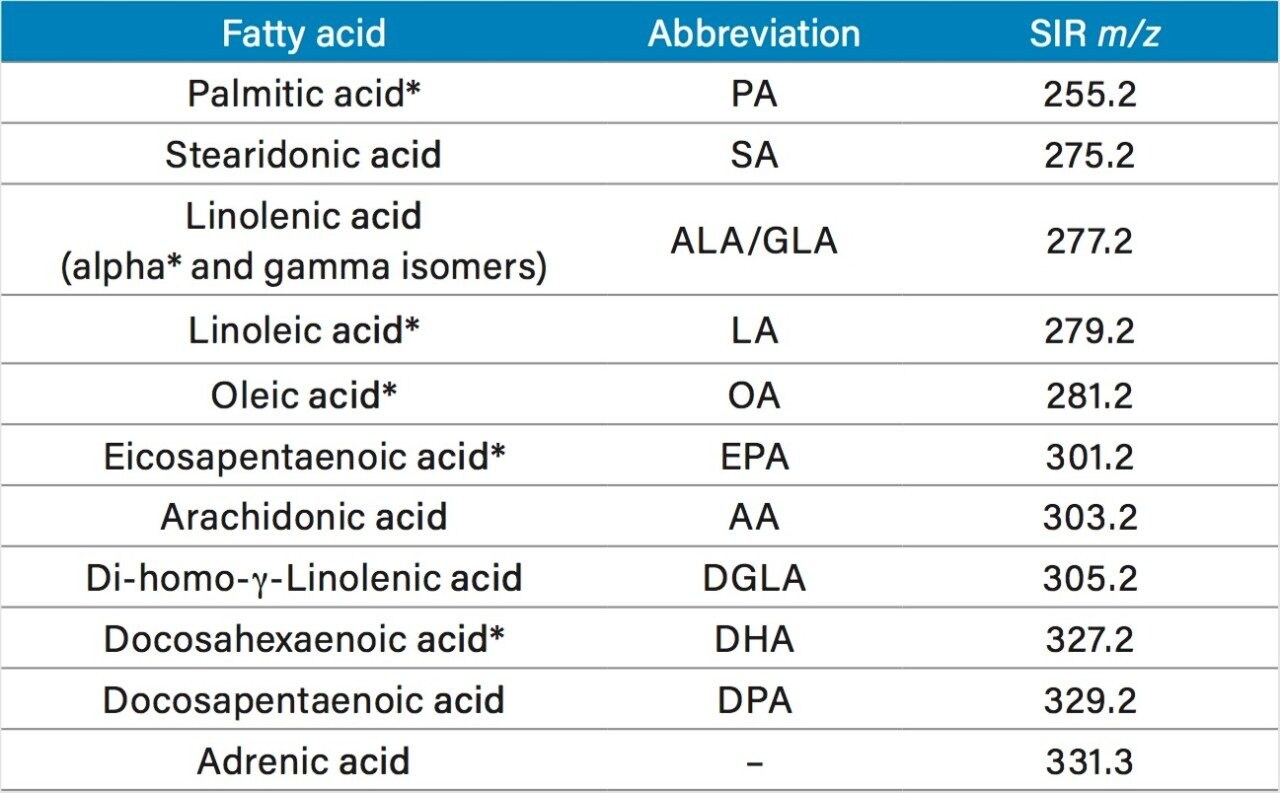
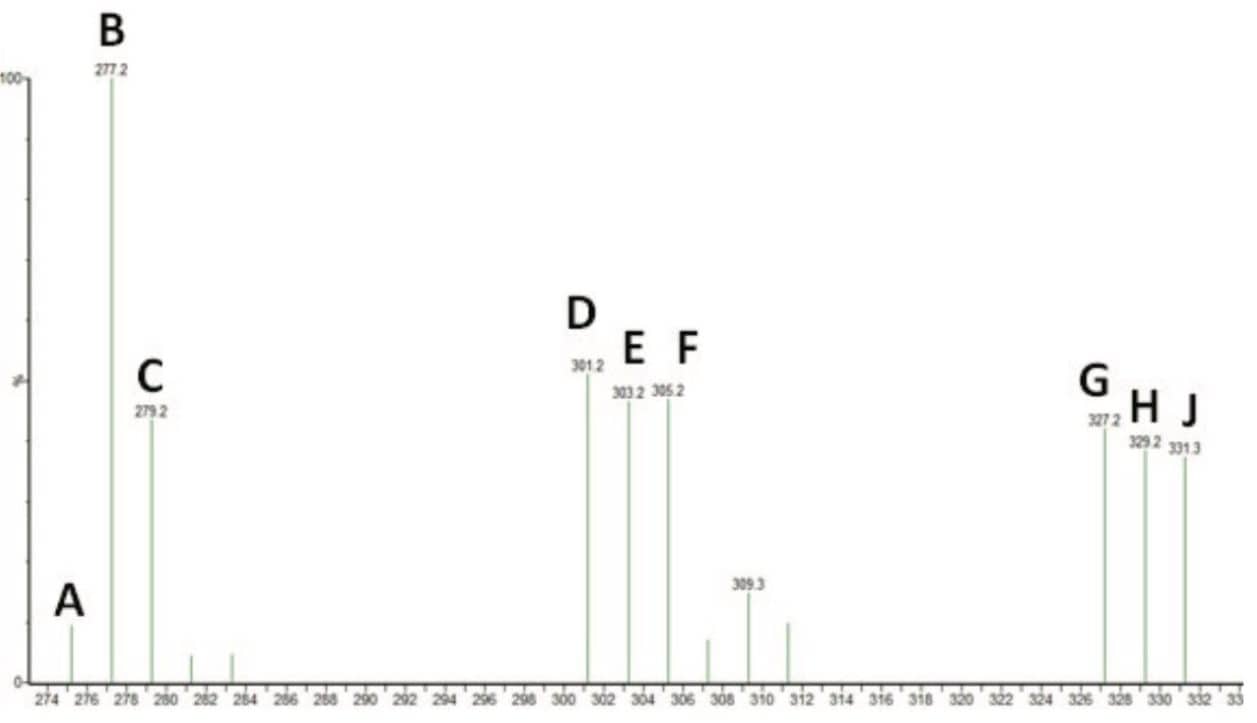
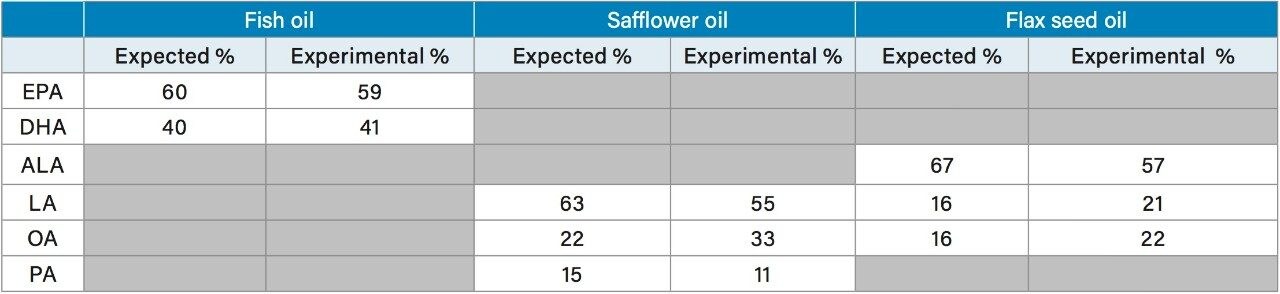
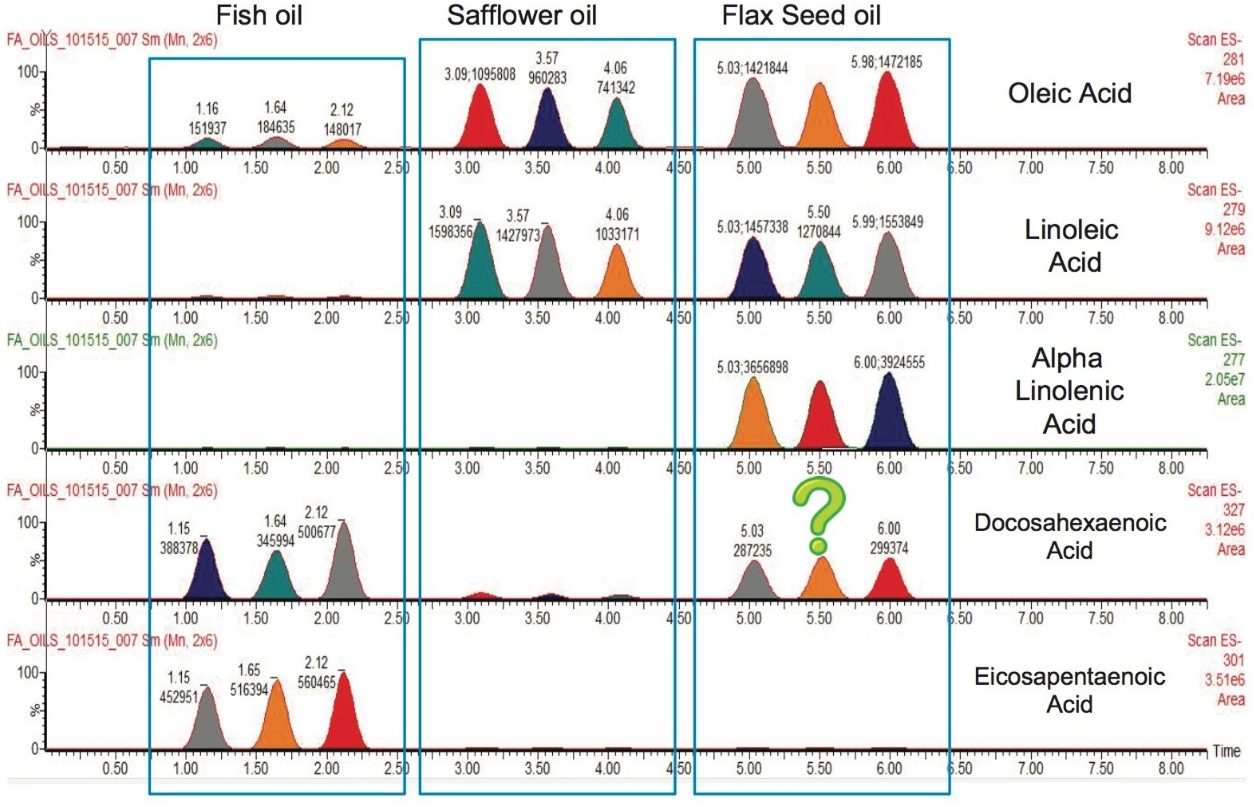
Fish oils provide a source of eicosapentaenoic acid (EPA) and docosahexaenoic acid (DHA) omega-3 PUFAs, whereas plant based oils provide a source of alpha linolenic acid (ALA) as its omega-3 PUFA. With PUFA supplements being such a large part of the market, it is important to monitor adulteration and fatty acid sources of these supplements to protect consumers.

Typically, fatty acid analysis is performed using GC-FID instrumentation, requiring sample derivatization to the methyl or ethyl ester forms prior to analysis.1 The derivatization process takes approximately 35 minutes, and the GC method takes close to an hour.

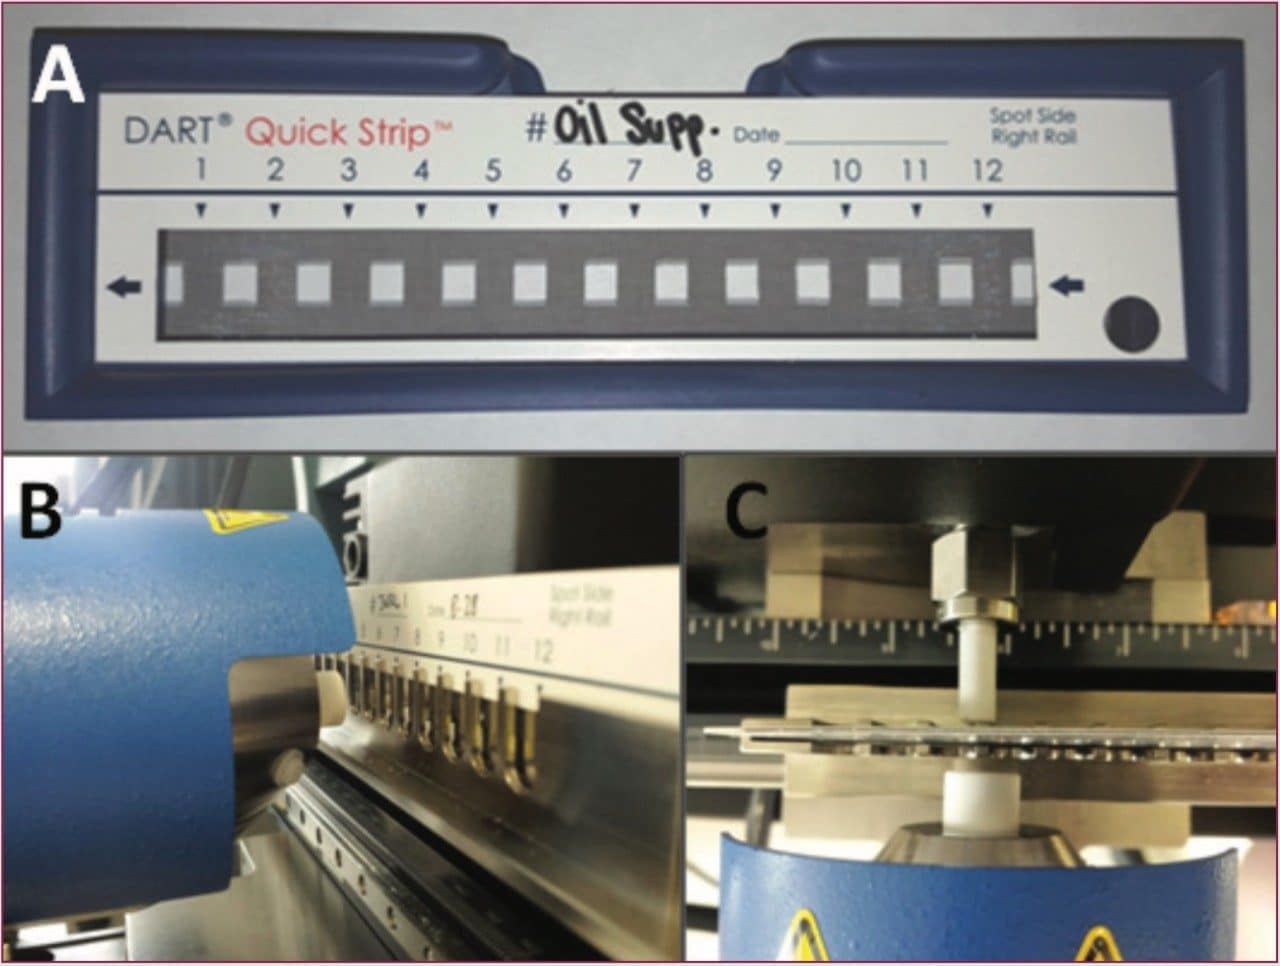
Direct Analysis in Real Time (DART) is an ambient ionization technique that allows sample analysis to be performed in minutes.2 DART analysis benefits from the elimination of the need for time-consuming sample preparation and chromatography, making the analyses very rapid. Samples can be deposited on a screen that is moved through a heated ionizing helium beam in an automated fashion. Resulting ions are typically of the [M+H]+ or [M-H]- nature. Coupling DART to Waters ACQUITY QDa Detector allows the entire system to remain compact and easy to operate. This allows the DART-MS system to be operated outside a typical laboratory space if desired to generate mass spectral information.

Experimental

DART conditions

Ionization mode:

-

Temp.:

200 °C

Sampling speed:

0.5 mm/sec °C

Grid voltage:

- 350 V

MS conditions

Ionization mode:

-

Cone voltage:

15 V

Mass range:

50 to 1000 amu in full scan mode

Sampling frequency:

2 Hz

Selected Ion Recording (SIR) m/z values for the deprotonated fatty acids [M-H]- are listed in Table 1.

Sample analysis

Sample analysis The PUFA standard mix was obtained from Cayman Chemicals. Fatty acid supplement capsules were obtained commercially and the known amounts of omega fatty acids in the capsules were determined from the nutritional facts label on the bottle. Both standards and supplements were diluted in toluene. To collect the oil from the capsules, the capsule shell was cut with a razor blade and a pipette was used to transfer the oil from the capsule into a new vial. Prior to analysis, the oil from the supplements was diluted 1:50 in toluene.

DART-MS analysis was performed by spotting 5 μL of sample onto QuickStrip cards and allowing the solvent to evaporate prior to analysis (see Figure 1). The helium beam used for ionization was heated to 200 °C, the temperature previously determined as the optimal ionization temperature for the set of fatty acids studied in these samples.

Table 1. Masses monitored using the ACQUITY QDa Detector in SIR mode. * Denotes fatty acids expected to be present in the oil capsule supplements.
Figure 1. Images depicting A: the 12 spot QuickStrip card used for sampling; B. the QuickStrip card automatically being moved into the heated helium ionization beam; and C. the ceramic tube pulling ions into the QDa source (top down look at the DART source). The sample is applied to the QuickStrip card on the mesh screen in between each white open square.

Results and Discussion

Method development

During method development of the DART analysis, ionization efficiency was determined to be temperature dependent. Shorter chain fatty acids preferred a lower ionization temperature compared to longer chain fatty acids. For this study, only a select range of fatty acids were stated to be present in the oil supplements tested (m/z range 255 to 327), so the DART method was optimized for this range of fatty acids. Response for the fatty acids in this range present in the standard mix appeared to be comparable at an ionization temperature of 200 °C, as shown in Figure 2. Stearidonic acid appeared to not have as an efficient ionization at 200 °C compared to the other PUFAs in the mix. Although stearidonic acid was in the PUFA standard mix used for method development, it was not a component of the oil supplements tested.

Figure 2. Mass spectrum of the fatty acid standard mix. Peaks are identified as the following: A. SA; B. ALA and GLA; C. LA; D. EPA; E. AA; F. DGLA; G. DHA; H. DPA; and J. adrenic acid. Peak B is expected to have twice the response of the other fatty acids in the mix because it represents both the alpha and gamma isomers of linolenic acid.

Reproducibility of method

Reproducibility of the method was also tested, as shown in Figure 3. The fatty acid standard mix was spotted 10 times on a QuickStrip sampling card for replicate analysis. Figure 3 shows the extracted ion for EPA (m/z 301.2). Each peak represents one spot on the QuickStrip card, which have been integrated to compare the peak areas. The repeatability of the method is also demonstrated in Table 2 which compares the expected and experimental percentage of each fatty acid in the mix. With the exception of stearidonic acid, the experimentally determined percentage of the fatty acids compared favorably with the expected percentage.

Figure 3. Chromatogram of DART-MS analysis of 10 replicate QuickStrip spots containing the same mixture of fatty acid standards demonstrating reproducibility. Showing extracted SIR for fatty acid EPA.
Table 2. Comparison of the expected and experimental (n=10) composition of fatty acids present in the standard mix.

Analysis of oil supplements

Fish, flax seed, and safflower oil supplements were analyzed using the DART-MS method developed. Each sample was analyzed in triplicate. The expected percentage of each fatty acid present in each oil supplement was determined from the nutritional facts listed on the bottle. The experimental percentage was determined based upon the peak areas from extracted SIRs of each compound. The results are detailed in Table 3. All three oil supplements compared quite well with the expected percentage of each fatty acid, with the fish oil supplement comparing the closest. It is important to keep in mind that these are commercially obtained supplements so it is not known if the true contents differ from those listed on the bottle label.

Table 3. Expected and experimental (n=3) percentage of each omega fatty acid present in each oil supplement tested. Expected percentage was interpreted from the nutritional label.

Figure 4 provides a visual depiction of the fatty acid contents of the oil supplements tested. Similarly to Figure 3, each peak in the chromatograms is represented by a single spot on the QuickStrip card. The first three spots on the card were fish oil, followed by three safflower oil spots, and finally three flax seed oil spots. A blank spot was left in between each type of oil to monitor if there was any carryover between spots on the card. Each chromatogram represents the EIC of a different fatty acid. Figure 4 shows that the fatty acids indicated on the bottle label were present in each sample, but that fish oil and flax seed oil both contained an extra fatty acid. The fish oil sample indicates that oleic acid is also present in the sample, but it is not listed as a component of the supplement, and fish is not typically a source of this omega-9 fatty acid. However, the ingredients do indicate that there is soy oil present in the supplement to provide tocopherols to preserve freshness. Soy is a known source of oleic acid, and therefore could account for its presence in the supplement. The flax seed oil supplement indicates the presence of DHA, an omega-3 fatty acid that is derived from a fish source, not plant based. It is unlikely that this is a result of carryover happening from the fish oil supplement as there is no DHA present in the safflower oil that was sampled in between the fish and flax seed oils. It is unclear the source of the DHA present in the flax seed oil, but it indicates possible adulteration, or more likely, contamination during the manufacturing process.

Figure 4. Extracted SIR chromatograms showing the fatty acids present in each of the oil supplement samples (n=3).

Conclusion

DART-MS analysis allowed for rapid screening of PUFA supplements with sample dilution as the only sample preparation step needed prior to analysis. Using this method, up to 12 samples can be analyzed in approximately 6 to 7 minutes. Through the use of known standards, the DART-MS method was determined to be accurate and reproducible.

The method was successfully tested on the analysis of three different fatty acid oil supplements (fish, safflower, and flax seed) to determine how the levels of each fatty acid compared to those reported on the ingredient label. The experimentally determined levels corresponded well with the reported levels in all three oil supplements. The supplement analysis also indicated an incongruity, which was the presence of DHA in the flax seed oil sample.

The DART and ACQUITY QDa mass detection system has the potential for a variety of applications in respect to analysis of oils. It is a quick and easy technique that eliminates the lengthy sample preparation needed for analysis of samples via GC-MS. Notably, DART-MS allows the system to be operated outside a typical laboratory space for quality control monitoring during manufacturing, or as a technique to rapidly identify adulterated samples on the market.

References

  1. AOAC Official Method 991.39. Fatty Acids in Encapsulated Fish Oils and Fish Oil Methyl and Ethyl Esters. 1995.
  2. Cody RB, Laramee JA, Durst HD. Versatile New Ion Source for the Analysis of Materials in Open Air Under Ambient Conditions. Analytical Chemistry. 2005, 77: 2297-2302.

720005724, June 2016

Haut de la page Haut de la page