• Note d'application

Online UPLC Method for the Support of Cleaning Validation and the Routine Monitoring of Cleaning Procedures

Online UPLC Method for the Support of Cleaning Validation and the Routine Monitoring of Cleaning Procedures

  • Tanya Tollifson
  • Waters Corporation

Abstract

This application note describes a fast, online, UltraPerformance Liquid Chromatography (UPLC) method using the PATROL UPLC System that monitors wash solvents directly from a sampling point on the manufacturing equipment. 

Benefits

Online cleaning wash solvent monitoring with the PATROL UPLC Process Analysis System increases confident turnaround of process equipment. Time and solvent savings can be realized with implementation of efficient online cleaning protocols that assure that required safety levels of process components are not exceeded, rather than running more extensive time and materials designed for worst case scenarios.

Introduction

During the manufacture of active pharmaceutical ingredients (APIs), the formulation of drug substances, and therapeutic fill and finish, the removal of residues from manufacturing equipment is performed by a series of cleaning procedures. Often, the cleaning procedure is designed for worst case scenario, to assure sufficient cleaning of the equipment. This approach may result in unnecessary additional cleaning time, solvent use, and waste disposal.

It is imperative that the production equipment be properly cleaned in order to avoid cross-contamination of drug products.1-3 The effectiveness of the cleaning procedures must be demonstrated through cleaning validation. This involves demonstrating that residual API, starting material, intermediates, and impurities have been removed from the production equipment. Care must also be taken to minimize exposure risk of hazardous materials to workers during visual inspection and sampling.

During the cleaning procedure development and validation process, it is important to evaluate the effectiveness of each cleaning step in the overall process to adequately understand at what point the equipment becomes clean. It is also important to confirm that an unclean piece of equipment yields an unacceptable result.

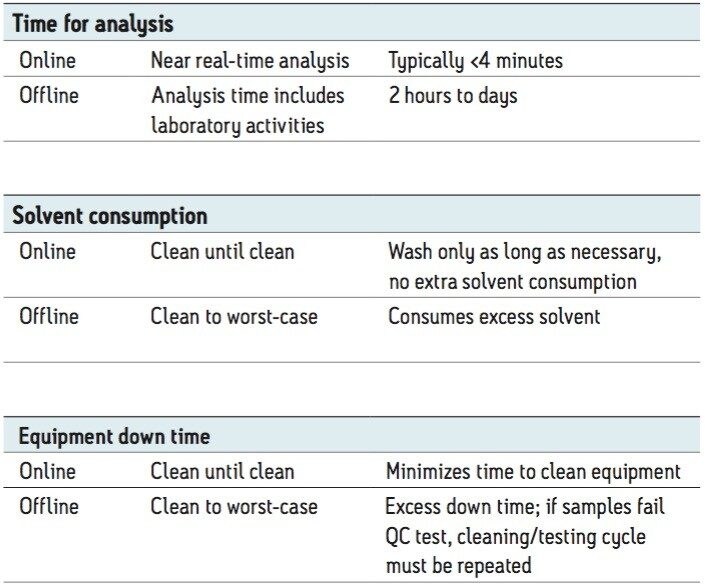
Once the cleaning method has been validated, routine equipment cleaning should be monitored. Typically, samples (either swabs or wash solvents) are taken to an offline quality control (QC) laboratory for analysis. The time it takes to receive results from the offline laboratory can range from hours to days. During this time, the production equipment must sit idle. If laboratory results are positive for API residues, the cleaning process and subsequent offline QC testing must be repeated, increasing the amount of time the manufacturing equipment sits idle.

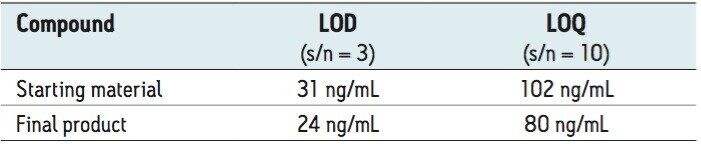
An analytical method is required that can simultaneously monitor all of the components present in the production equipment at the required safety levels. The acceptance criteria for API residues vary according to the potency of a drug substance. In general, most processes aim to have a low safety limit in the 10 ppb to 1 ppm range (10 ng/mL to 1 μg/mL). In order to achieve these limits, sensitive analytical techniques are required.4

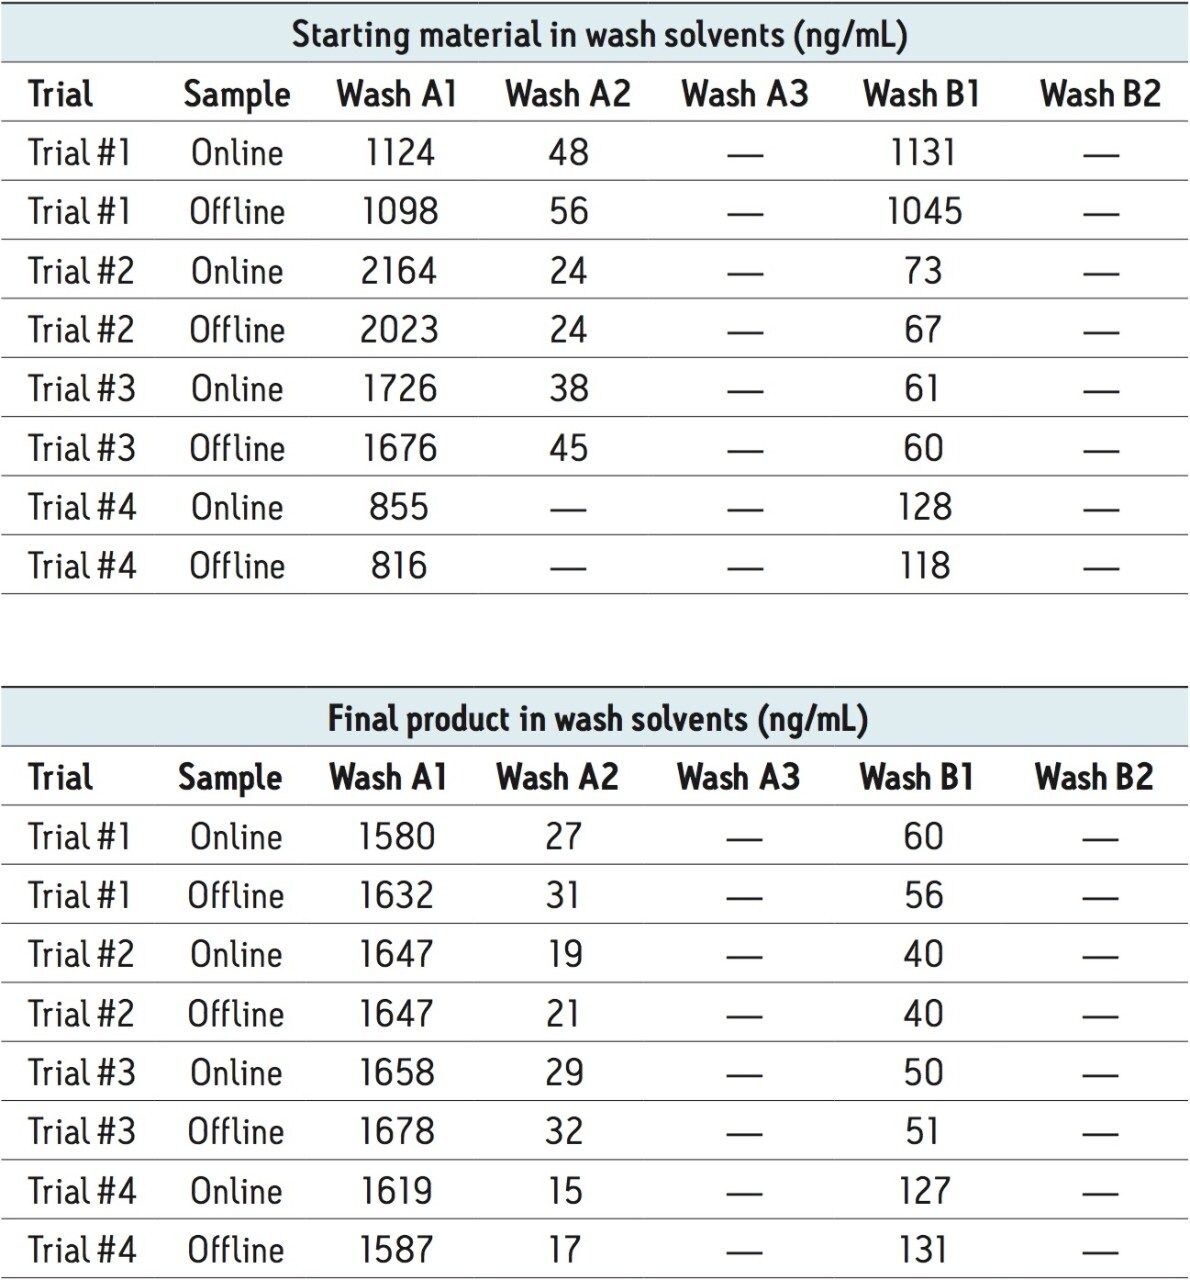
This application note describes a fast, online, UltraPerformance LC (UPLC) method that monitors wash solvents directly from a sampling point on manufacturing equipment. By monitoring wash solvents online, the point at which the API has been removed from the production equipment can be determined. This can reduce the volume of wash solvent required, particularly on equipment that is used for multiple APIs and where a cleaning procedure was developed against the “worst case.” By gaining a better understanding of the cleaning procedure and reducing the dependency on offline QC results, the time that the equipment must be taken offline for cleaning and verification can be substantially reduced.

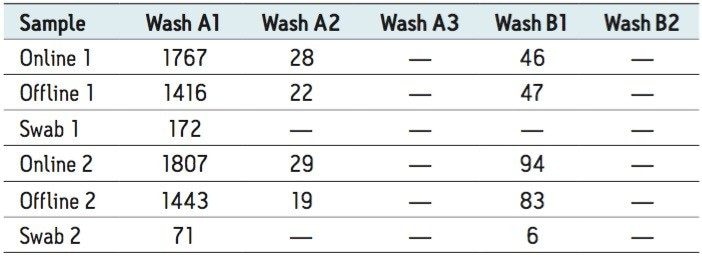
The results from the online method are compared to those obtained by testing swabs and wash solvents at an offline UPLC system. The PATROL UPLC Process Analysis System, which includes integrated hardware and software, was designed to be utilized in a manufacturing environment - with its mobile system enclosure - and provides near real-time analysis of in-process samples, both online and atline.

Experimental

Chromatographic conditions

LC systems:

PATROL UPLC Process Analysis System ACQUITY UPLC System (for offline comparisons)

Column:

ACQUITY UPLC HSS T3, 1.8 μm, 2.1 mm x 50 mm

Column temp.:

50 °C

Flow rate:

1.0 mL/min

Mobile phase:

75:25 Water/acetonitrile + 0.1% formic acid

Injection volume:

1 μL

Needle wash:

70:15:15 Acetonitrile/ isopropanol/water

Wavelength:

230 nm

Data rate:

10 Hz

Time constant:

0.2 s (normal)

Run time:

1 minute

Reaction conditions

Cleaning was performed on reaction vessels used for the conversion of acetylsalicylic acid (ASA) to salicylic acid.5 A solution of 0.3 g/L ASA in water was prepared in a 1-L reaction vessel. Nitric acid (10 mL) was added to the reactor, which was placed in a heated bath at 75 °C. After 2 hours the temperature was reduced to 7 °C, and after 2 additional hours the reactor was removed from the bath. The reactor was then emptied in preparation of cleaning.

Cleaning procedure

The final cleaning procedure included three wash steps using 100 mL of 50:50 water/methanol to clean the inside of the reactor, and two wash steps to clean the exit port of the reactor using 200 mL of the same solvent. Wash solvents, after each step, were sampled and analyzed to monitor the cleaning progress. Swabs were used to assess the reactor cleanliness throughout the procedure and also after the final cleaning step to ensure levels were below acceptable limits.

Quantitative methodology

Calibration curves for the starting material and final product were based upon four standards at levels ranging from 10 ng/mL to 50 μg/mL, depending on which step in the cleaning process was being assessed. The linear range was determined by analyzing 12 standards across the entire concentration range. The limit of detection (LOD) was defined as s/n=3 and the limit of quantification (LOQ) was defined as s/n=10.

Results and Discussion

Chromatographic method


A fast isocratic method was developed for online monitoring of the wash solvents. The final method had a 60-second run time with an inject-to-inject cycle time of 160 seconds, resulting in near real-time analysis. The method provided excellent resolution of the starting material, final product, and the two critical process impurities. An example of the chromatography for a standard and the first reactor wash step are shown in Figure 1.

Figure 1. Example chromatograms for a standard (A); and the first wash step (B) containing starting material, final product, and two process impurities.

Limits of detection/quantification and linear range

To ensure that the method met sensitivity requirements and that the linear range was sufficient to quantify across the required range, a calibration curve was generated from 10 ng/mL to 50 μg/mL. The calibration curve used a 1/x weighting to ensure good quantification at low concentration levels. Exceptional linearity was observed with R2 values in excess of 0.999 for the curve, which extended across more than three orders of magnitude (Figure 2). The final method had excellent limits of detection, as low as 24 ng/mL (Table 1). LOD and LOQ were determined by plotting amount versus s/n for the low-level standards. For each analysis, only 1 μL was injected on column, indicating the method was sensitive enough to detect levels as low as 24 pg on column. Figure 3 shows the chromatographic separation of a standard near the limit of quantitation.

Figure 2. Calibration curves for the starting material and final product (10 ng/mL to 50 μg/mL).
Figure 3. Standard injection near LOQ.

Assessing online monitoring by UPLC

To demonstrate the viability of using the PATROL UPLC Process Analysis System for the support of cleaning validation and the routine monitoring of cleaning procedures, equivalency to offline results must be determined.

A cleaning protocol for the reactor was developed and residual levels were assessed after each step by both online and offline analysis. The final cleaning procedure consisted of three wash steps inside the reactor (protocol A) and two wash steps at the outlet (protocol B). The residual levels determined by tests at each step are listed in Table 2. It is important to note that if the final product was detected by offline analysis (wash solvents or swabs), it was also detected by online monitoring. 

Table 2. Levels of final product in the wash solvents during the cleaning protocol development. Results from the online method were in agreement with offline results (both swab and wash solvent). Test performed in duplicate. Levels in ng/mL.

Additionally, if the online results indicated the equipment was clean, the subsequent offline analyses (wash solvents and swabs) also indicated cleanliness. The PATROL UPLC Process Analysis System was an extremely useful tool in developing the cleaning protocol, as the level of contamination could quickly and easily be determined at each cleaning step.

Once the final cleaning procedure was developed, the repeatability of the PATROL UPLC Process Analysis System to routinely monitor the cleaning process was assessed. The reactor was cleaned four times, and the results of online and offline monitoring were consistent for determining the presence of both the starting material and final product (Table 3). The final results indicate that if residue was not detected in the A wash steps, the inside of the reactor was clean; and if residue was not detected in the B wash steps, the outlet of the reactor was clean (as confirmed by swab analysis).

Table 3. Levels of starting material and final product (ng/mL) as determined online by the PATROL UPLC Process Analysis System and an offline method. All corresponding swabs after the final wash step were also clear.

Benefits of online monitoring by UPLC

Routine online monitoring of the cleaning procedures for manufacturing equipment is more effective than traditional offline tests. A reactor used for multiple APIs can be cleaned in-place and analyzed to ensure it meets specifications rather than over-washing to “worst-case,” which utilizes excess solvent and time. It also eliminates the risk of equipment failing, repetitive cycles of offline QC testing, and sitting idle while the cleaning procedures are repeated. In addition, eliminating the need for manual swabbing or sampling reduces the potential exposure of users to hazardous materials.

Conclusion

  • The results obtained by online monitoring with the PATROL UPLC Process Analysis System were consistent with those determined by offline analysis.
  • The online system was able to monitor low ng/mL levels required to support cleaning validation.
  • The large linear dynamic range of the PATROL UPLC Process Analysis System provides the means to monitor process reactions at high concentrations and monitor the low levels required for cleaning procedures on the same instrument.
  • The PATROL UPLC Process Analysis System provides a highly effective solution to support cleaning validation and the routine monitoring of wash solvents from the cleaning of manufacturing instrumentation.
  • Use of the PATROL UPLC Process Analysis System for online monitoring reduces manufacturing equipment downtime for cleaning procedures.
  • Solvent consumption and waste disposal can be optimized with a “clean until clean” approach afforded by the online effluent analysis.
  • Worker safety during the cleaning procedure is enhanced with the online sampling of the PATROL UPLC Process Analysis System.

References

  1. Guidance for Industry: Manufacturing, Processing, or Holding Active Pharmaceutical Ingredients, FDA Draft. March 1998.
  2. Cleaning Validation in Active Pharmaceutical Ingredient Manufacturing Plants, APIC. September 1999.
  3. Guidance on Aspects of Cleaning Validation in Active Pharmaceutical Ingredient Plants, APIC. December 2000.
  4. Fountain KJ, van Wingerden M, Diehl DM. A High Throughput UPLC-MS Method in Support of Cleaning Validation Studies. Waters. June 2007; 720002171en.
  5. Jenkins T. Online Reaction Monitoring of Inprocess Manufacturing Samples by UPLC. Waters. May 2008; 720002605en.

720002993, May 2014

Haut de la page Haut de la page