• Note d'application

Two-Dimensional Liquid Chromatography for Quantification and MS Analysis of Monoclonal Antibodies in Complex Samples

Two-Dimensional Liquid Chromatography for Quantification and MS Analysis of Monoclonal Antibodies in Complex Samples

  • Sean M. McCarthy
  • Thomas E. Blé
  • Ying Qing Yu
  • JEFFREY R. mazzeo
  • Waters Corporation
Human antibody (immunoglobulin)

Abstract

Using the ACQUITY UPLC H-Class Bio System with 2D technology, a method was developed to determine monoclonal antibody concentration and mass profile from a single injection. The system delivered the necessary reproducibility in terms of retention time, recovery, and response for samples from complex matrices using both UV and MS detection.

Benefits

The Waters ACQUITY UPLC H-Class Bio System with 2D technology provides a single system approach for rapid protein titer measurement and mass profiling of proteins. This method can be used during clone selection and process scale-up to determine yield and monitor the mass profile.

Introduction

Identification, characterization, and quantification of monoclonal antibodies (mAbs) are required at many stages of biopharmaceutical research and development. The primary analytical tools for these assays are liquid chromatography coupled with UV or mass spectrometry (MS). Both techniques can be compromised by interferences in the sample matrix, including high salt concentrations, other proteins, or the components of cell culture media. 

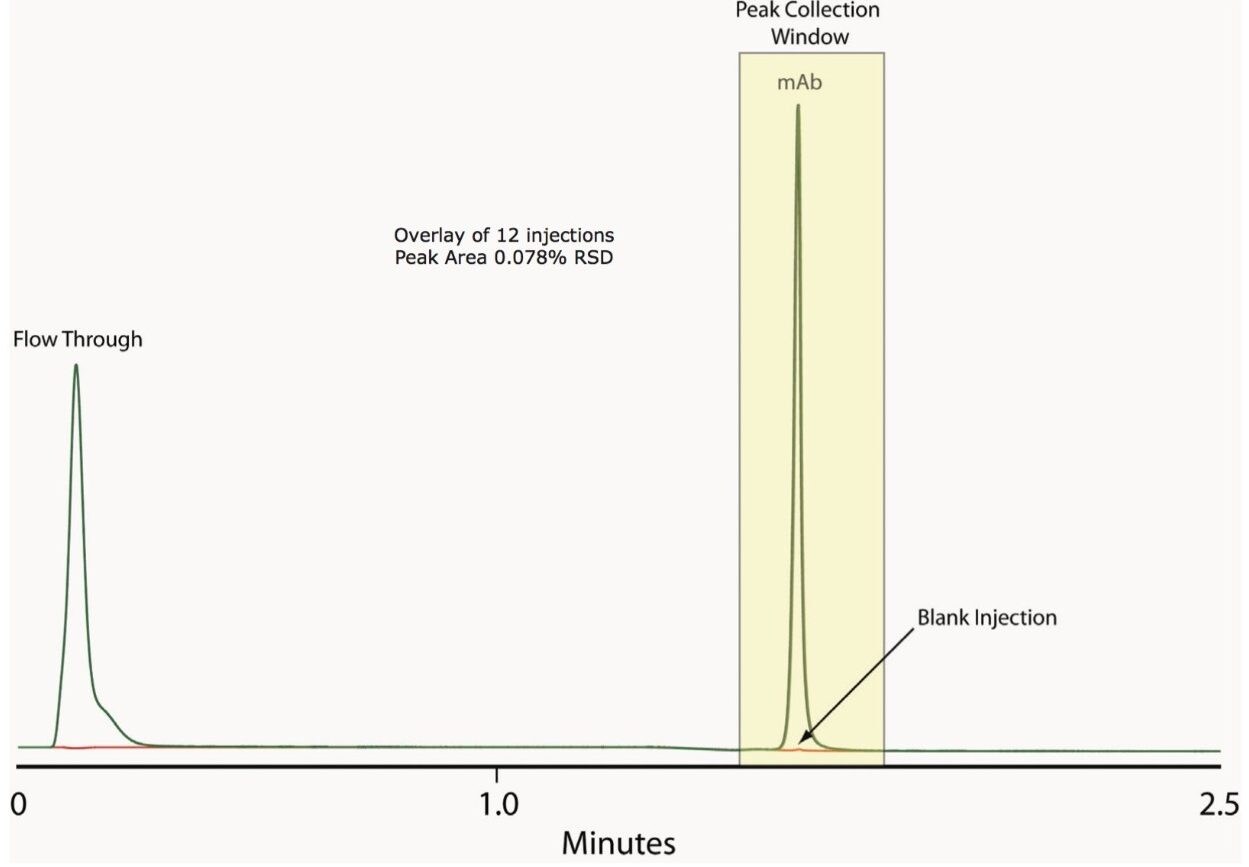
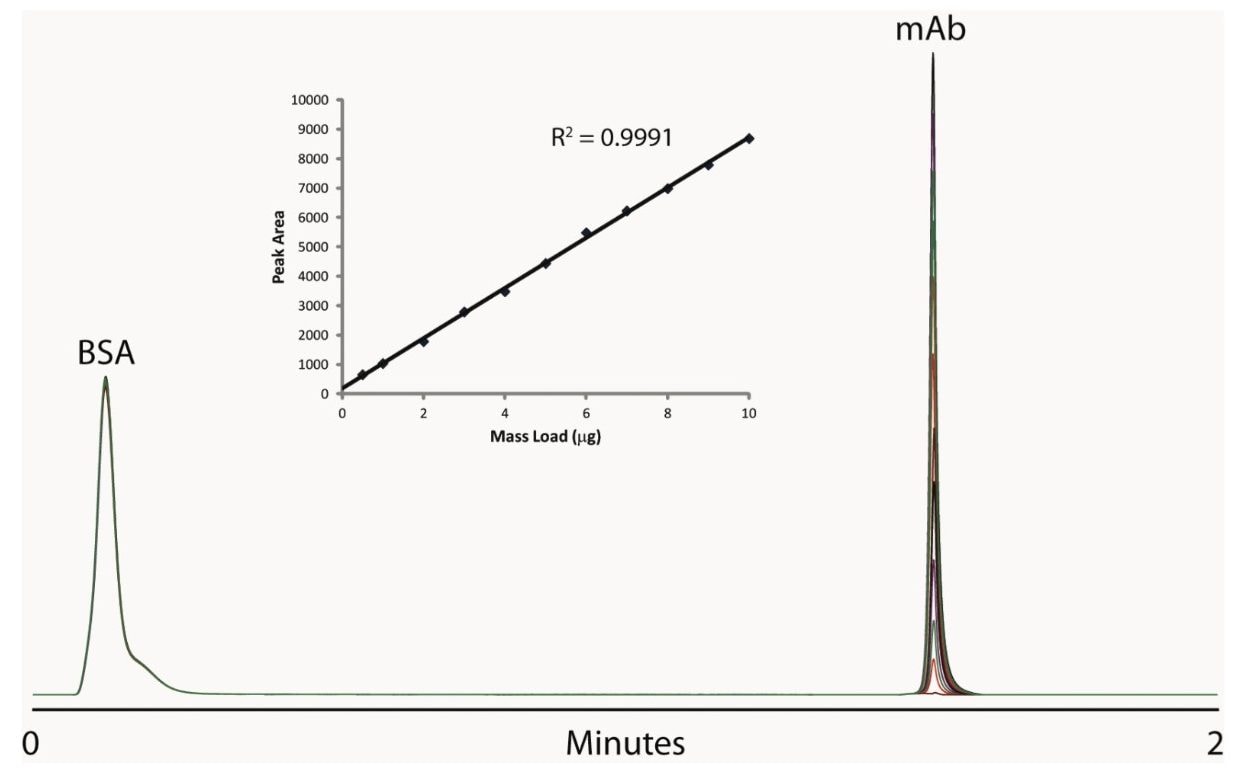
A high throughput analytical technique should combine sample preparation and chromatographic techniques to ensure accurate and robust quantification. Affinity chromatography on immobilized Protein A can be used to isolate the antibody from a complex matrix, while reverse phase (RP) LC is useful for introducing a salt-free, concentrated sample into an MS ion source. 

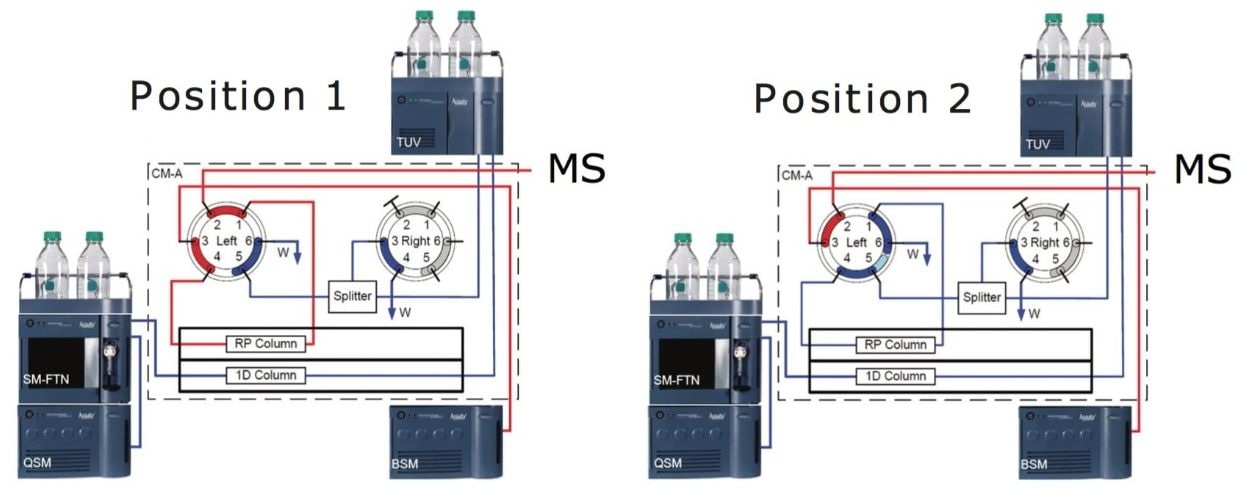
To accomplish both affinity purification and MS analysis in a high throughput manner, we utilized the ACQUITY UPLC H-Class Bio System with 2D Technology. The 2D system allows for simultaneous purification and quantification of monoclonal antibodies by Protein A affinity chromatography, and determination of mass profile by MS analysis after desalting on a short RP column. This online 2D UPLC method requires little to no sample preparation, and an analysis is quickly completed with an instrument duty cycle time of seven minutes.

Experimental

Sample preparation

Samples of trastuzumab were prepared by diluting the sample to a concentration of 1 mg/mL in DMEM cell culture media containing 1 mg/mL of bovine serum albumin (BSA). 

UPLC conditions

LC system: Waters ACQUITY UPLC H-Class Bio System with 2D Technology:

  • ACQUITY UPLC H-Class Bio Quaternary Solvent Manager (1D)
  • ACQUITY UPLC H-Class Bio Sample Manager (FTN)
  • ACQUITY UPLC Column Manager A
  • ACQUITY UPLC Tunable UV Detector
  • ACQUITY UPLC Binary Solvent Manager (2D)

First dimension

Column:

Poros A 20, 2.1 x 30 mm (Applied Biosystems)

Column temp.:

20 °C

Flow rate:

1.0 mL/min

Mobile phase A:

50 mM Phosphate Buffer, pH 7.0, 150 mM NaCl

Mobile phase B:

12 mM HCl, pH 1.9, 150 mM NaCl

Detection:

UV 280 nm

Time (min)

Flow (mL/min)

%A

%B

%C

%D

Curve

Initial

1.0

100

0

0

0

Initial

1.00

1.0

100

0

0

0

1

1.10

1.0

0

100

0

0

1

4.00

1.0

0

100

0

0

1

4.10

1.0

100

0

0

0

1

7.00

1.0

100

0

0

0

1

Second dimension

Column:

Waters MassPREP Micro Desalting Column (P/N 186004032)

Column temp.:

80 °C

Flow rate:

0.5 mL/min (desalting and regeneration), 0.2 mL/min (analysis)

Mobile phase A:

0.1% Formic acid

Mobile phase B:

0.1% Formic acid in ACN

Time (min)

Flow (mL/min)

%A

%B

Curve

Initial

0.5

100

0

Initial

1.80

0.5

100

0

6

3.50

0.5

100

0

6

3.51

0.2

100

0

6

5.00

0.2

5

95

6

5.10

0.5

100

0

6

5.70

0.5

5

95

6

5.80

0.5

100

0

6

6.40

0.5

5

95

6

6.50

0.5

100

0

6

Column manager

Initial:

Left Valve Position 1

1.5 min:

Left Valve Position 2

1.8 min:

Left Valve Position 1

MS conditions

MS system:

Waters Xevo G2 QTof

Capillary:

3 kV

Sampling cone:

45 V

Extraction cone:

2 V

Source temp.:

120 °C

Desolvation temp.:

350 °C

Cone gas flow:

0.0 L/h

Desolvation gas flow:

600.0 L/h

Results and Discussion

The ACQUITY UPLC H-Class Bio System with 2D Technology can be configured to collect a heart cut (time slice) from a first-dimension separation and divert the fraction for subsequent analysis. Determination of the correct time segment is performed experimentally by measuring the elution time of the peak of interest. The analyst can then enter timed events to control valve positions. 

The plumbing diagram shows the system configured for affinity purification followed by RP analysis for intact mass. The sample is introduced into the affinity column in position 1. Following removal of unwanted components (such as BSA and media components), the valve is switched to position 2. The antibody is eluted as a concentrated peak directly onto the head of the desalting column. After collection, the valve is returned to position 1 then the second dimension desalting and gradient are performed. 

Instrument plumbing configuration
Figure 1. Instrument plumbing configuration. The sample is introduced to the 1D column in position 1. At a specified time, the left valve is switched to position 2 to divert flow to the 2D column. After collection, the valve is returned to position 1 and the second dimension gradient is initiated. A splitter is used between the 1D and 2D to compensate for the differences in mass load needed for each analysis. The splitter can be bypassed by shunting the split flow to waste when the 1D mass load is compatible with the 2D.

In heart cut applications such as this high throughput analysis, it is important that the retention time be reproducible and and carryover be minimal to ensure accurate collection and quantification. As shown in Figure 2, the ACQUITY UPLC H-Class Bio System with 2D technology has both of these attributes. Our data shows reproducible retention time and peak area, allowing for accurate collection and quantification, with  no evidence of carryover in blank injections. We also found very good linearity over a range of mass loads, as shown in Figure 3.

Overlay of 12 1D Protein A affinity chromatograms of trastuzumab, 1 mg/mL in cell culture media (DMEM) with 1 mg/mL BSA
Figure 2. Overlay of 12 1D Protein A affinity chromatograms of trastuzumab, 1 mg/mL in cell culture media (DMEM) with 1 mg/mL BSA. Excellent reproducibility of retention time, peak shape, and peak area were found. Blank injections do not show any carryover.
Overlay of serially diluted trastuzumab, from 0.5 μg to 10 μg in cell culture media with 1 mg/mL BSA.
Figure 3. Overlay of serially diluted trastuzumab, from 0.5 μg to 10 μg in cell culture media with 1 mg/mL BSA. Response for mAb is linear over the entire mass load range. Samples run in triplicate with RSD for each mass load <0.1%. 

Important aspects of this application include the reproducibility of collection from the first dimension and reproducibility of the MS response. As demonstrated by the overlaid total ion chromatogram (TIC) traces in Figure 4, replicate injections at each mass load overlay very well, and signal intensity increases with mass load. To prevent overloading the second dimension column, we utilized a PEEK tee, shown in Figure 1, as a flow splitter to divert approximately 70% of the first dimension eluent to waste. The split flow going to waste can be shunted; thereby, diverting the entire first dimension flow to the second dimension, if necessary. 

Overlay of total ion chromatograms from desalting column for various mass loads collected from first dimension separation.
Figure 4. Overlay of total ion chromatograms from desalting column for various mass loads collected from first dimension separation.

For this application, we utilized BiopharmaLynx Software to process the data. The processed spectra for 10-μg and 0.5-μg injections on the affinity column are shown in the top and bottom panels of Figure 5. Since flow was split for each injection, the effective mass loads for each sample were approximately 3 μg and 0.15 μg, respectively. We found excellent agreement between the highest and lowest mass loads used in this application.

Automated intact protein mass deconvolution using BiopharmaLynx.
Figure 5. Automated intact protein mass deconvolution using BiopharmaLynx. Data can be batch-processed and quickly screened for mass and glycoprofile. Additionally, data can be compared to a control sample to identify and quickly assess similarities and differences between samples.

Conclusion

Using the ACQUITY UPLC H-Class Bio System with 2D Technology, a method was developed to determine monoclonal antibody concentration and mass profile from a single injection. The 2D chromatographic methods were easily defined using an inlet method editor. The system delivered the necessary reproducibility in terms of retention time, recovery, and response for samples from complex matrices using both UV and MS detection. By streamlining sample preparation and enabling high-throughput MS analysis, this online 2D UPLC system can improve a biopharmaceutical organization’s productivity in monitoring mass profiles and determining yield during clone selection and production scale-up for monoclonal antibody products.

720004304, April 2012

Haut de la page Haut de la page