This application note shows how a generic approach to sample preparation, data collection, and data processing can allow analysts to successfully locate and identify unknown adulterations in the food and beverage industries. A chemist’s time is expensive; however, extensive data review by a supervisor or senior manager is even more so. This approach also highlights the cost savings that can be achieved by minimizing the experimental setup and data analysis times.
The early identification of food or beverage adulteration can prevent costly product recalls and protect a particular brand. Constantly monitoring production or incoming raw materials by using statistical analysis of LC-MS data can rapidly identify potential adulterations. As a result,
The definition of adulteration is “To make impure by adding extraneous, improper, or inferior ingredients”.1 In many countries around the world, “adulteration” is a legal term meaning that a food product fails to meet federal, state, or national standards.
Since ancient times, producers have been willing to alter their wares in order to get the best prices for cheaper goods. Until the nineteenth century, there were very few controls in place to ensure the quality of food and beverages sold to the public. Today, food and beverage products sold publicly must by law state their contents on the packaging. However, recent examples of adulteration can still be found:
Figure 1 highlights several actions that can be considered adulteration within the food and beverage industries. Knowingly or unknowingly, adulterations are still taking place today.
In today’s food and beverage industry, many successful companies are using flavors, fragrances, and ingredients sourced from all over the world. To protect a brand, food and beverage companies must ensure that their raw materials and final products are free from adulteration. Failure to do so can result in harm to human health. An adulteration can also be financially devastating to a food company if the result is a costly product recall or even more worrisome, a loss of consumer confidence in its ‘brand’.
Various techniques are used in a quality control environment to detect known contaminants or adulterants. But how can we detect something we do not know we are looking for? How do we prevent the next food or beverage adulteration scandal?
This application note shows how a generic approach to sample preparation, data collection, and data processing can allow analysts to successfully locate and identify unknown adulterations in the food and beverage industries. A chemist’s time is expensive; however, extensive data review by a supervisor or senior manager is even more so. This approach also highlights the cost savings that can be achieved by minimizing the experimental setup and data analysis times when trying to answer the complex questions, “Is something there that shouldn’t be, and if so, what is it?”
UPLC system: |
ACQUITY UPLC with Column Manager |
Column 1: |
ACQUITY UPLC HSS T3 Column, 1.8 μm, 2.1 x 100 mm |
Runtime: |
10.0 min |
Mobile phase A1: |
Water with 0.1% formic acid |
Mobile phase B1: |
Acetonitrile with 0.1% formic acid |
Flow rate: |
0.5 mL/min |
Injection volume: |
2 μL |
SL. No. |
Time(min) |
Flow rate(mL/min) |
%A |
%B |
---|---|---|---|---|
1 |
Initial |
0.5 |
99 |
1 |
2 |
0.20 |
0.5 |
99 |
1 |
3 |
5.00 |
0.5 |
1 |
99 |
4 |
5.10 |
0.5 |
99 |
1 |
5 |
10.00 |
0.5 |
99 |
1 |
Column 2: |
ACQUITY UPLC BEH Amide 1.7 μm, 2.1 x 150 mm |
Runtime: |
15 min |
Mobile phase A2: |
50/50 Acetonitrile/ water with 10 mM ammonium formate and 0.125% formic acid |
Mobile phase B2: |
90/10 Acetonitrile/ water with 10 mM ammonium formate and 0.125% formic acid |
Flow rate: |
0.6 mL/min |
Injection volume: |
10 μL |
Weak needle wash: |
95/5 Acetonitrile/water |
Strong needle wash: |
95/5 Acetonitrile/water |
Sample loop: |
20 μL |
Injection type: |
PLUNO |
SL. No. |
Time(min) |
Flow rate(mL/min) |
%A |
%B |
---|---|---|---|---|
1 |
Initial |
0.6 |
2 |
98 |
2 |
0.20 |
0.6 |
2 |
98 |
3 |
5.00 |
0.6 |
98 |
2 |
5 |
5.10 |
0.6 |
2 |
98 |
6 |
15.00 |
0.6 |
2 |
98 |
MS system: |
Xevo G2 QTof |
Resolution: |
ESI positive |
Capillary voltage: |
2.8 kV |
Resolution: |
ESI negative |
Capillary voltage: |
2.5 kV |
Common MSE conditions |
|
---|---|
Extraction cone: |
4 V |
Cone voltage: |
25 V |
Source temp.: |
120 °C |
Desolvation temp.: |
450 °C |
Desolvation gas: |
950 L/h |
Cone gas: |
45 L/h |
Mass range: |
100 to 1200 Da |
Low energy: |
6 eV |
High energy ramp: |
10 to 45 eV |
Scan rate: |
0.2 sec |
Data collection: |
MSE centroid with lock mass applied |
Compound: |
2 ng/μL Leucine enkephalin |
Positive mode: |
556.2771 m/z |
Negative mode: |
554.2615 m/z |
Flow rate: |
20 μL/min |
Capillary voltage: |
2.8 kV |
Collision energy: |
6 eV |
Cone voltage: |
25 V |
Frequency: |
20 sec |
Milk samples were blind spiked with melamine, cyanuric acid, and a five compound mixture of human and veterinary drugs in order to mimic different adulterations. Standard spiking solutions of melamine, cyanuric acid, and the five compound mixture were prepared at a concentration of 200 μg/g in 50:50 ACN:H2O. Table 1 shows the formulas and masses of melamine, cyanuric acid, and the five compound mix.
Over a five day period, cartons of milk from the same manufacturer were purchased at a local store. A 5-mL aliquot was removed and stored at -60 °C. On day six, all of the samples were thawed. In a 20-mL scintillation vial, 1.0 g of each milk sample was weighed out. To mimic an adulteration, a person independent to the analysis spiked each sample with 52.5 μL water, or one of the 200 μg/g standards containing the melamine, cyanauric acid, or five compound mix. This provided blind spiked samples at 10 ppm, a level considered reasonable for an adulteration made for economic gain.
The samples were returned to the chemist performing the analysis and the following sample preparation protocol was followed:
To the 1.0 g of potentially spiked product:
The investigative workflow suggested for this type of analysis is shown in Figure 2. For this series of experiments, we aimed to maximize the identification of an unknown adulterant by using UPLC-MS. Following a generic sample preparation, data were collected in ESI+ and ESI- modes using both HILIC and reversed-phase chromatography. The ACQUITY UPLC BEH Amide Column has the ability to retain very polar compounds, while the HSS T3 Column can retain a wide variety of less polar compounds. Seven replicates of each milk sample provided good statistical data.
Employing an ACQUITY UPLC Column Manager (capable of holding up to four different analytical columns) allowed all of the injections for the study to be collected in a single sample list for the analyst’s convenience. For statistical purposes, replicate injections made on the same column and in the same polarity were randomized for collection (re-ordered prior to processing).
The Use of Multivariant Analysis for Early Detection of Potential Food or Beverage Adulterations 5 Following acquisition, the data were batched processed using MarkerLynx XS, a statistical analysis software application manager. Due to the variation expected within each milk sample, the information from each analysis was investigated using a PLS-DA (Projection to Latent Structures Discriminant Analysis model). Each instrument polarity and UPLC column pairing was processed separately, making a total of four analyses, with each analysis taking approximately 15 minutes to process.
MarkerLynx XS Software processing of the data in this analysis yielded the combination of plots shown in Figure 3.
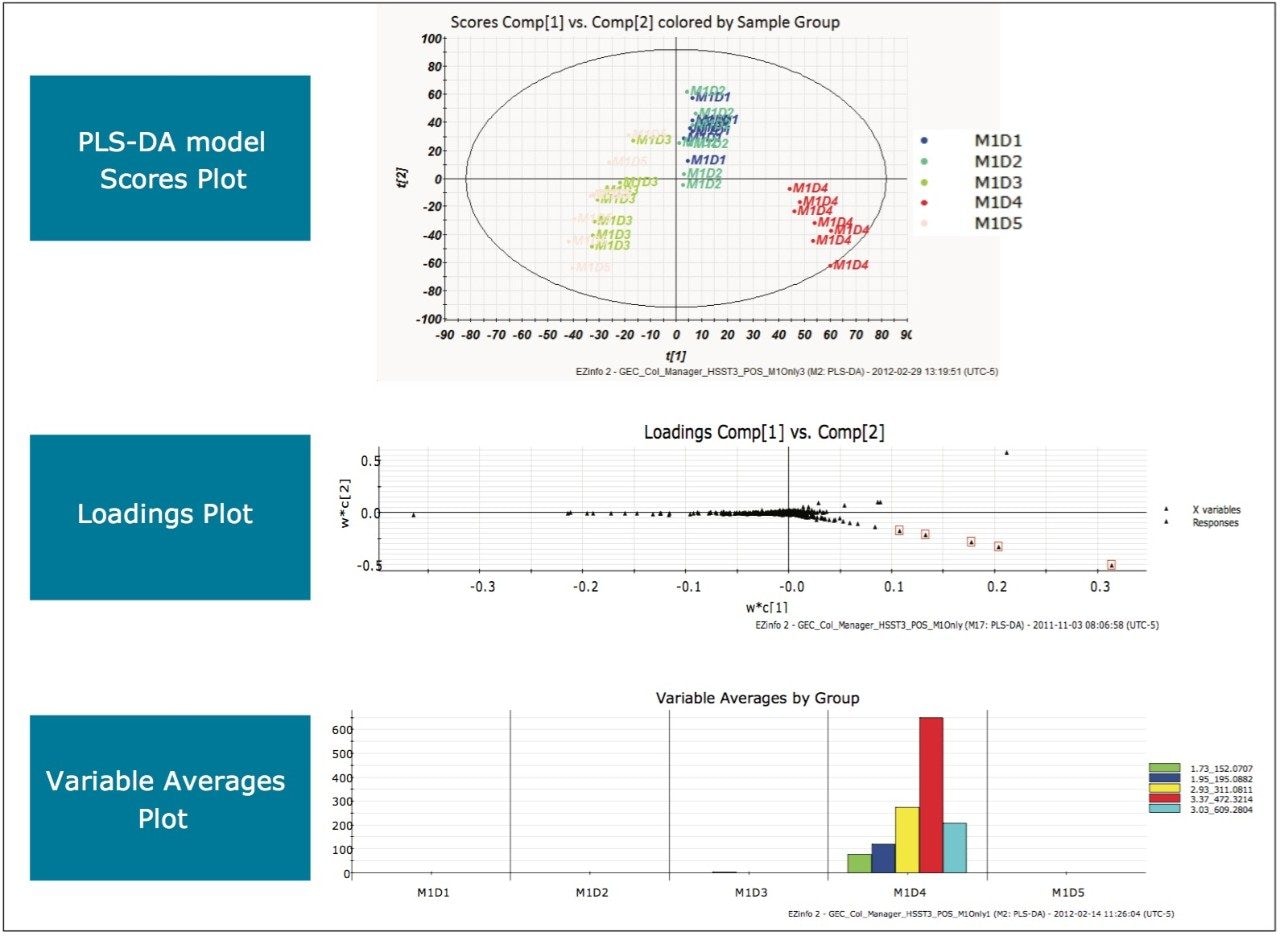
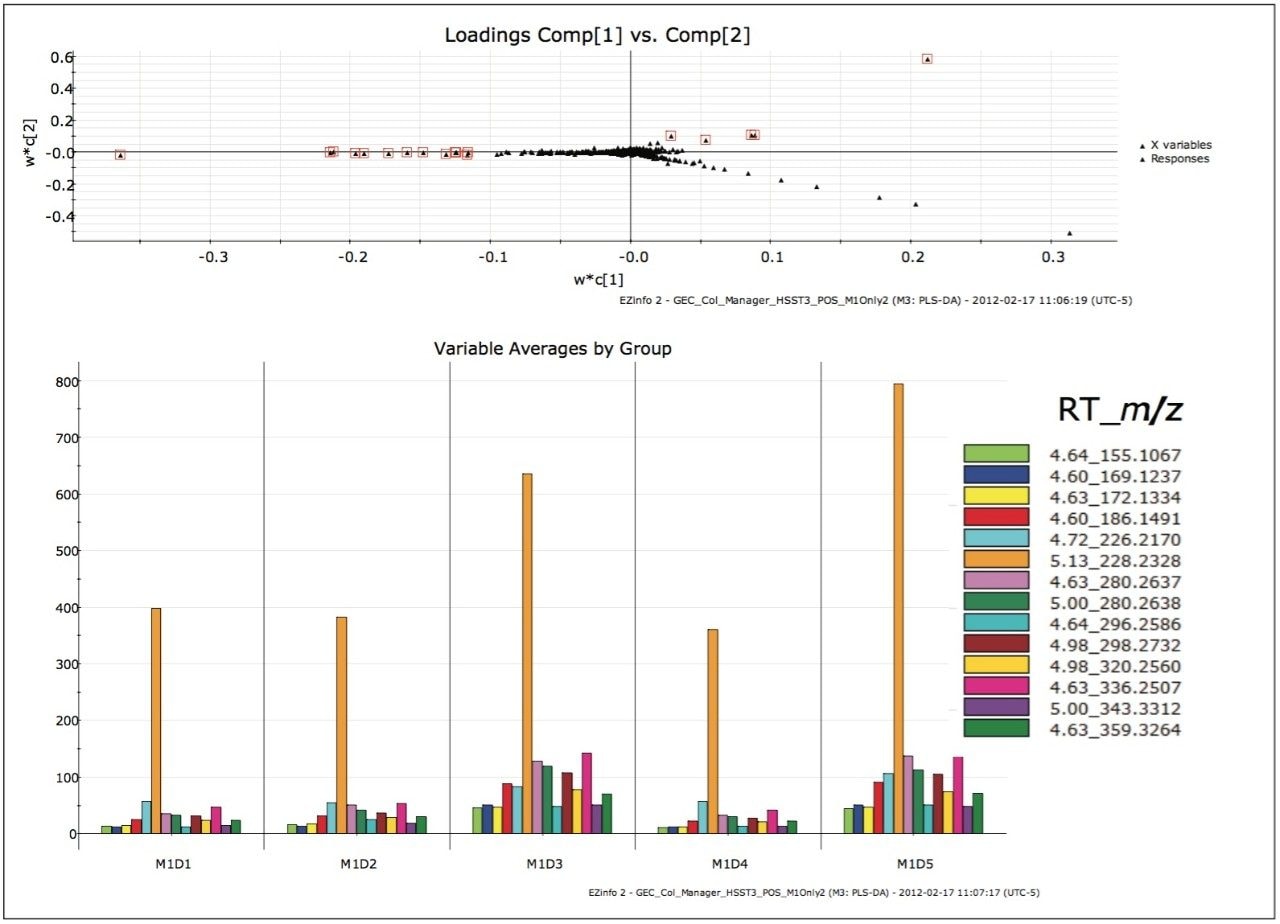
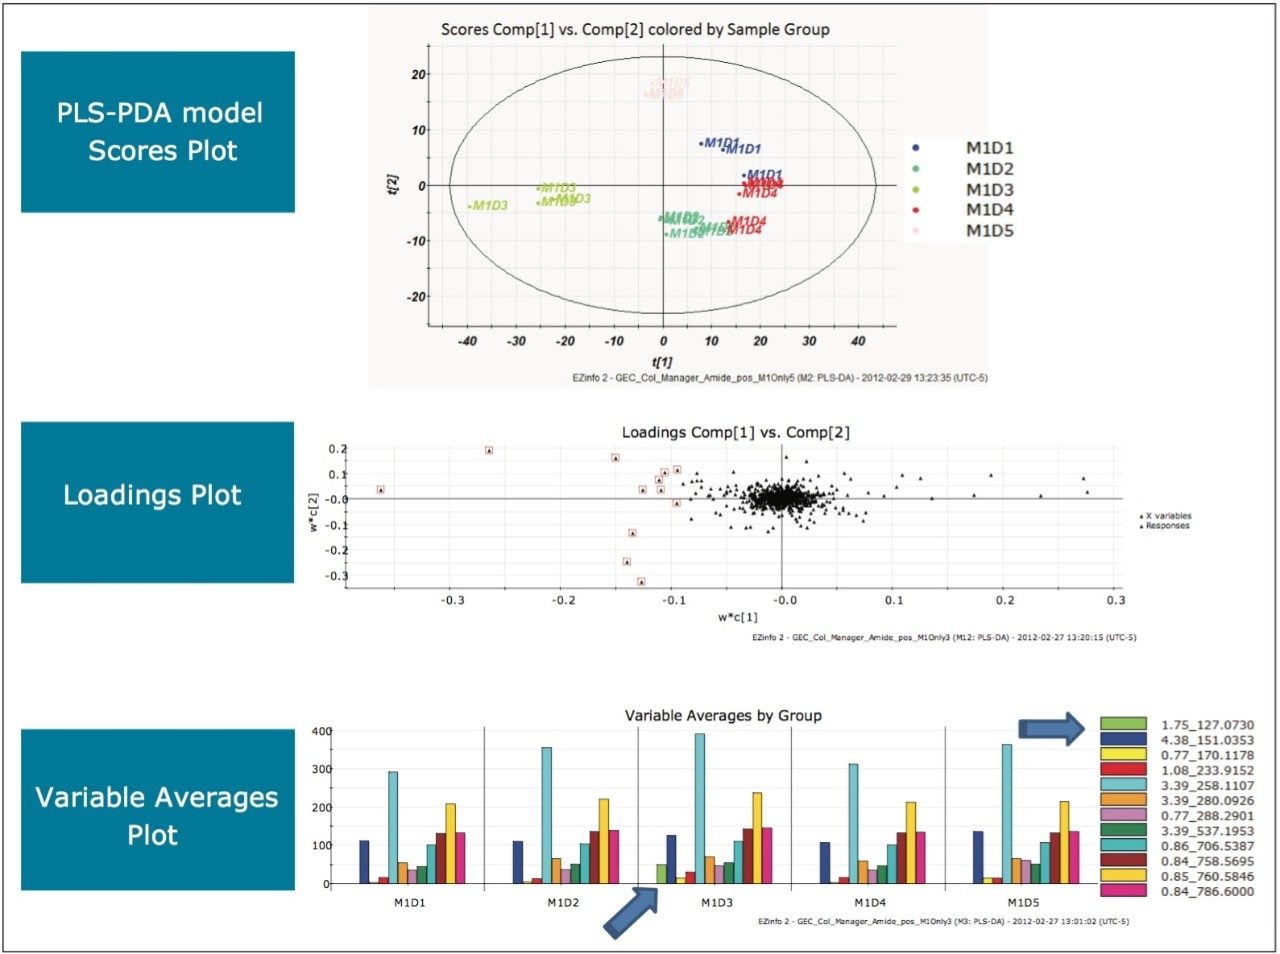
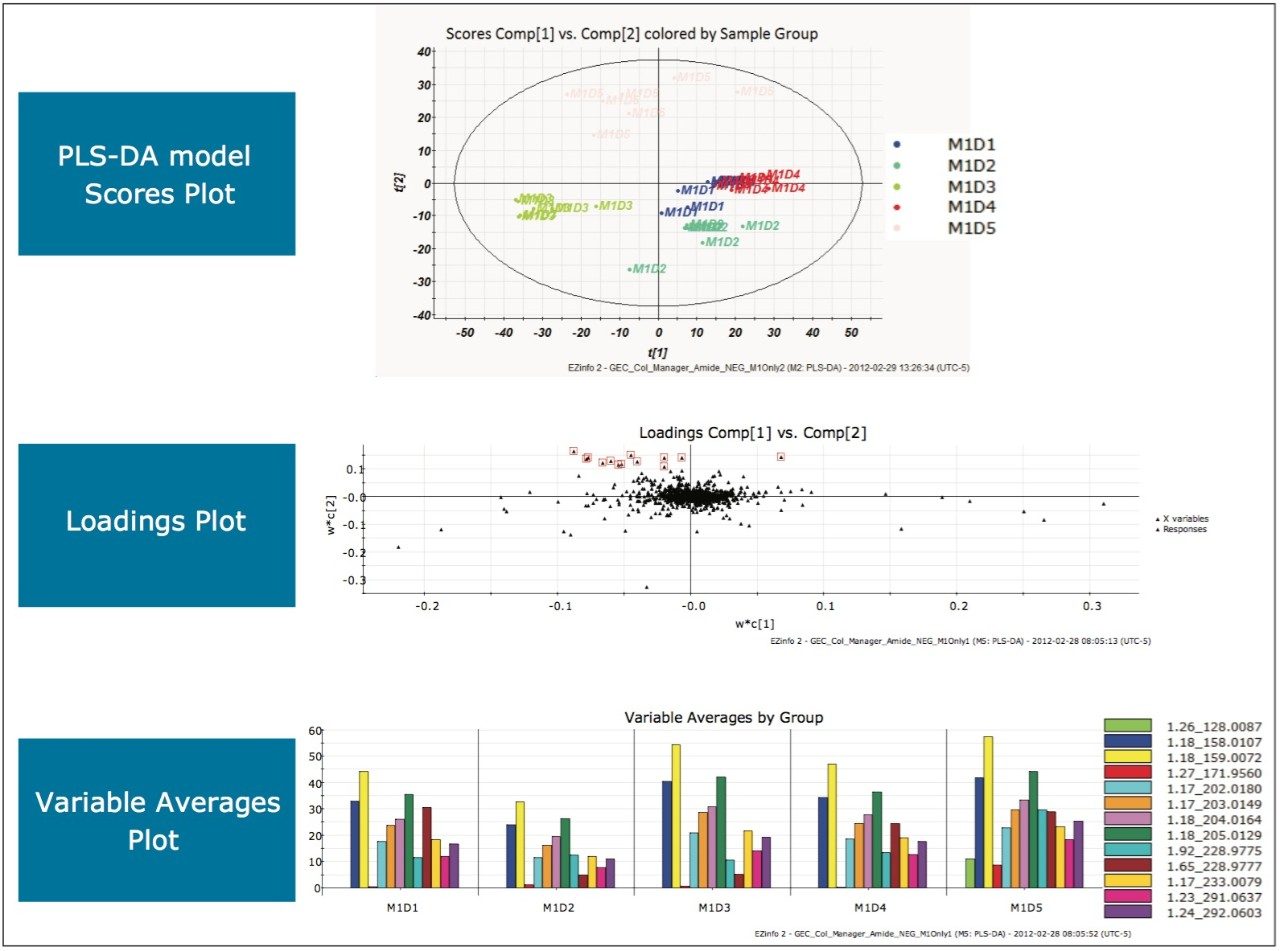
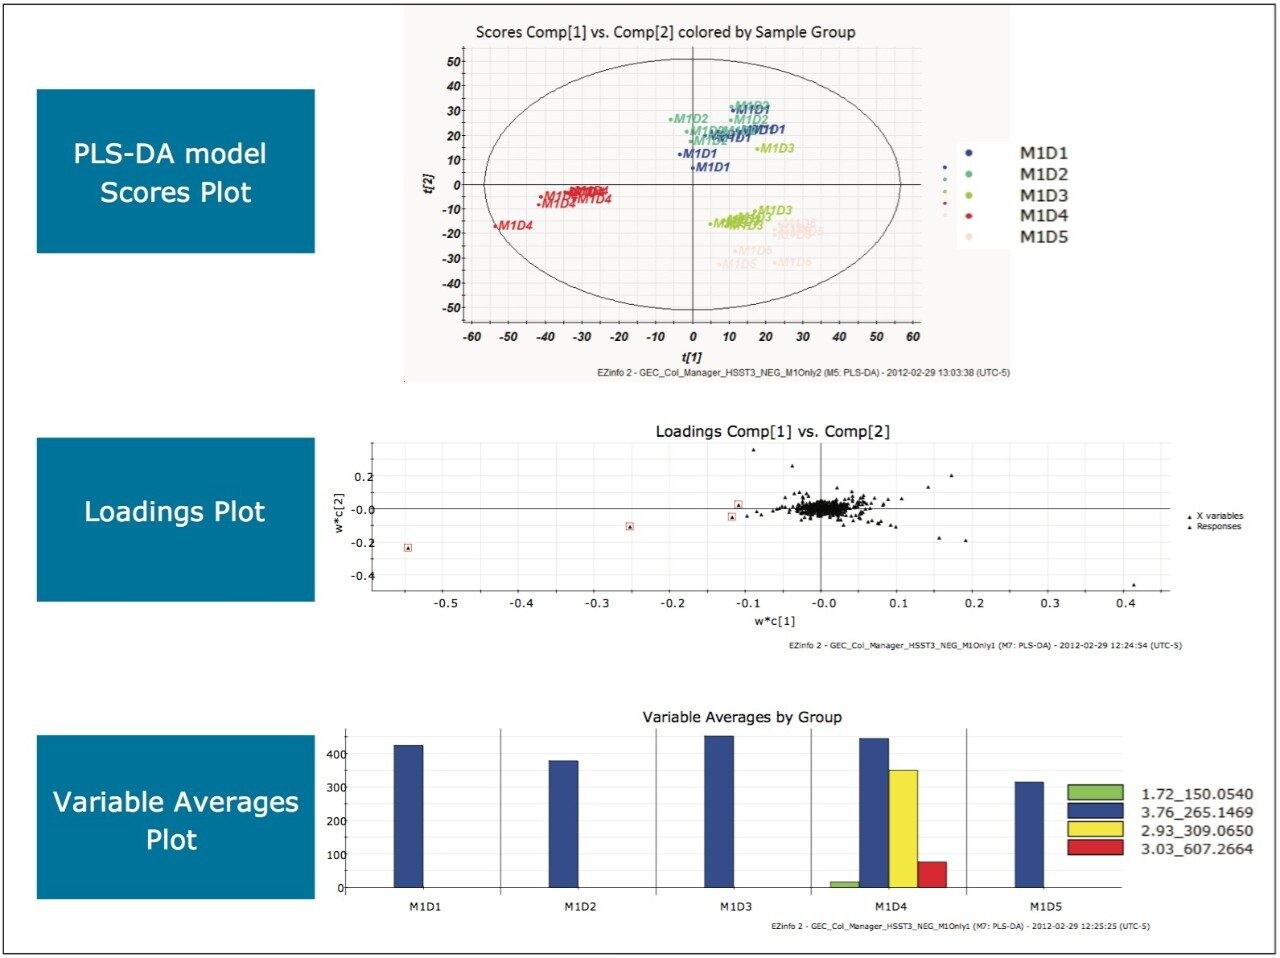
The scores plot allowed us to see a map of all the injections (observations) and ascertain which observations were similar, or near each other, and which are dissimilar, or far apart. The Exact Mass Retention Time Pairs (variables), or EMRT’s present in each injection are responsible for this similarity or variation, and are plotted in the loadings plot. A variable averages plot simply plots the average intensity of an EMRT found in all replicate injections for each group. Using Figure 3 as an example, we can see from the scores plot that something is different about M1D4 (Milk 1, Day 4), as compared with the milk on the other four days (M1D1, M1D2, M1D3, and M1D5). It stands true that M1D1 and M1D2 look tightly bound and something looks different about M1D3 and M1D5, but for now, the eye is drawn to the biggest difference of M1D4.
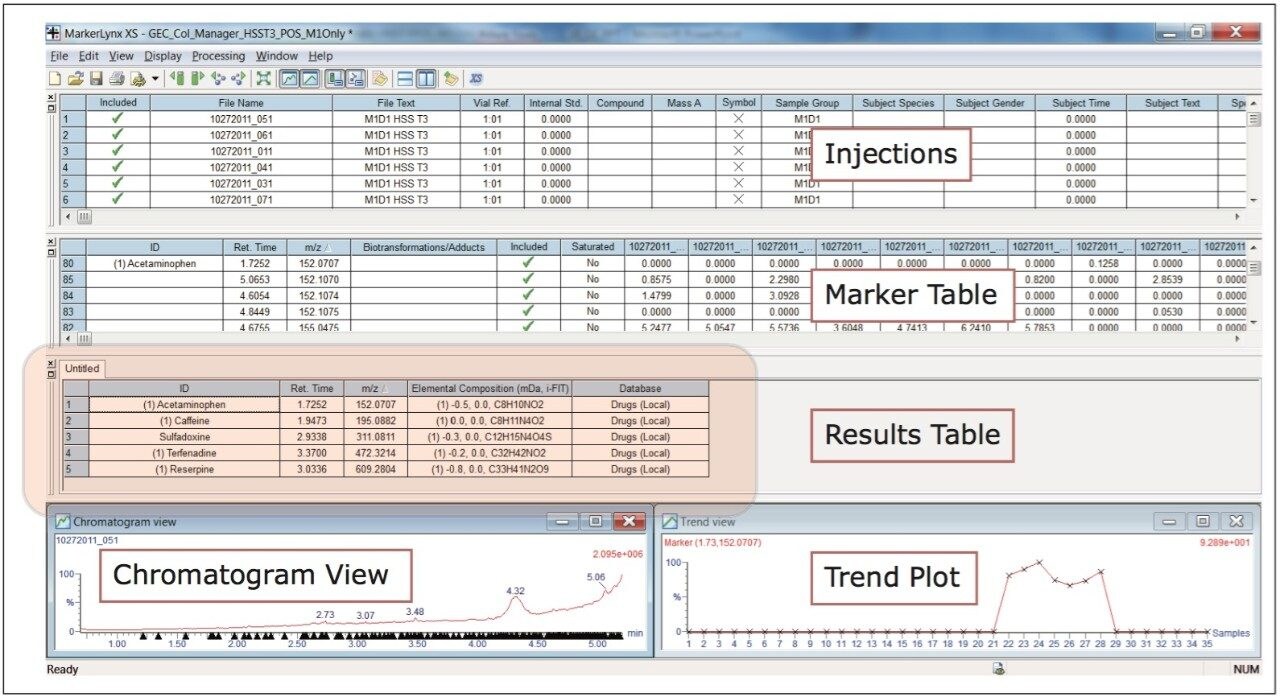
In the loadings plot, EMRTs found in all injections at the same level tend to reside in the center of the axis, in the swarm. The scores plot and loadings plot may be superimposed. The EMRTs responsible for causing M1D4 differences in the scores plot are found in the same quadrant, furthest away from the swarm. Highlighting these points provides the best chance of identifying an unknown contamination or adulterant. The variable averages plot is summoned from the highlighted points in the loadings plot. This shows that five compounds present in the milk on Day 4 are absent on all the other days, a very good indication of an adulteration. Transferring the EMRTs to the MarkerLynx XS browser allows Elemental Composition and a database search to be performed on the low energy function of the MSE data. The results are shown in Figure 4.
The proposed elemental composition and local database identification of the five EMRTs were an exact match to the five compound mixture in Table 1. This indicated an adulteration of the five compound mixture was made to the milk on Day 4. Proposed formulas from Elemental Composition were also searched against in ChemSpider http://www.chemspider.com/. Using the high energy function of the MSE data, and MassFragment Software, several key fragments with good mass accuracy were matched to the proposed compounds, which gave added confidence that correct assignments were originally made in the MarkerLynx XS Browser. Figure 5 shows possible structures assigned to key exact mass fragments for the component proposed as caffeine.
To complete the workflow shown in Figure 2, confirmation would usually be obtained by running purchased standards in MS/MS mode, and comparing the retention times and MS/MS data to the high energy data in the MSE acquisition. This was deemed unnecessary for the work presented here – but would be an important stepin the structural elucidation of an unknown compound.
Remaining outliers in other quadrants in the ESI+, HSS T3 analysis were also investigated, as shown in Figure 6. From the variable averages plot, it can be observed that every highlighted EMRT was present in all of the milk samples. Variations of component concentration in each milk sample gave rise to the differences in the position of the EMRTs in the loadings plot. Since a contamination or adulteration would be expected to be absent in a “normal sample”, these EMRTs were not investigated further.
MarkerLynx XS processing of the data in this analysis yielded the combination of plots in Figure 7. Based on the separation of the milk sample on Day 3 (M1D3) from the rest of the days, the outlying points on the left were highlighted in the loadings plot as shown. From the variable averages plot produced, a unique EMRT, 1.75_127.0730 (green), was observed in the milk on Day 3, as denoted by the arrows.
After transferring the marker to the MarkerLynx XS Browser and performing elemental composition, a database search indicated that the milk on Day 3 was adulterated with melamine (1,3,5-triazine-2,4,6-triamine), as shown in Figure 8.
To complete the ESI+, BEH Amide analysis, the remaining outliers in the other quadrants were also investigated, shown in Figure 9. Again, from the variable averages plot, we saw that all significant EMRTs highlighted in the loadings plot were present in the milk samples on all five days. This indicated that no further adulteration could be detected in this analysis.
Repeating the MarkerLynx XS Software processing steps performed in the previous two analyses on the data gathered in electrospray negative mode on a BEH Amide Column yielded the plots shown in Figure 10. Complete separation of milk injections made on Day 5 in the scores plot indicated that milk on Day 5 was different from the other days. Highlighting the EMRTs responsible for this difference and viewing the variable averages plot showed the presence of a unique EMRT, 1.26_128.0087 (green), on Day 5 that was absent on all other days. After transferring the marker to the MarkerLynx XS browser and performing elemental composition, a database search, shown in Figure 11, indicated that the milk on Day 5 was adulterated with cyanuric acid (1,3,5-triazinane-2,4,6-trione).
The Use of Multivariant Analysis for Early Detection of Potential Food or Beverage Adulterations 12 The remaining outliers from other quadrants in the loadings plot were investigated. Again, from the variable averages plot (data not shown) all significant EMRTs were present in the milk samples on all five days, indicating no further adulteration within this analysis.
Following the same processing steps for this analysis generated the scores plot, loadings plot, and variable averages plot shown in Figure 12.
720004327, May 2012