• Application Note

Comparative LC-MS for Qualitative and Quantitative Proteomic Analysis of Tomato-Fungus Interaction

Comparative LC-MS for Qualitative and Quantitative Proteomic Analysis of Tomato-Fungus Interaction

  • Twan America
  • Hans Vissers
  • Waters Corporation
  • Center for Biosystems Genomics, Plant Research International

Abstract

A quantitative proteomics experiment was conducted on the extracellular liquid collected from tomato (Lycopersicum esculentum) plants during a time course of fungal infection. Susceptible plants as well as plants resistant to the fungus Cladosporum fulvum were inoculated with fungal spores. Extracellular liquid was collected by vacuum infiltration at several time points after inoculation. The extract was desalted, lyophilized, digested and the complete peptide mixtures analyzed by LC-MS.

*Note: nanoACQUITY UPLC applications readily transfer to the ACQUITY UPLC M-Class System

Benefits

  • ExpressionE label-free comparative nanoscale UPLC-MSE has been applied to the qualitative and quantitative proteomics analysis of the extracellular liquid of tomato to study the interaction between tomato and fungi.
  • Statistical data analysis techniques have been employed to assess data quality, significant differences between conditions, and the identification of regulated proteins and peptides.
  • Targeted and non-targeted label-free LC-MSE analysis have been used to identify and quantify differences between resistant and susceptible tomato fruit cell lines.

Introduction

A quantitative proteomics experiment was conducted on the extracellular liquid collected from tomato (Lycopersicum esculentum) plants during a time course of fungal infection, Figure 1. Susceptible plants as well as plants resistant to the fungus Cladosporium fulvum were inoculated with fungal spores, Figure 2. Extracellular liquid was collected by vacuum infiltration at several time points after inoculation. The extract was desalted, lyophilized, digested, and the complete peptide mixtures analyzed by LC-MS.

In the six-condition sample set – using a 90 min nanoscale LC-MS gradient – significant biological differences between the investigated conditions were detected. Quantitative data were analyzed by various statistical analysis techniques. Peptides that were found to be selective – or unique – for the different time points of the infection process were selected. The identification of the deconvoluted elevated-energy MS spectra were validated by repeat acquisition of selective MS/MS spectra using a data dependent acquisition experiment using an include list. In addition, peptides not identified within the specified databases were de novo sequenced and identified by means of BLAST queries.

Experimental

Sample preparation

The extracellular liquid – the so-called apoplast – was collected by vacuum infiltration with distilled water. The apoplast extract was freeze-dried, dissolved in water, and desalted by means of size-exclusion. The protein-containing fractions were collected, freeze-dried, resolubilized in buffer containing 8 M urea, and the total protein concentration determined. An aliquot of 100 μg protein was taken and the volume corrected, treated with DTT and IAA, and diluted with ammonium bicarbonate solution to a final concentration of 1 M urea. Trypsin was added and incubated at 37 °C overnight. Digestion was stopped by addition of TFA in water. The protein digest was concentrated and desalted over a small SPE column and eluted with 50% acetonitrile 1% TFA. The eluate was freeze-dried and solubilized in 100 μL 0.1% TFA 5% ACN. Samples were diluted with 0.1% formic acid to an appropriate final working concentration prior to analysis. Finally, an aliquot was taken and a protein digest of yeast Enolase was added as internal quantification standard prior to injection for LC-MS analysis.

LC conditions

LC-MS identification and quantification experiments were conducted using a 1.5 hr reversed-phase gradient at 250 nL/min (5 to 40% acetonitrile over 90 minutes) on the Waters IdentityE High Definition Proteomics System, using as an intlet the nanoACQUITY UPLC System and an Atlantis 3 μm C18 NanoEase 75 μm x 15 cm nanoscale LC column. Samples – three time points of a resistant and susceptible tomato line, respectively – were run in triplicate.

MS conditions

The IdentityE System also included the Q-Tof Premier Mass Spectrometer, which was programmed to step between normal (5 eV) and elevated (25 to 40 eV) collision energies on the gas cell, using a scan time of 1.5 s per function over m/z 50 to 1990, Figure 3.

Figure 3. LC/MSE alternating scanning principle using nanoACQUITY UPLC and Q-Tof Premier and subsequent alignment of the low and elevated energy ions with IdentityE System software.

Data processing and protein identification

Protein identification, data alignment, and quantitative information were generated by the use of the IdentityE System’s dedicated algorithms and peptide ion accounting informatics as well as searching various plant and fungi specific databases, Figure 3.

Additional statistical and clustering data analysis – based on the comma-separated values output from the ExpressionE informatics software – was performed with Decisionsite (Spotfire), Excel (Microsoft) and GeneMaths (Applied Maths).

Results and Discussion

Data quality analysis

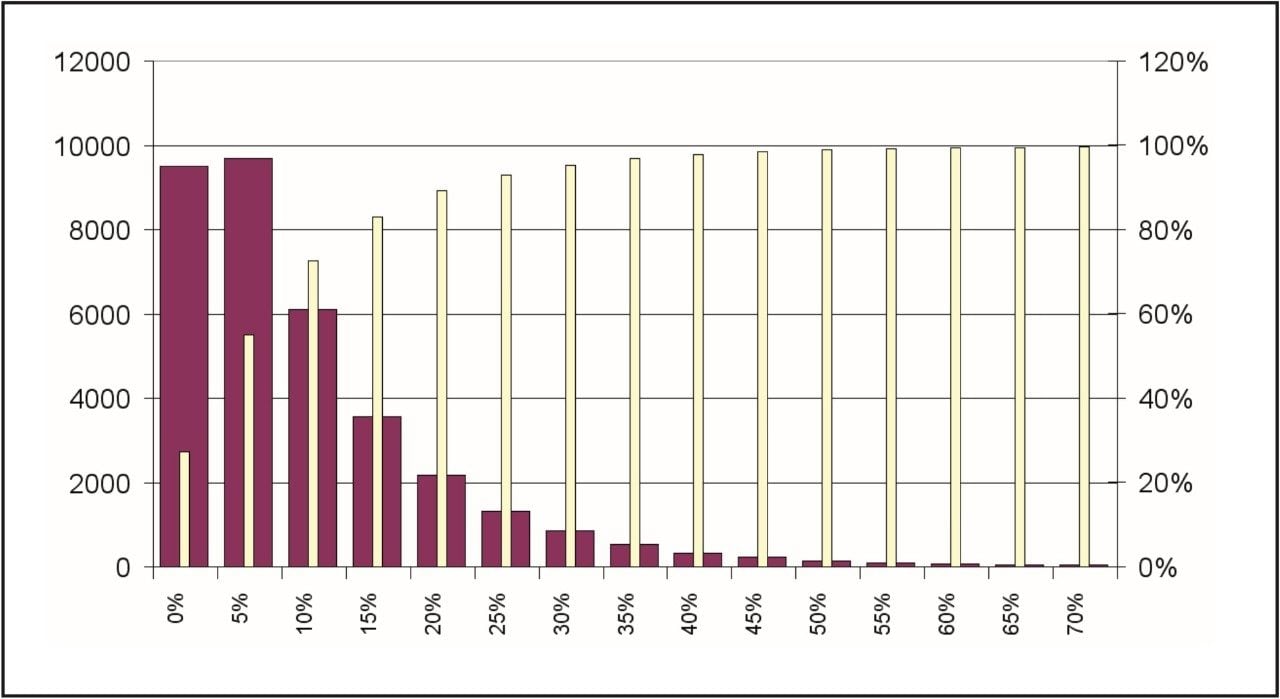
Figures 4 and 5 summarize the quality of the acquired data for the analysis of quantitative label-free proteomics experiments. Figure 4 shows the distribution of coefficient of variation of the accurate mass/retention time cluster intensities across all injection and conditions. The coefficient of variation of the majority (~ 70%) of the clusters – as indicated by the cumulative yellow bar – was found to be better than 15%, which indicates good consistency between injections and suitability for further quantitative analysis.

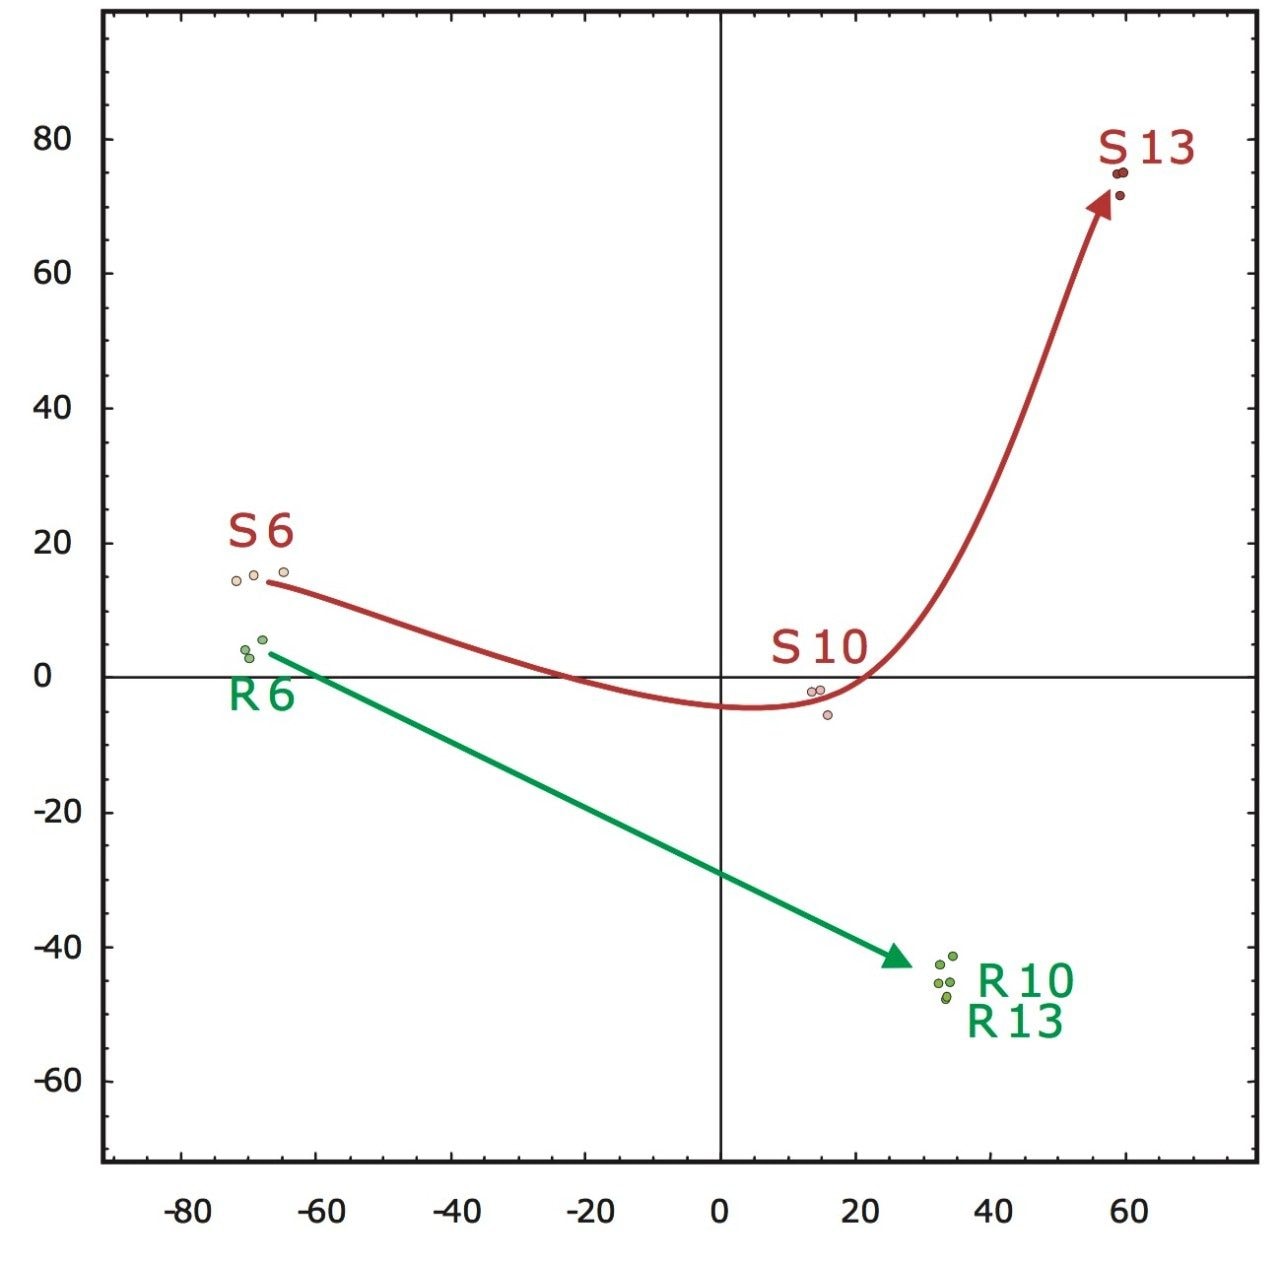
A second approach would be the analysis of the accurate mass/retention time pair clusters by means of principal component analysis (PCA) of which the final result is shown in Figure 5. The first two principal components can be related to incubation time (x-axis) and fungal growth (y-axis). The triplicate injections cluster extremely closely to one another, agreeing with the earlier observed reproducibility of the intensities of the peptides as shown in Figure 4.

Figure 5 also illustrates that the samples from the resistant line are very similar in their peptide composition after 10 and 13 days of fungal inoculation. This is in agreement with biological findings as the fungus will not proliferate in the resistant tomato plant due to defense response after infection. This in contrast to the susceptible line, where protein changes continue after 10 days of inoculation as result of fungal growth. Many fungal secreted proteins are detected in the later time point samples S10 and S13. Again – for all samples – the replicate injections cluster closely together, indicating good data consistency.

Figure 4. Intensity coeffecient of variation distribution of the accurate mass/retention time clusters. Red bars = coefficient of variation per variation bin. Yellow bars = cumulative distribution.
Figure 5. PCA – 2log scale transformed normalized peak amplitude data – of accurate mass/retention time clusters (GeneMath). S = suspectible line; R = resistant line (number = days of incubation).

The elevated-energy portion of the data set was used for peptide identifications. An example identification of Phialide – a known and previously identified Cladosporium fulvum elicitor – is shown in Figure 6.

Figure 6. IdentityE identification of Phialide (Cladosporium fulvum elicitor) from the susceptible tomato line after 10 days of inoculation.

Multiple peptides were identified of the protein Phialide. The total sum of the intensities of the peptides, obtained from the low energy portion of the data and expressed as deconvoluted areas, are shown in Figure 7. The Phialide concentration is noticeably higher in the susceptible line samples and increases over time. This is to be suspected – and confirmed by means of 2D gel/peptide mass fingerprint analysis – as the protein is secreted by the growing fungus, while proliferating in the susceptible plant.

Figure 7. Intensity of the peptides identified with IdentityE to Phialide for the six investigated conditions.

The non-targeted approach described allowed for the identification of a number of pathogen response related, avirulence (Avr) and extracellular (Ecp) proteins in the investigated conditions/ samples. However, the protein amino acid sequence databases for Lycopersicum esculentum and Cladosporium fulvum are not complete. Therefore, complementary targeted approaches were employed as well. Either binary comparisons or multi-variant analysis were used to select differentially expressed peptides between two or multiple conditions.

Examples of the binary comparison are shown in Figures 8 and 9. Figure 8 shows the log intensity of the accurate mass/retention time clusters of sample S13 and R13 – susceptible and resistant line after 13 days on inoculation, respectively. Clusters significantly deviating from the main diagonal are either up- or down-regulated in one of the conditions. These clusters are subsequently used to generate an include list for a targeted data directed analysis LC-MS/MS experiment. The sequence annotation of the obtained spectra – either via a database search or via de novo sequencing – allow for the conformation of proteins and peptides identified through the MSE untargeted fragmentation or poorly represented species.

Figure 9 shows the identification of an up-regulated peptide in the R13 vs. the S13 samples. These types of results are subsequently linked back with the ExpressionE informatics software to the low energy data for relative intensity comparison of all identified peptides and concurrent parent proteins.

Figure 8. Log-Log intensity visualization of accurate mass/retention time clusters of the susceptible (x-axis) and resistant (y-axis) tomato fruit lines after 13 days of incubation.
Figure 9. Targeted data directed analysis LC-MS/MS experiment driven by an include list selection based on the clustering results shown in Figure 8. This example shows the MS/MS identification of pathogenesis related defense protein P2 of tomato.

Conclusion

  • Principal component analysis (PCA) can be applied to both the low and elevated energy data sets to rapidly assess data quality and identify trends in the data set.
  • Various pathogen response related proteins have been identified and quantified in the resistant line and avirulence (Avr) and extracellular (Ecp) fungal proteins in the susceptible line.
  • Quantitative non-targeted LC-MSE and qualitative targeted LC-MS/MS experiments provide confirmative and complementary information.

References

  1. J.C. Silva, R. Denny, C.A. Dorschel, M.V. Gorenstein, I.J. Kass, G.-Z. Li, T. McKenna, M.J. Nold, K. Richardson, P. Young and S.J. Geromanos. Quantitative Proteomic Analysis by Accurate Mass Retention Time Pairs. Anal. Chem. 2005, 77, 2187
  2. J.C. Silva, M.V. Gorenstein, G.-Z. Li, J.P.C. Vissers and S.J. Geromanos. Absolute Quantification of Proteins by LC/MSE; a Virtue of Parallel MS Acquisition. Mol. Cell. Proteomics 2006, 5, 144
  3. H.A. Van den Burg, N. Westerink, K.-J. Francoijs, R. Roth, E. Woestenenk, S. Boeren, P.J.G.M. de Wit, M.H.A.J. Joosten and J. Vervoort. Natural disulfide bond-disrupted mutants of AVR4 of the tomato pathogen Cladosporium fulvum are sensitive to proteolysis, circumvent Cf-4-mediated resistance, but retain their chitin binding ability. J. Biol. Chem. 2004, 278, 27340
  4. A.H.P. America, J.H.G. Cordewener, M.H.A. van Geffen, A. Lommen, J.P.C. Vissers, R.J. Bino and R.D. Hall, Alignment & statistical difference analysis of complex peptide data sets generated by multidimensional LC/MS, Proteomics 2006, 6, 641

Acknowledgement

Kindly acknowledged for their contributions are:

  •  Jan Cordewener, Centre for BioSystems Genomics Plant Research International, The Netherlands
  • Iris Stulemeijer and Matthieu Joosten, Centre for BioSystems Genomics, Department of Fytopathology, Wageningen University, The Netherlands
  • Jim Langridge, Waters Corporation, Manchester, UK

720002037, August 2007

Back To Top Back To Top