The Use of a Delay Column to Mitigate Persistent Interference Peaks in the Trace Level Quantitation of NDBA in Normal Saline Intravenous Infusion Bags Using UHPLC-MS/MS
Marian Twohig
Waters Corporation, United States
Published on May 08, 2026
Abstract
The detection of N nitrosamines (nitrosamines) in pharmaceuticals has been a major safety concern since 2018, prompting expanding regulatory oversight of small molecule nitrosamines such as N-Nitrosodimethylamine (NDMA) and N-Nitrosodiethylamine (NDEA) as well as Nitrosamine Drug Substance–Related Impurities (NDSRIs).
In 2025, the FDA’s Center for Drug Evaluation and Research (CDER) reported an emerging issue: the presence of N‑nitrosodibutylamine (NDBA) in drug products packaged in intravenous (IV) infusion bags. The FDA communication describes an ongoing investigation into possible sources of leachable nitrosamines and recommends that manufacturers assess and, where appropriate, test affected products using suitably sensitive analytical methods. While LC–MS/MS using tandem quadrupole instruments provides robust selectivity for quantitative measurements, low‑molecular‑weight analytes such as NDBA can still be affected by background noise and co‑eluting interferences. This study presents an analytical approach for quantifying NDBA present in infusion bag solutions, proposing a method to mitigate persistent interference from a component sharing the same multiple reaction monitoring (MRM) transitions and retention time. The use of a delay column to separate this interferent is described. Ultra high-performance liquid chromatography (UHPLC), coupled with positive‑ion atmospheric pressure chemical ionization (APCI) and a Xevo™ TQ Absolute XR tandem quadrupole Mass Spectrometer enabled low‑pg/mL quantitation to be achieved, with data processed using waters_connect™ for Quantitation Software.
Benefits
- Trace level detection of NDBA using the Xevo TQ Absolute XR tandem quadrupole Mass Spectrometer in MRM acquisition mode.
- The use of a delay column to mitigate persistent interference in the MRM analysis of NDBA at trace levels.
- waters_connect Software offers compliant-ready workflows for the acquisition, processing, review, and reporting of quantitative data for N-nitrosamines.
Introduction
Since 2018, considerable attention has been directed toward the potential health risks posed by N‑nitrosamines (nitrosamines) detected as impurities in pharmaceuticals.1–4 Nitrosamines are impurities that have been identified by regulatory authorities as requiring risk‑based assessment and control within pharmaceutical products.2 Initially, the focus was on the small molecule nitrosamines including NDMA and NDEA. The scope of the studies expanded to NDSRIs, which share structural features with the drug substance itself.4,5 Regulatory guidance for assessing drug products for nitrosamine impurities was first issued in 2020 and has been revised multiple times as scientific understanding has advanced.6–8
In August 2025, the FDA’s CDER made an announcement detailing an emerging issue in which NDBA, a small‑molecule nitrosamine impurity, was detected in certain drug products packaged in infusion bags.9 Infusion bags represent a sterile parenteral dosage form often packaged with flexible medical grade containers. In its August 2025 Emerging Scientific and Technical Information notice, CDER stated that it is investigating the presence of NDBA and other small‑molecule nitrosamines in certain drug products packaged in IV infusion bags and has requested additional data to better understand potential sources and scope.10,11
Trace analysis of nitrosamines at the regulatory-set Acceptable Intake (AI) threshold levels requires sensitive and selective analytical methods.8 NDBA has an AI of 26.5 ng/day. Tandem quadrupole mass analyzers offer the best performance characteristics for quantitative measurements in complex matrices due to their ease of use, robustness, sensitivity, and the assay selectivity afforded through selection (acquisition) of precursor and product ions in MRM experiments.
Despite the selectivity of LC-MS/MS experiments, it is still possible to observe noise and interfering peaks in MRM acquisitions, which can decrease the detection sensitivity and selectivity of the method. The trace analysis of low molecular weight analytes can be challenging due to the chemical interference often present in this mass range.12
This study describes an analytical method that facilitates the analysis of the NDBA in normal saline (0.9% NaCl) IV infusion bags. A persistent interfering background peak sharing the same MRM transitions as NDBA and eluting at the same retention time was observed during the analysis. The use of a delay column to offset the interferent is described. Ultra-performance liquid chromatography (UPLC™) and a Xevo TQ Absolute XR tandem quadrupole Mass Spectrometer in positive ion APCI mode were used to deliver low pg/mL levels of quantitation for NDBA. The MS data was acquired and managed using waters_connect for Quantitation Software.
Experimental
Waters Solutions
- ACQUITY™ Premier UPLC System including Flow-Through Needle (FTN) Autosampler
- ACQUITY Photodiode Array (PDA) Detector
- Xevo TQ Absolute XR Mass Spectrometer
- Analytical column: Waters ACQUITY Premier HSS T3 Column, 1.8 µm, 2.1 x 100 mm, (p/n: 186009468)
- Delay column: Atlantis™ Premier BEH™ C18 AX Column, 5 µm, 2.1 x 50 mm (p/n: 186009407)
- Delay column connector: 1 µL flexible hypo tip loop (p/n: 430003166)
- TruView™ LCMS Clear Glass Vials (p/n: 186005663CV)
- Instrument control: waters_connect Software
- Data processing: waters_connect for Quantitation Software
Experimental Methods
Materials
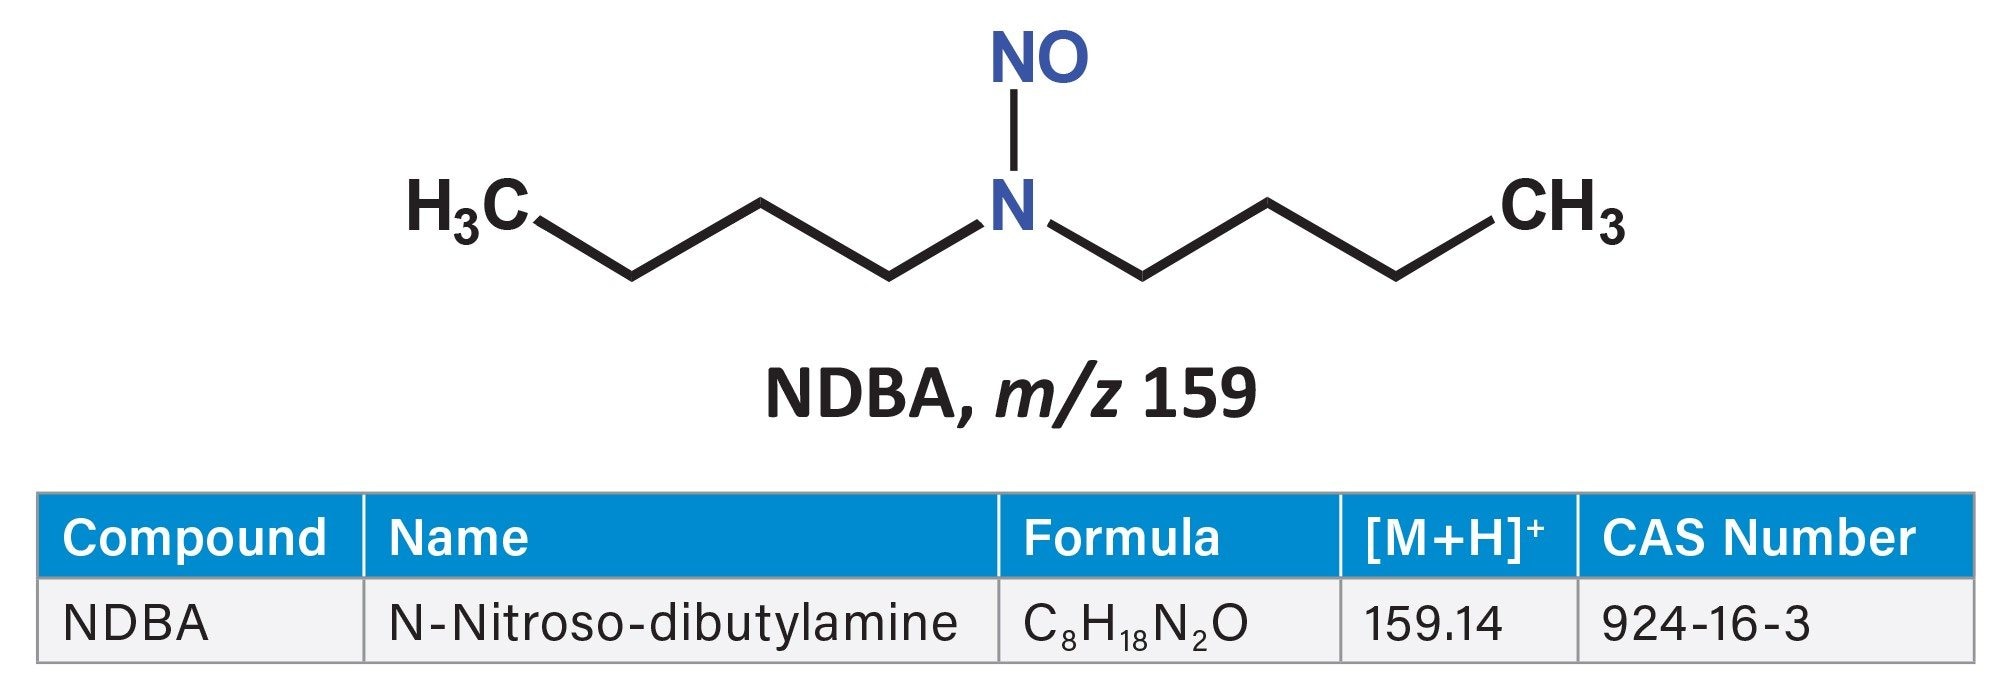
The NDBA standard (Figure 1) was purchased from Millipore Sigma (St Louis, MO, USA). Sodium Chloride solution (0.9%) BioXtra (S8776-20 mL) and LC-MS grade ammonium formate (70221-25G-F) were purchased from Millipore Sigma. Optima LC-MS grade Formic Acid (A117-50) was purchased from Fisher Scientific. The 0.9% NaCl IV bags 50 mL, 100 mL, 1000 mL were procured online from a commercial vendor. Additional 500 mL 0.9% NaCl IV bags were obtained from a pharmacy supply chain.
Sample Preparation
The NDBA standard solution in methanol was diluted further with methanol to create a working stock solution at 10 µg/mL. The working stock was subsequently diluted in water/methanol (95:5) to make a solvent standard curve ranging in concentration from 0.005 ng/mL-100 ng/mL to aid with method development. The matrix curve was created over the same concentration range using the working stock solution (10 µg/mL) with subsequent dilutions performed in nitrosamine free 0.9% NaCl. Normal saline IV bags were perforated at the valve, and the solution was transferred to autosampler vials in preparation for analysis by LC-MS.
The analytical LC system consisted of a binary solvent manager (BSM) capable of pressures up to 15k psi and an autosampler (Table 1). The HSS T3 stationary phase used for the separation is compatible with 100% aqueous mobile phases and designed to increase the retention of polar analytes.13
LC Method and Conditions
|
LC system: |
ACQUITY Premier Binary Solvent Manager with an FTN Sample Manager |
|
Detection: |
PDA 210–400 nm |
|
vials: |
TruView LCMS Clear Glass Vials (p/n: 186005663CV) |
|
Analytical column: |
Waters ACQUITY Premier HSS T3 Column, 1.8 µm, 2.1 x 100 mm, (p/n: 186009468) |
|
Delay column: |
Atlantis Premier BEH C18 AX Column, 5 µm, 2.1 x 50 mm (p/n: 186009407) and 1 µL flexible hypo tip loop (p/n: 430003166) |
|
Column temperature: |
45 °C |
|
Sample temperature: |
6 °C |
|
Injection volume: |
20 µL |
|
Flow rate: |
0.30 mL/min |
|
Mobile phase A: |
5 mM Ammonium Formate in LC-MS grade Water with 0.1% Formic Acid |
|
Mobile phase B: |
5 mM Ammonium Formate in LC-MS grade Methanol with 0.1% Formic Acid |
Table 1. LC Conditions.
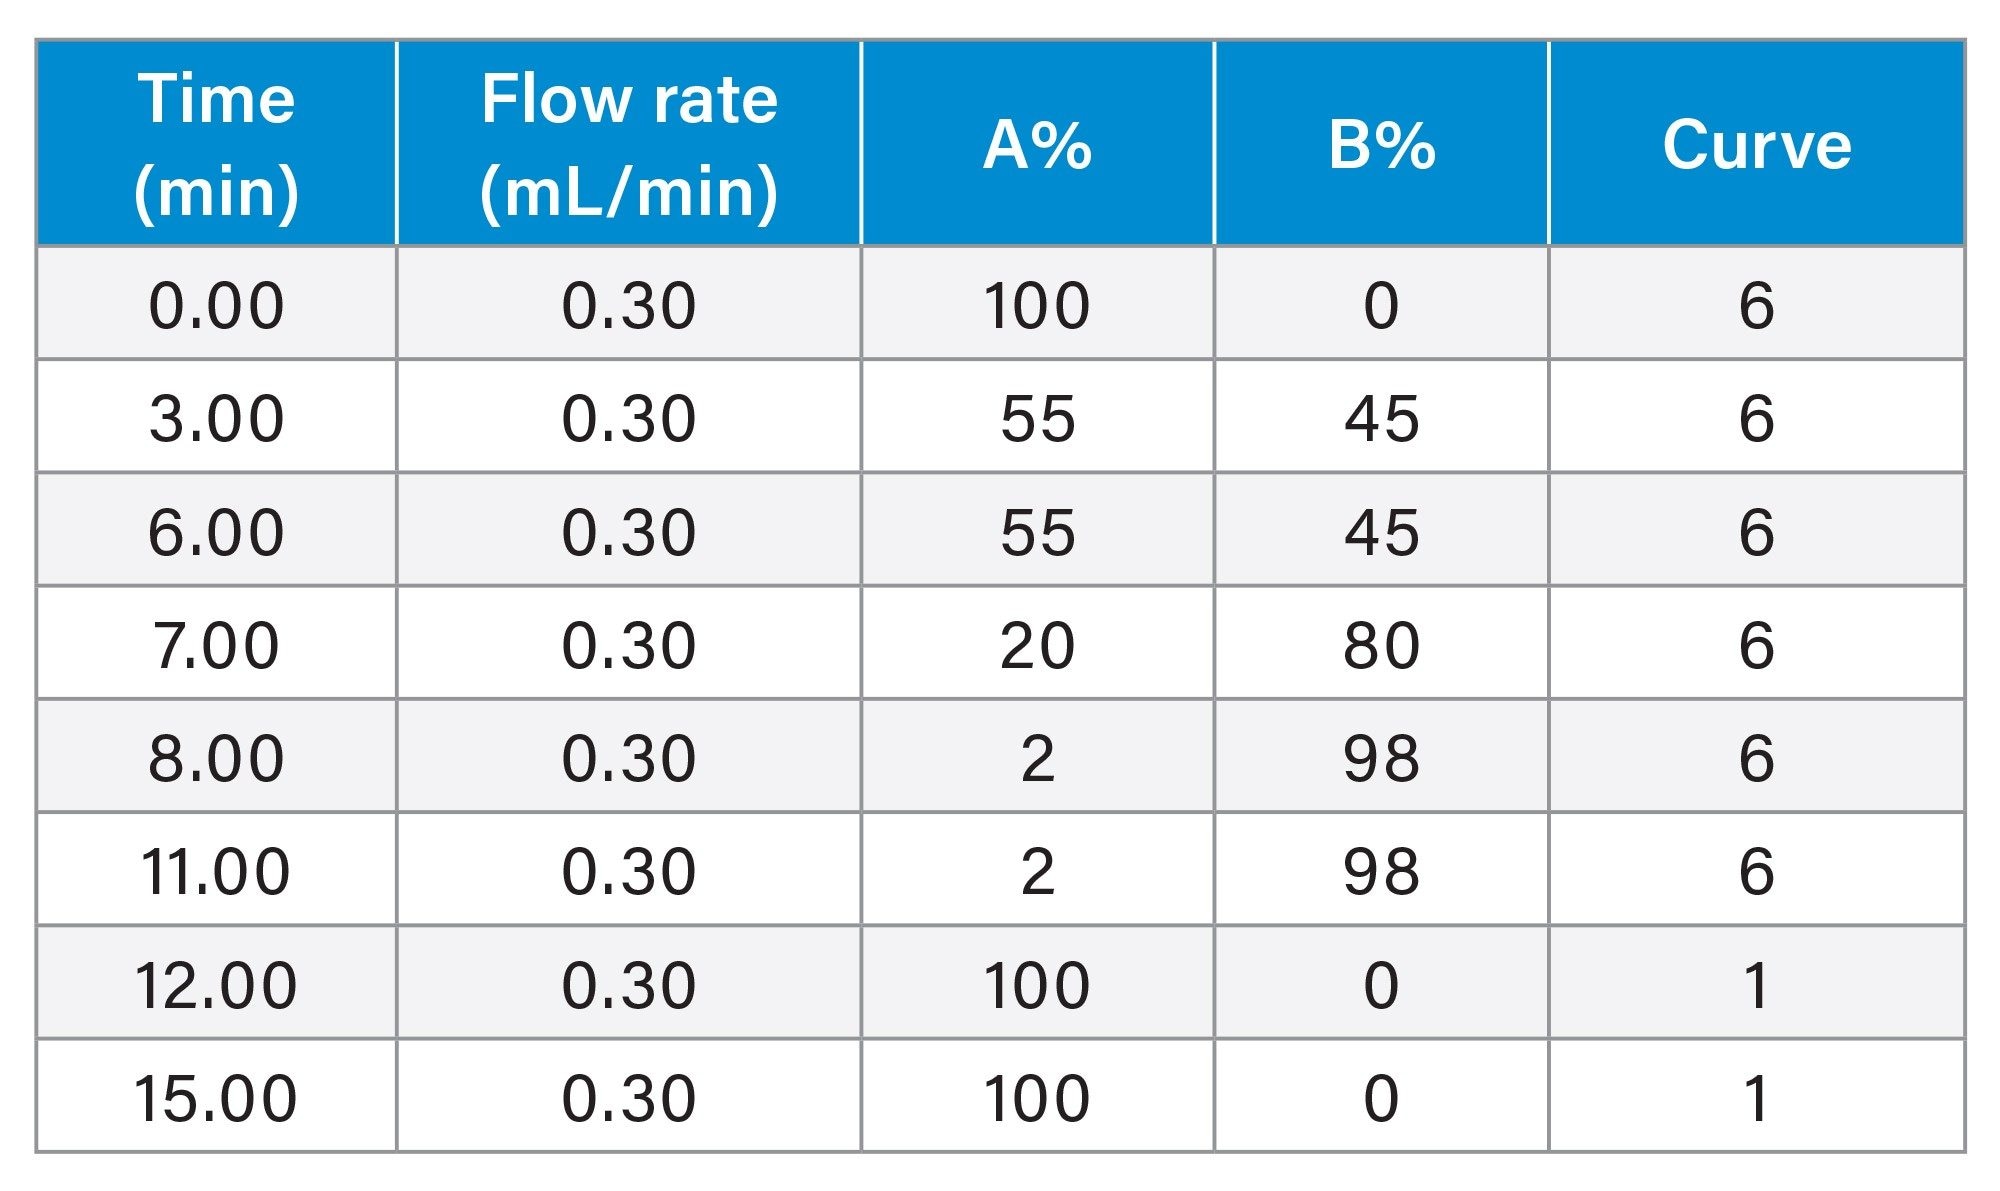
The gradient program is shown in Table 2. This gradient can be used to chromatographically resolve and analyze NMBA, NDMA, NDEA, NEIPA, NDPA, NDIPA and NDBA.12,14 A delay column was used to mitigate the effects of an interfering component, possibly originating from the mobile phase solvents and eluting at the same retention time (tR) as the NDBA.
To avoid the transmission of the 0.9% NaCl (9 g/L) sample diluent to the MS source, the first 1.75 minutes of the chromatographic run was diverted to the waste using the integrated solvent divert valve.
MS Method and Conditions
A Xevo TQ Absolute XR tandem quadrupole Mass Spectrometer was used to acquire data (Table 3). The compound optimization, MRM method generation, data acquisition, quantification method generation, and data processing were managed using waters_connect Software including the MS Quan Application (V2.3.0).
|
Ionisation mode: |
APCI Positive |
|
Corona current (µA): |
2 |
|
Cone voltage (V): |
Table 5 |
|
Collision energy (eV): |
Table 5 |
|
Source temperature (°C): |
120 |
|
Probe temperature (°C): |
250 |
|
Desolvation gas flow (L/hr): |
800 |
|
Cone gas flow (L/hr): |
300 |
|
Nebulizer (L/hr): |
155 |
Table 3. MS conditions.
The solvent divert valve was enabled in the MS software to direct the normal saline sample diluent to waste. The divert valve is a component within the fluidics system of the mass spectrometer. The divert valve operates to control the flow paths of fluids, allowing for precise switching between different operational modes such as infusion, waste, combined or LC flow.
NBDA MS Optimization
For the MS optimization, the NDBA standard was prepared in 50/50 methanol/water at 200 ng/mL. The MRM parameters were tuned by infusion of the analyte into the MS at the LC flowrate used for the analytical experiments (0.300 mL/min).
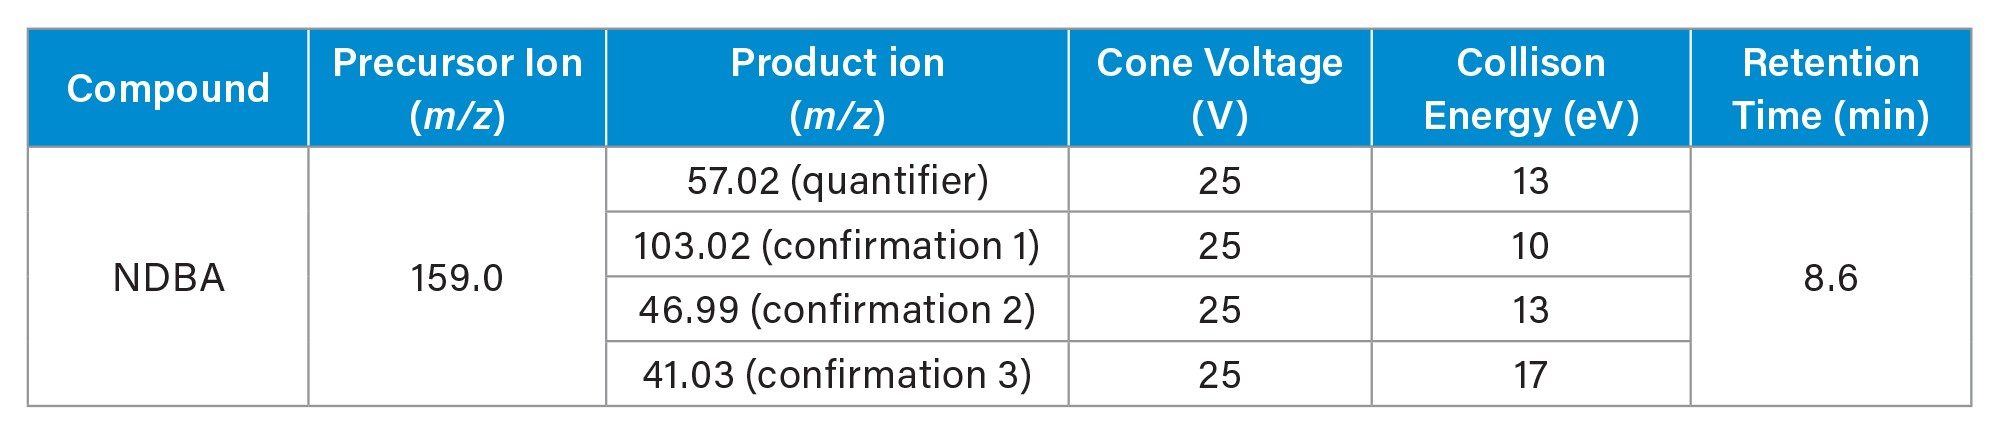
Following the development of the MRM method (Table 4), the source parameters were then optimized.
waters_connect Software
The waters_connect for Quantitation Software streamlined and simplified the individual steps required to develop an LC-MS method, including optimization of the MRM transitions with automatic generation of the quantitative method directly from the MS acquisition method. Data review is assisted by setting batch pass/fail criteria resulting in clear user alerts.
Results and Discussion
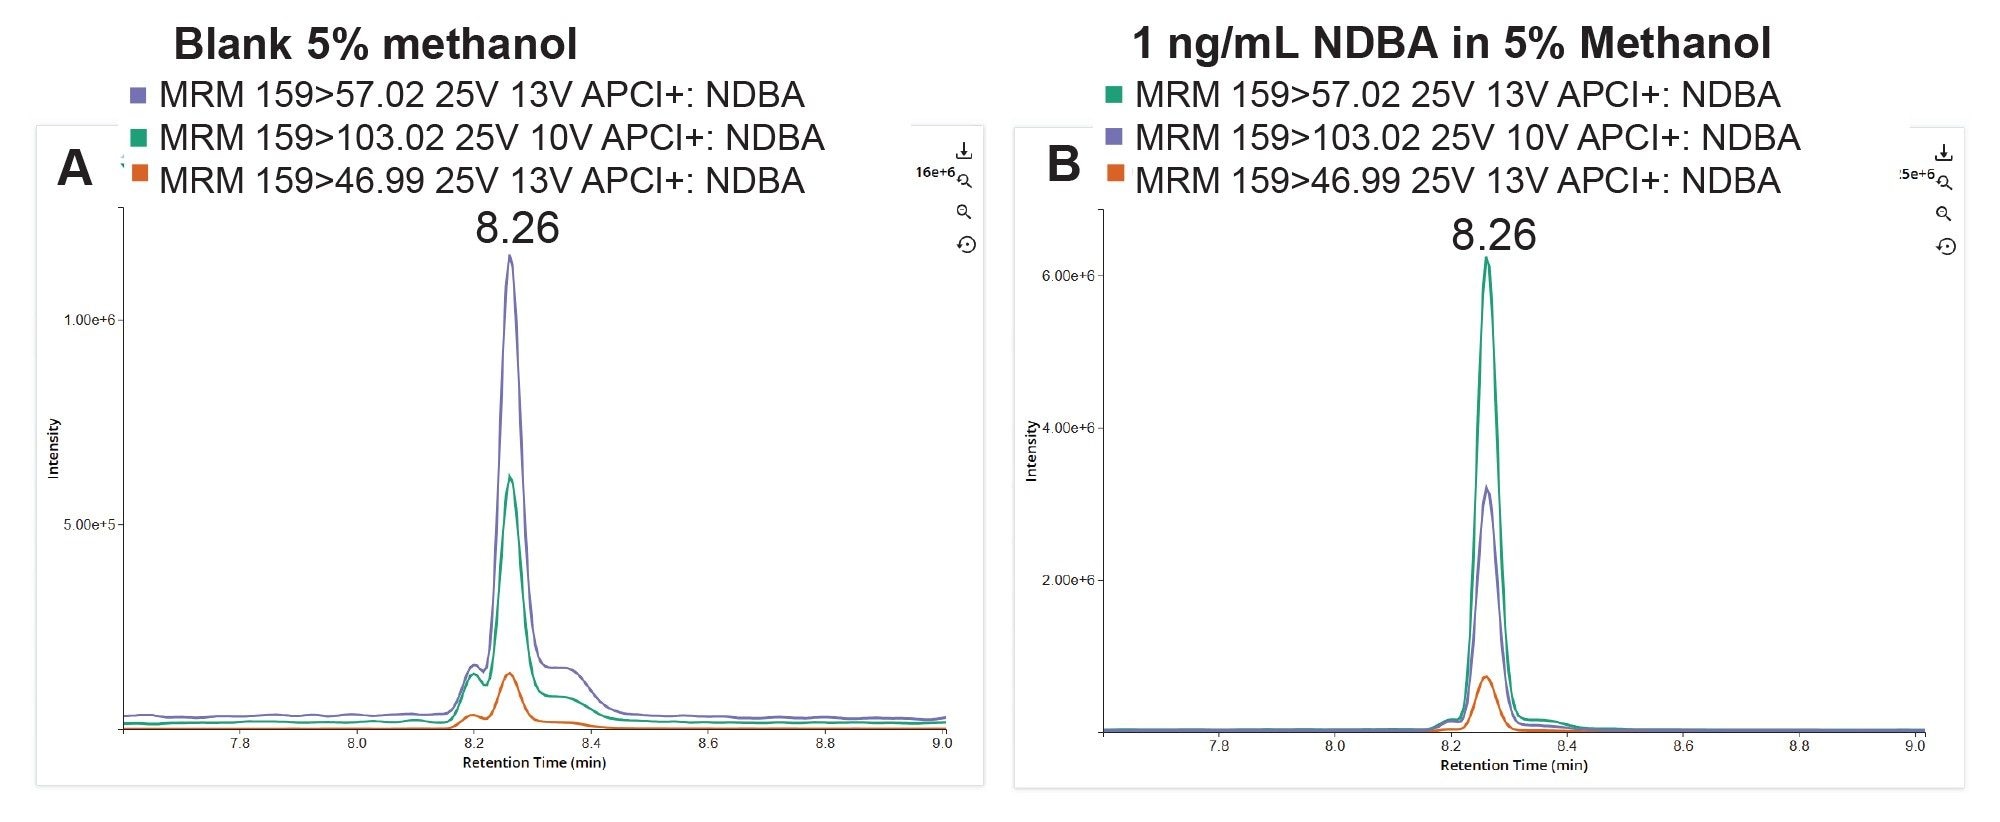
During the chromatographic method development, a peak at the expected retention time (tR) for NDBA, 8.26 minutes (Figure 2B), was noted in the blank injection (Figure 2A). Further experimentation revealed this component to be a persistent interferent resulting in the use of a delay column. The intensity of the component can vary with the brand of solvents used.
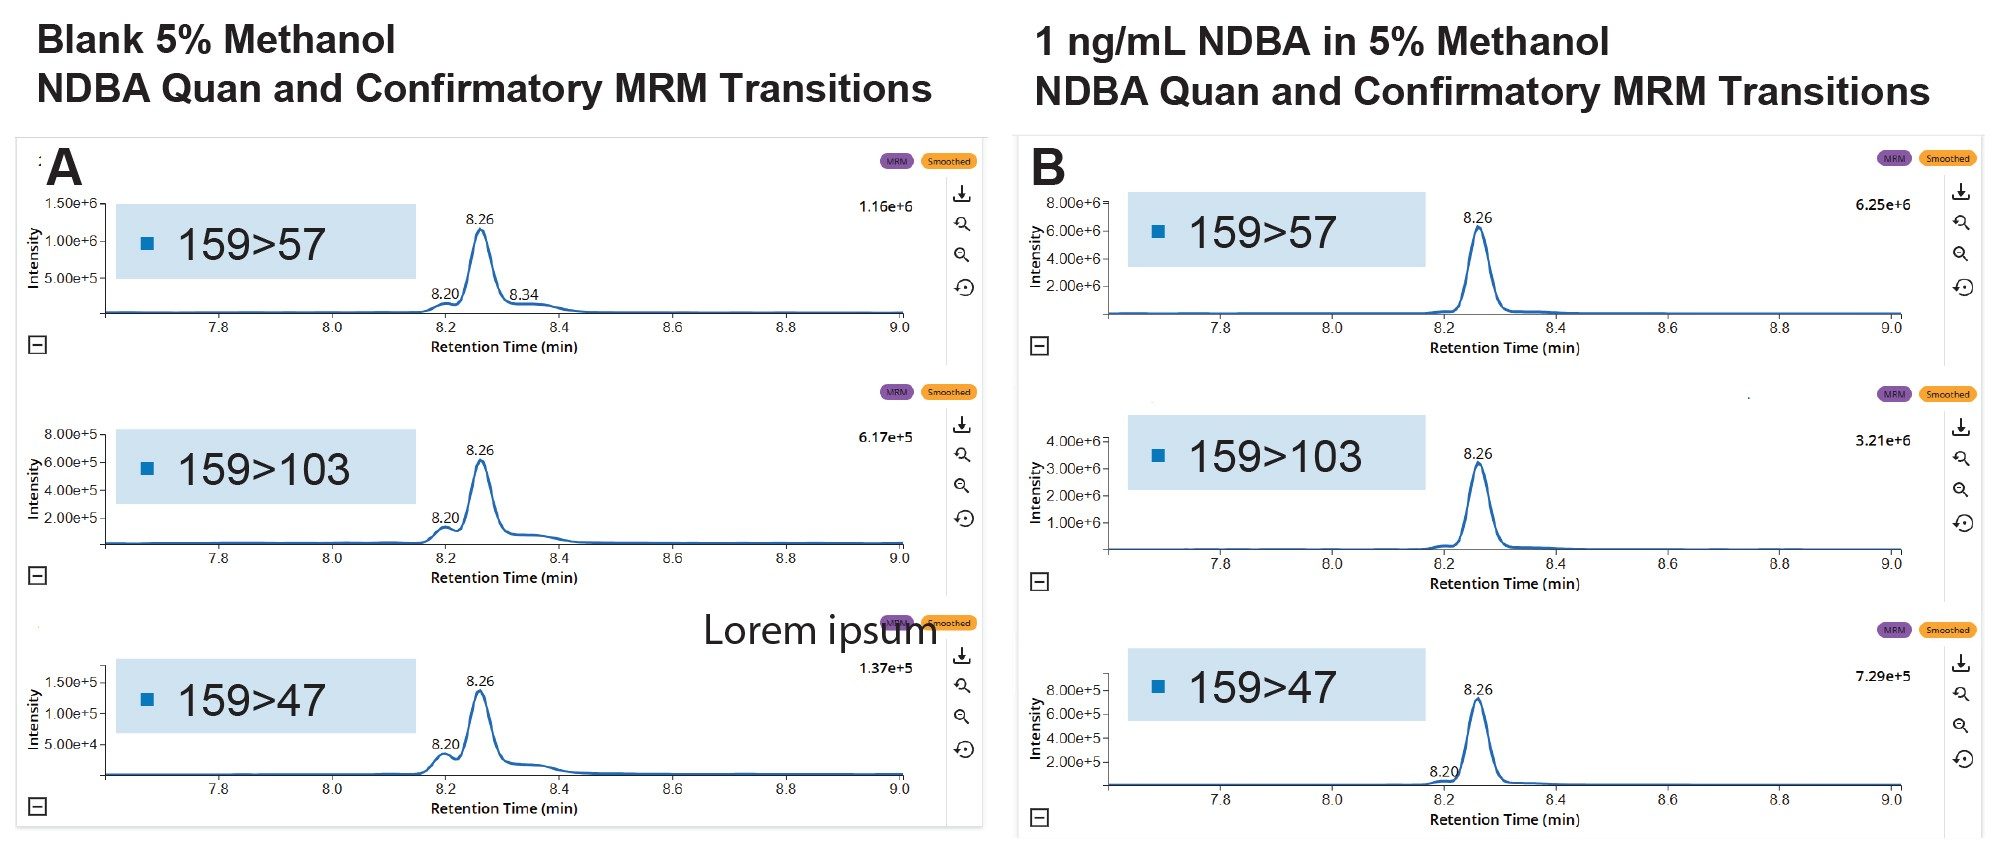
In Figure 3A and 3B, the quantitation and confirmatory NDBA MRM transitions have been superimposed for the blank and standard injections.
In an unmodified LC system, contaminants originating from the system or solvents can build up at the head of the analytical column between injections, impacting the achievable limit of detection. To assist in mitigating this, a delay column can be added to the flow path. The delay column is positioned after the mixer, retaining the interfering compounds for enough time to prevent them from reaching the analytical column during sample loading. A flexible 1 µL sample loop was used to attach the delay column to the mixer. The outlet tube to the valve was then connected to the delay column. Incorporating a delay column helps isolate mobile phase and system related background signals from the analytes of interest, leading to more precise measurements. This is especially important for measuring compounds accurately at trace levels. The choice of stationary phase for the delay column should be evaluated experimentally. The retention properties should be equal to or greater than those of the analytical column to ensure sufficient delay of the interfering component, preventing co‑elution with the analyte.
An image displaying an unmodified pump (A) and second image displaying a delay column attached to the mixer using a 1 µL flexible loop (B) is shown in Figure 4.
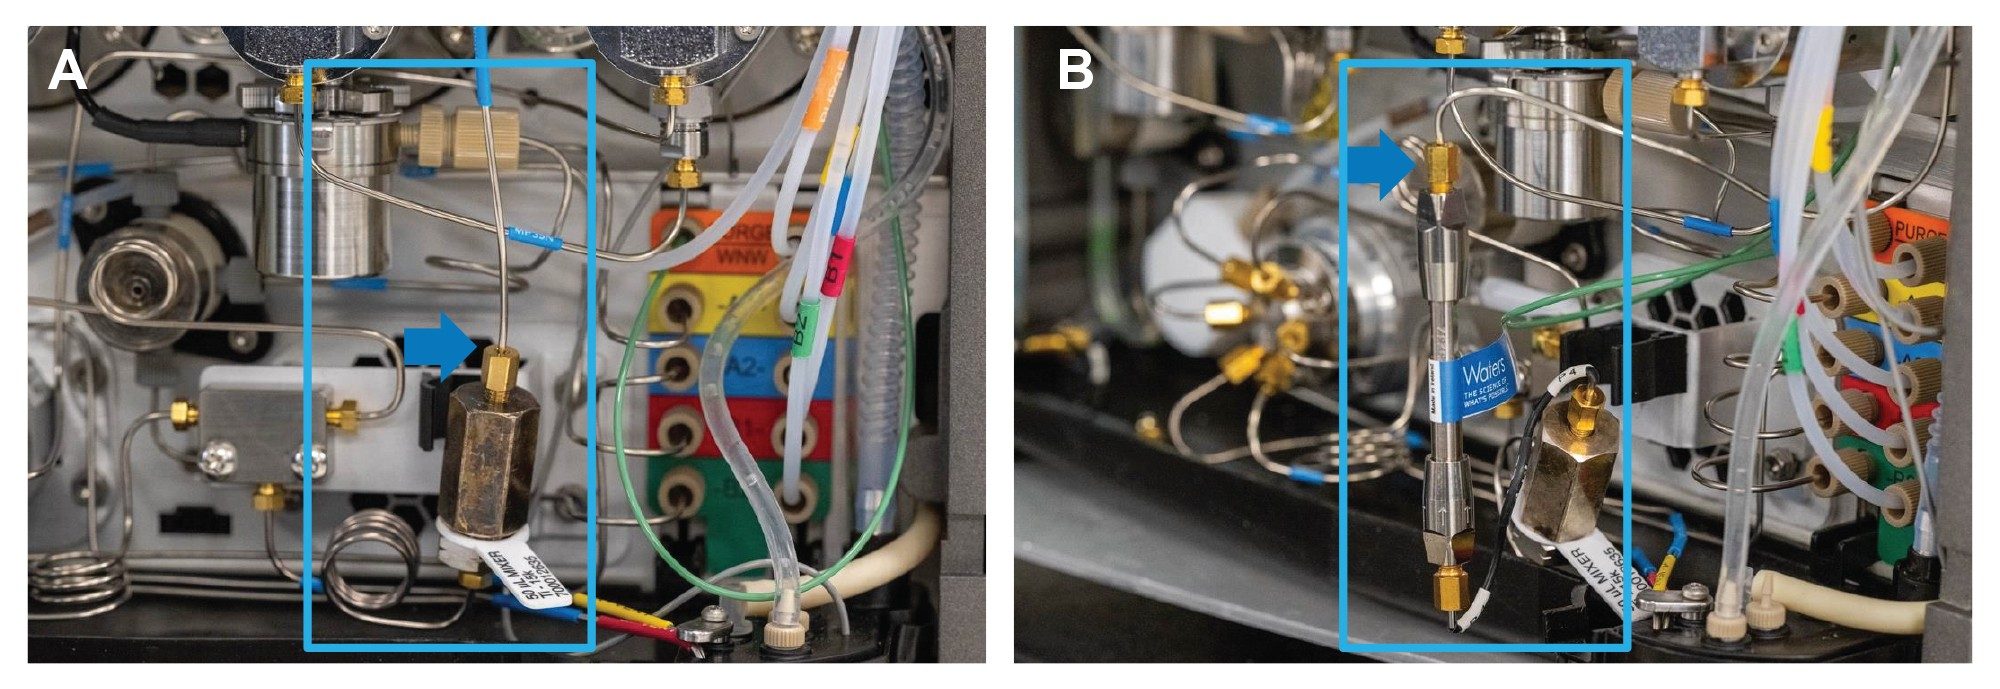
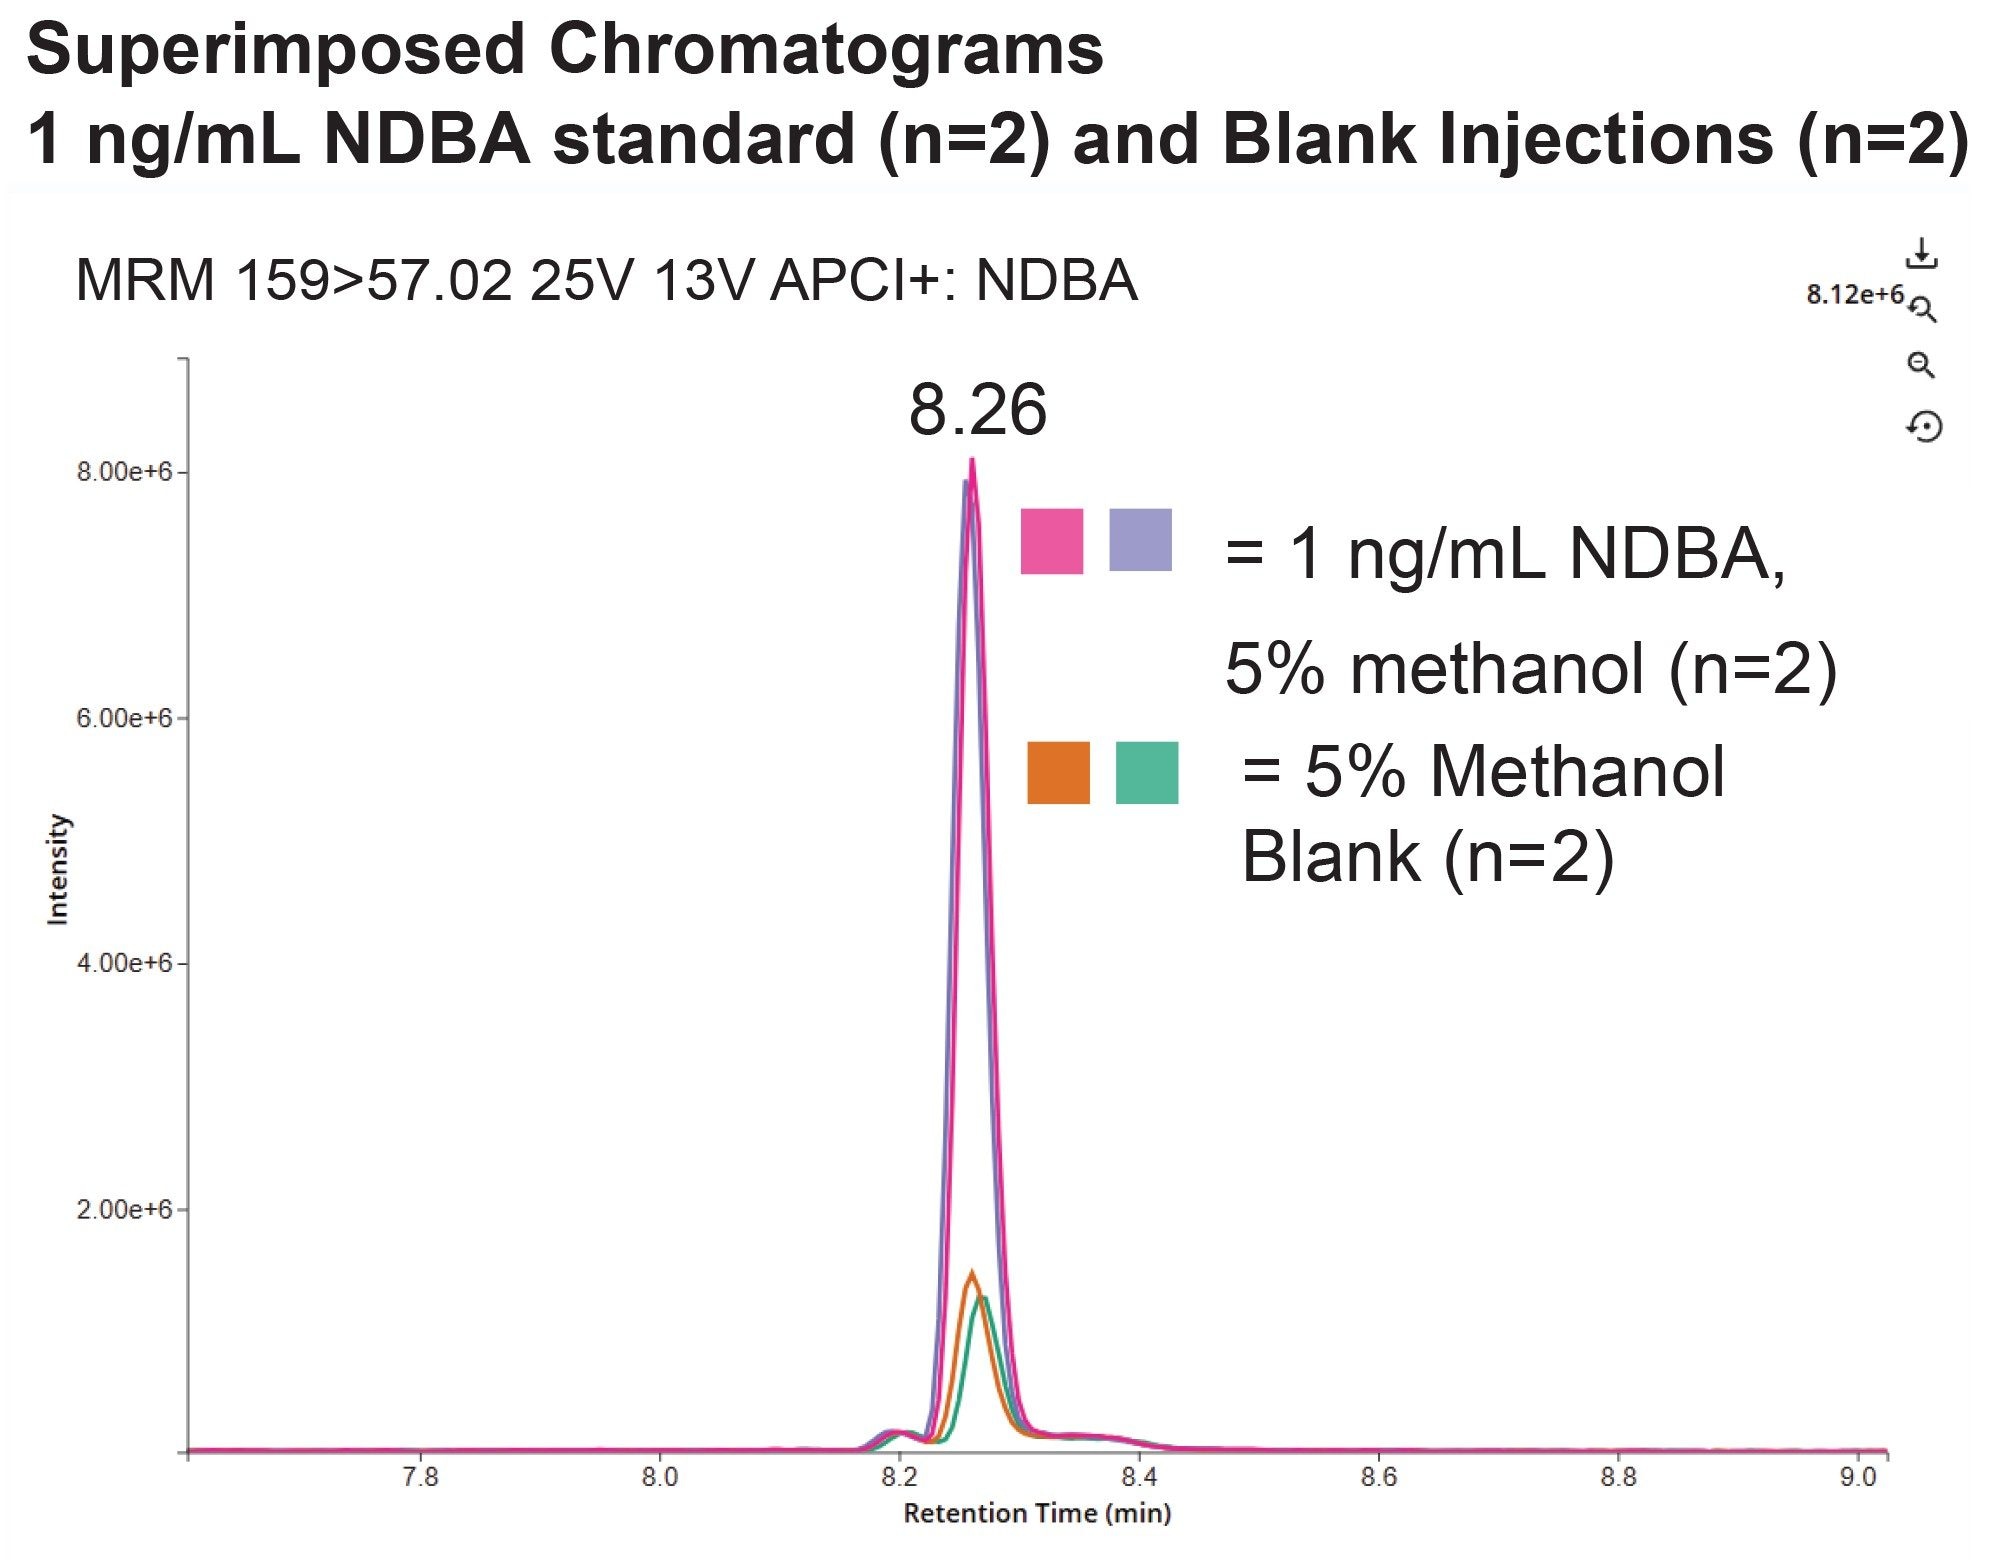
Figure 5 displays the superimposed chromatograms for the blank injection (n=2) and an NDBA standard at 1 ng/mL (n=2), illustrating the co-elution of the interfering component with NDBA before the installation of the delay column.
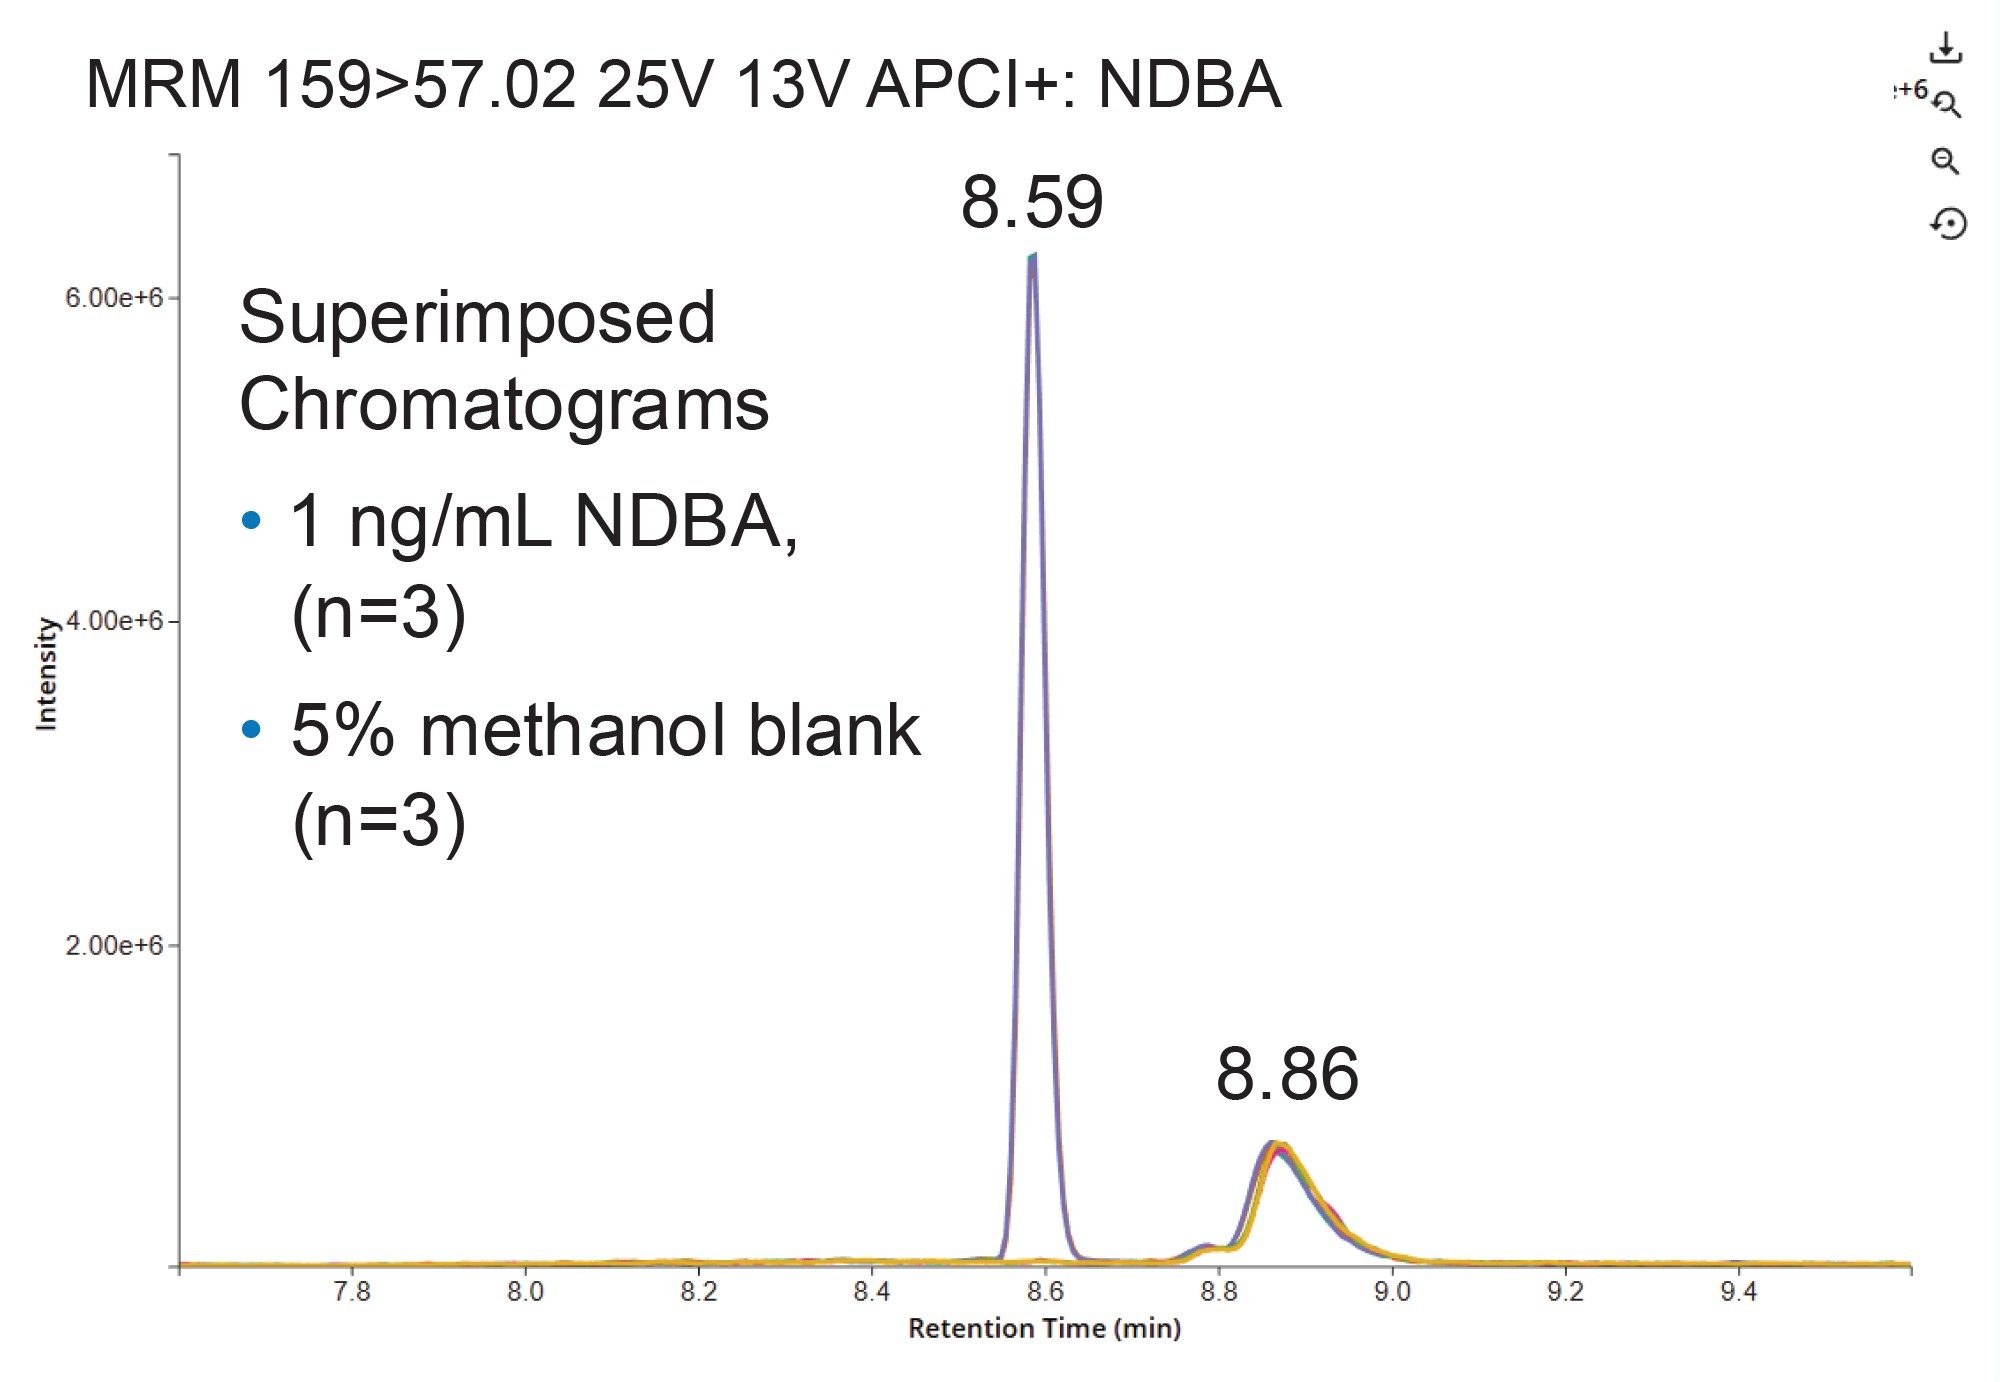
In Figure 6, the blank injection (n=3) is superimposed with the 1 ng/mL NDBA standard injections (n=3). The delay column assisted in retaining the system contaminant moving it to a longer tR of 8.86 minutes thus preventing co-elution with the NDBA, which is now eluting at 8.59 minutes. The expected shift in the retention time can be calculated from the volume of the packed bed column added to the flow path, and the experimental flow rate.
The effect of adding the delay column to the peak shape is illustrated in Figure 7. In this figure, the width of the chromatographic peak resulting from the analysis of a 1 ng/mL NDBA standard, before (A) and after the installation of the delay column (B) is shown.
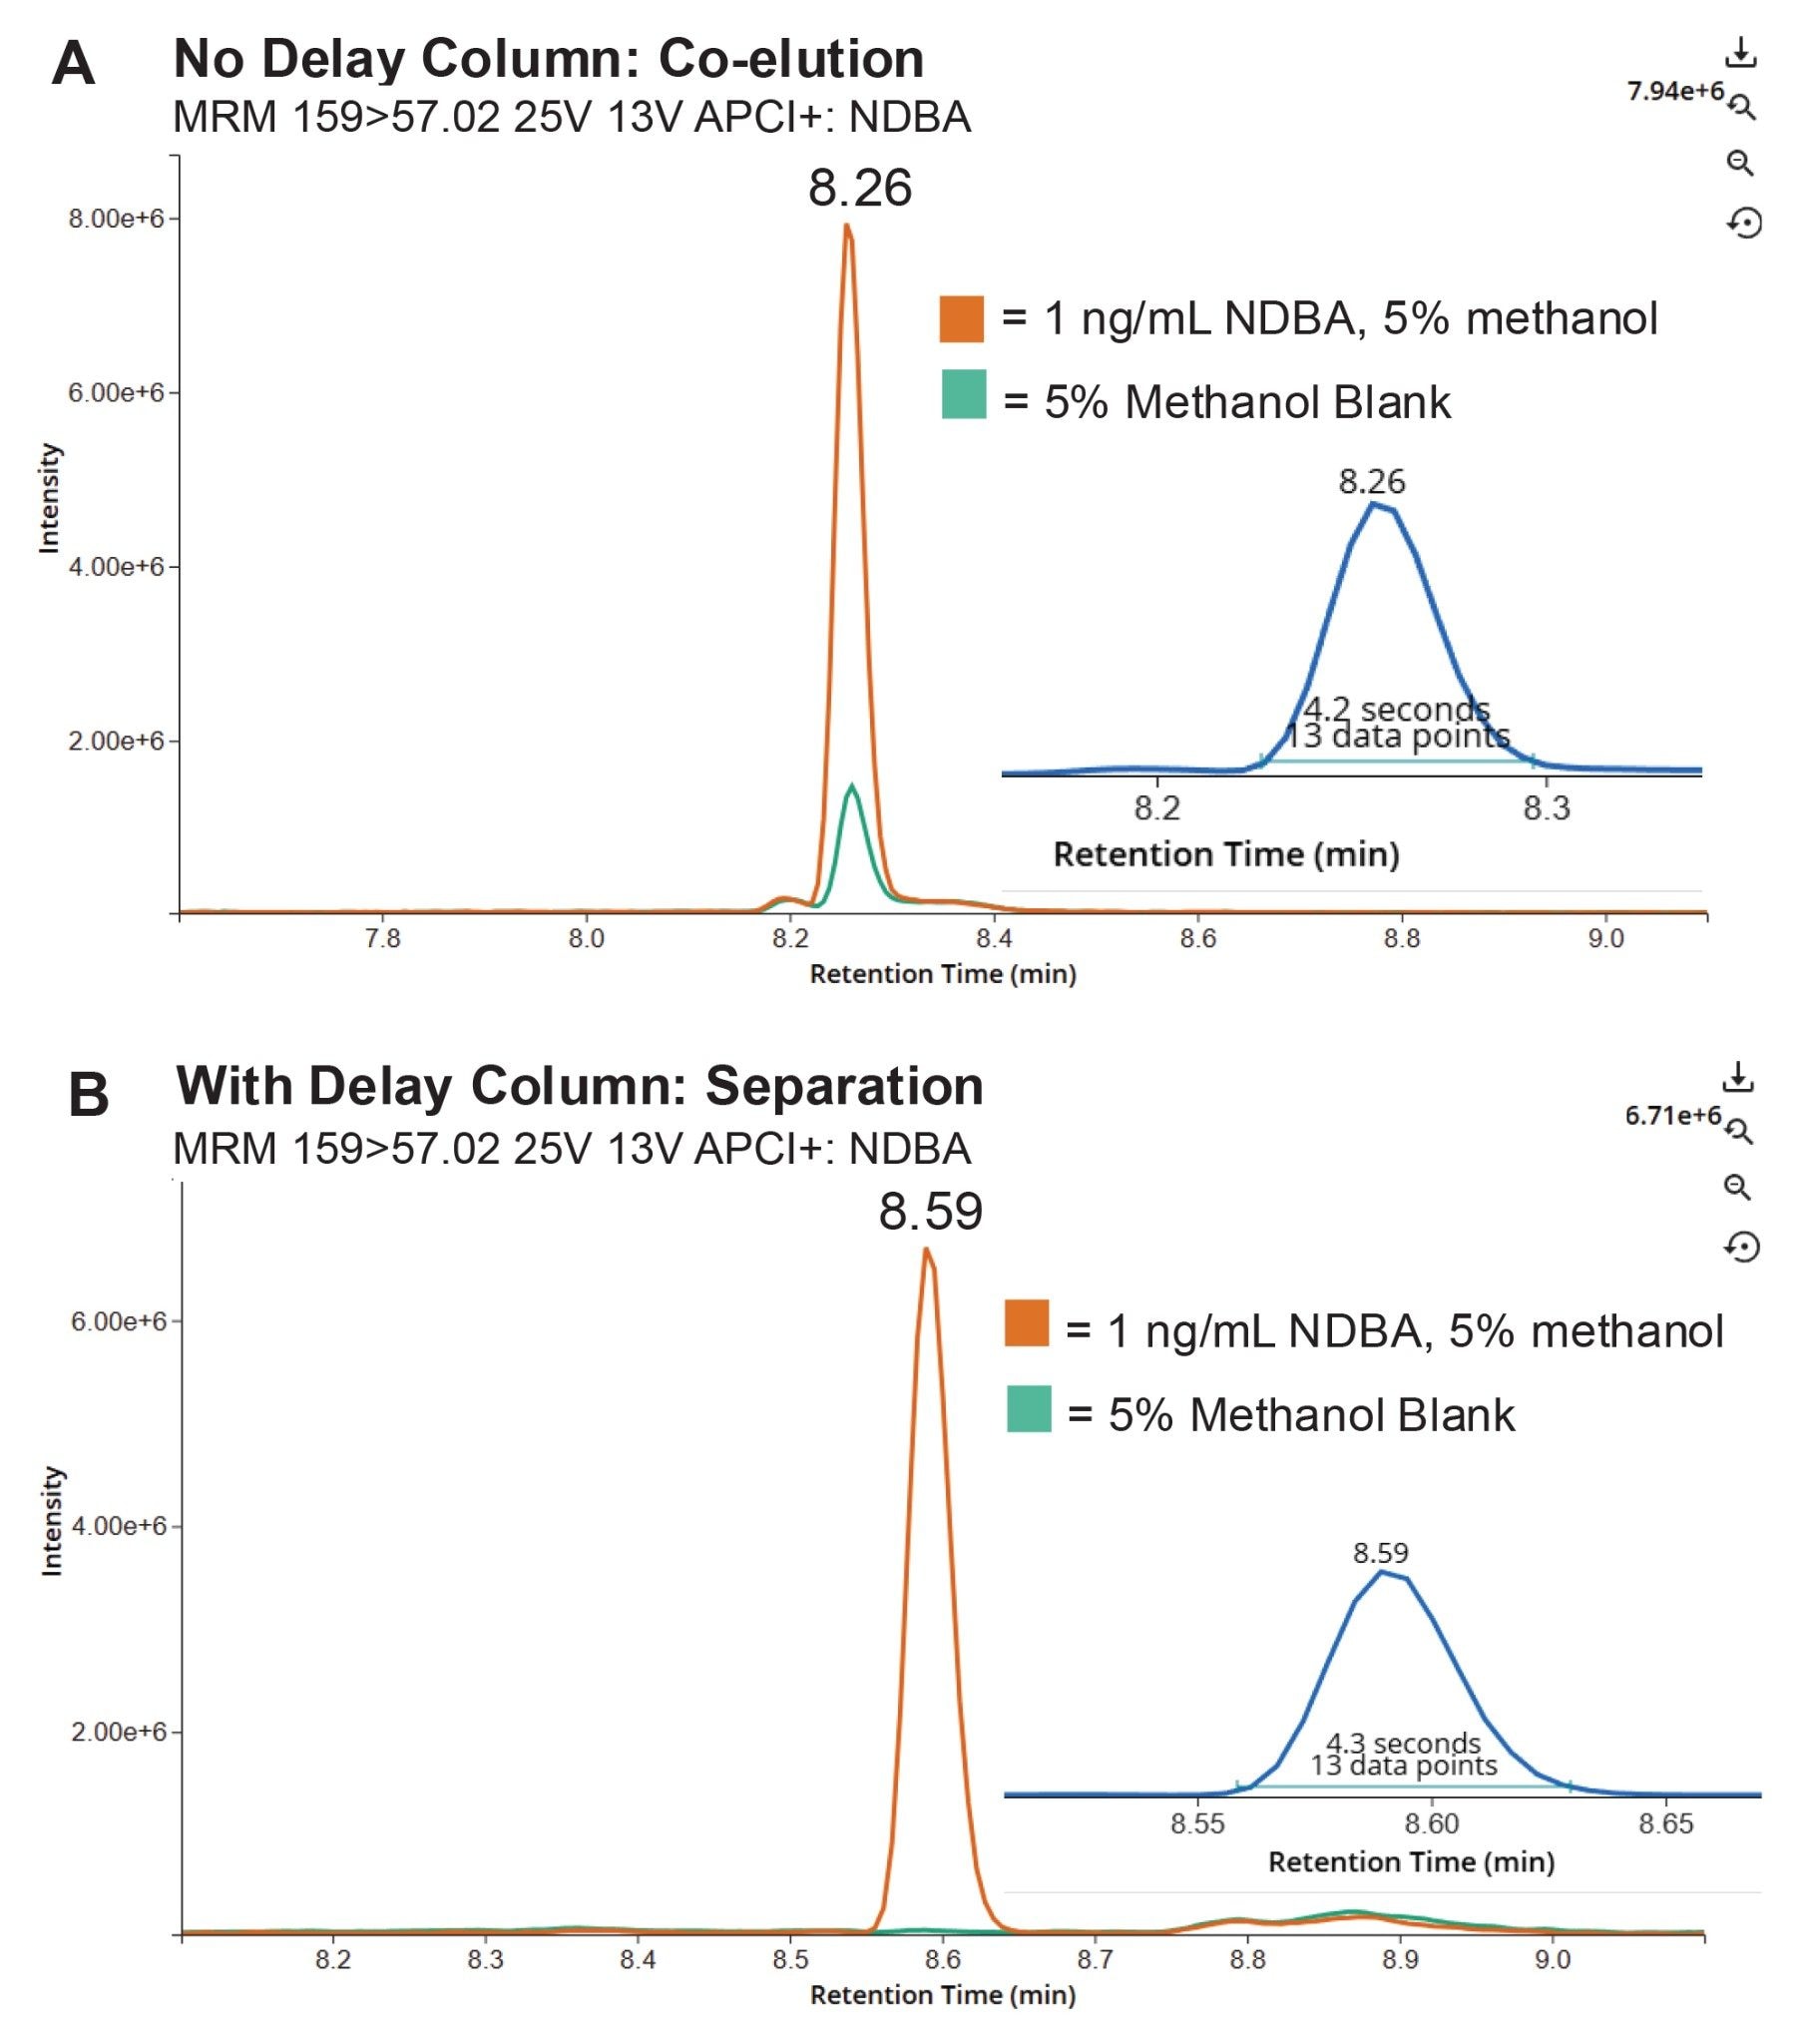
Measured peak widths of 4.2 seconds and 4.3 seconds were observed before and after installation of the delay column, indicating that there is no appreciable difference to the peak width after the system modification.
Quantitative Method Development for N-Nitrosamines in the 0.9% NaCl Solution
The development of a method for the quantitation of seven nitrosamines, including NDBA, in 0.9% NaCl was described previously.14 The methodology demonstrated linear calibration curves from 0.01 or 0.02 ng/mL-100 ng/mL with R2 values > 0.99 using 1/x weighting. Quality control samples, prepared in matrix (n=6) at four concentration levels from 0.075–75 ng/mL were measured against the matrix curve. The mean accuracies for all QCs were between 88–110% with CVs between–0.033–5.5%. The %matrix effects were also evaluated. The results were determined based on 6 replicate measurements at 4 concentration levels (0.05–50 ng/mL). The seven nitrosamines tested showed either suppression or enhancement ranging from -9.3–13.2.
Quantitation of NDBA in Normal Saline IV Bags
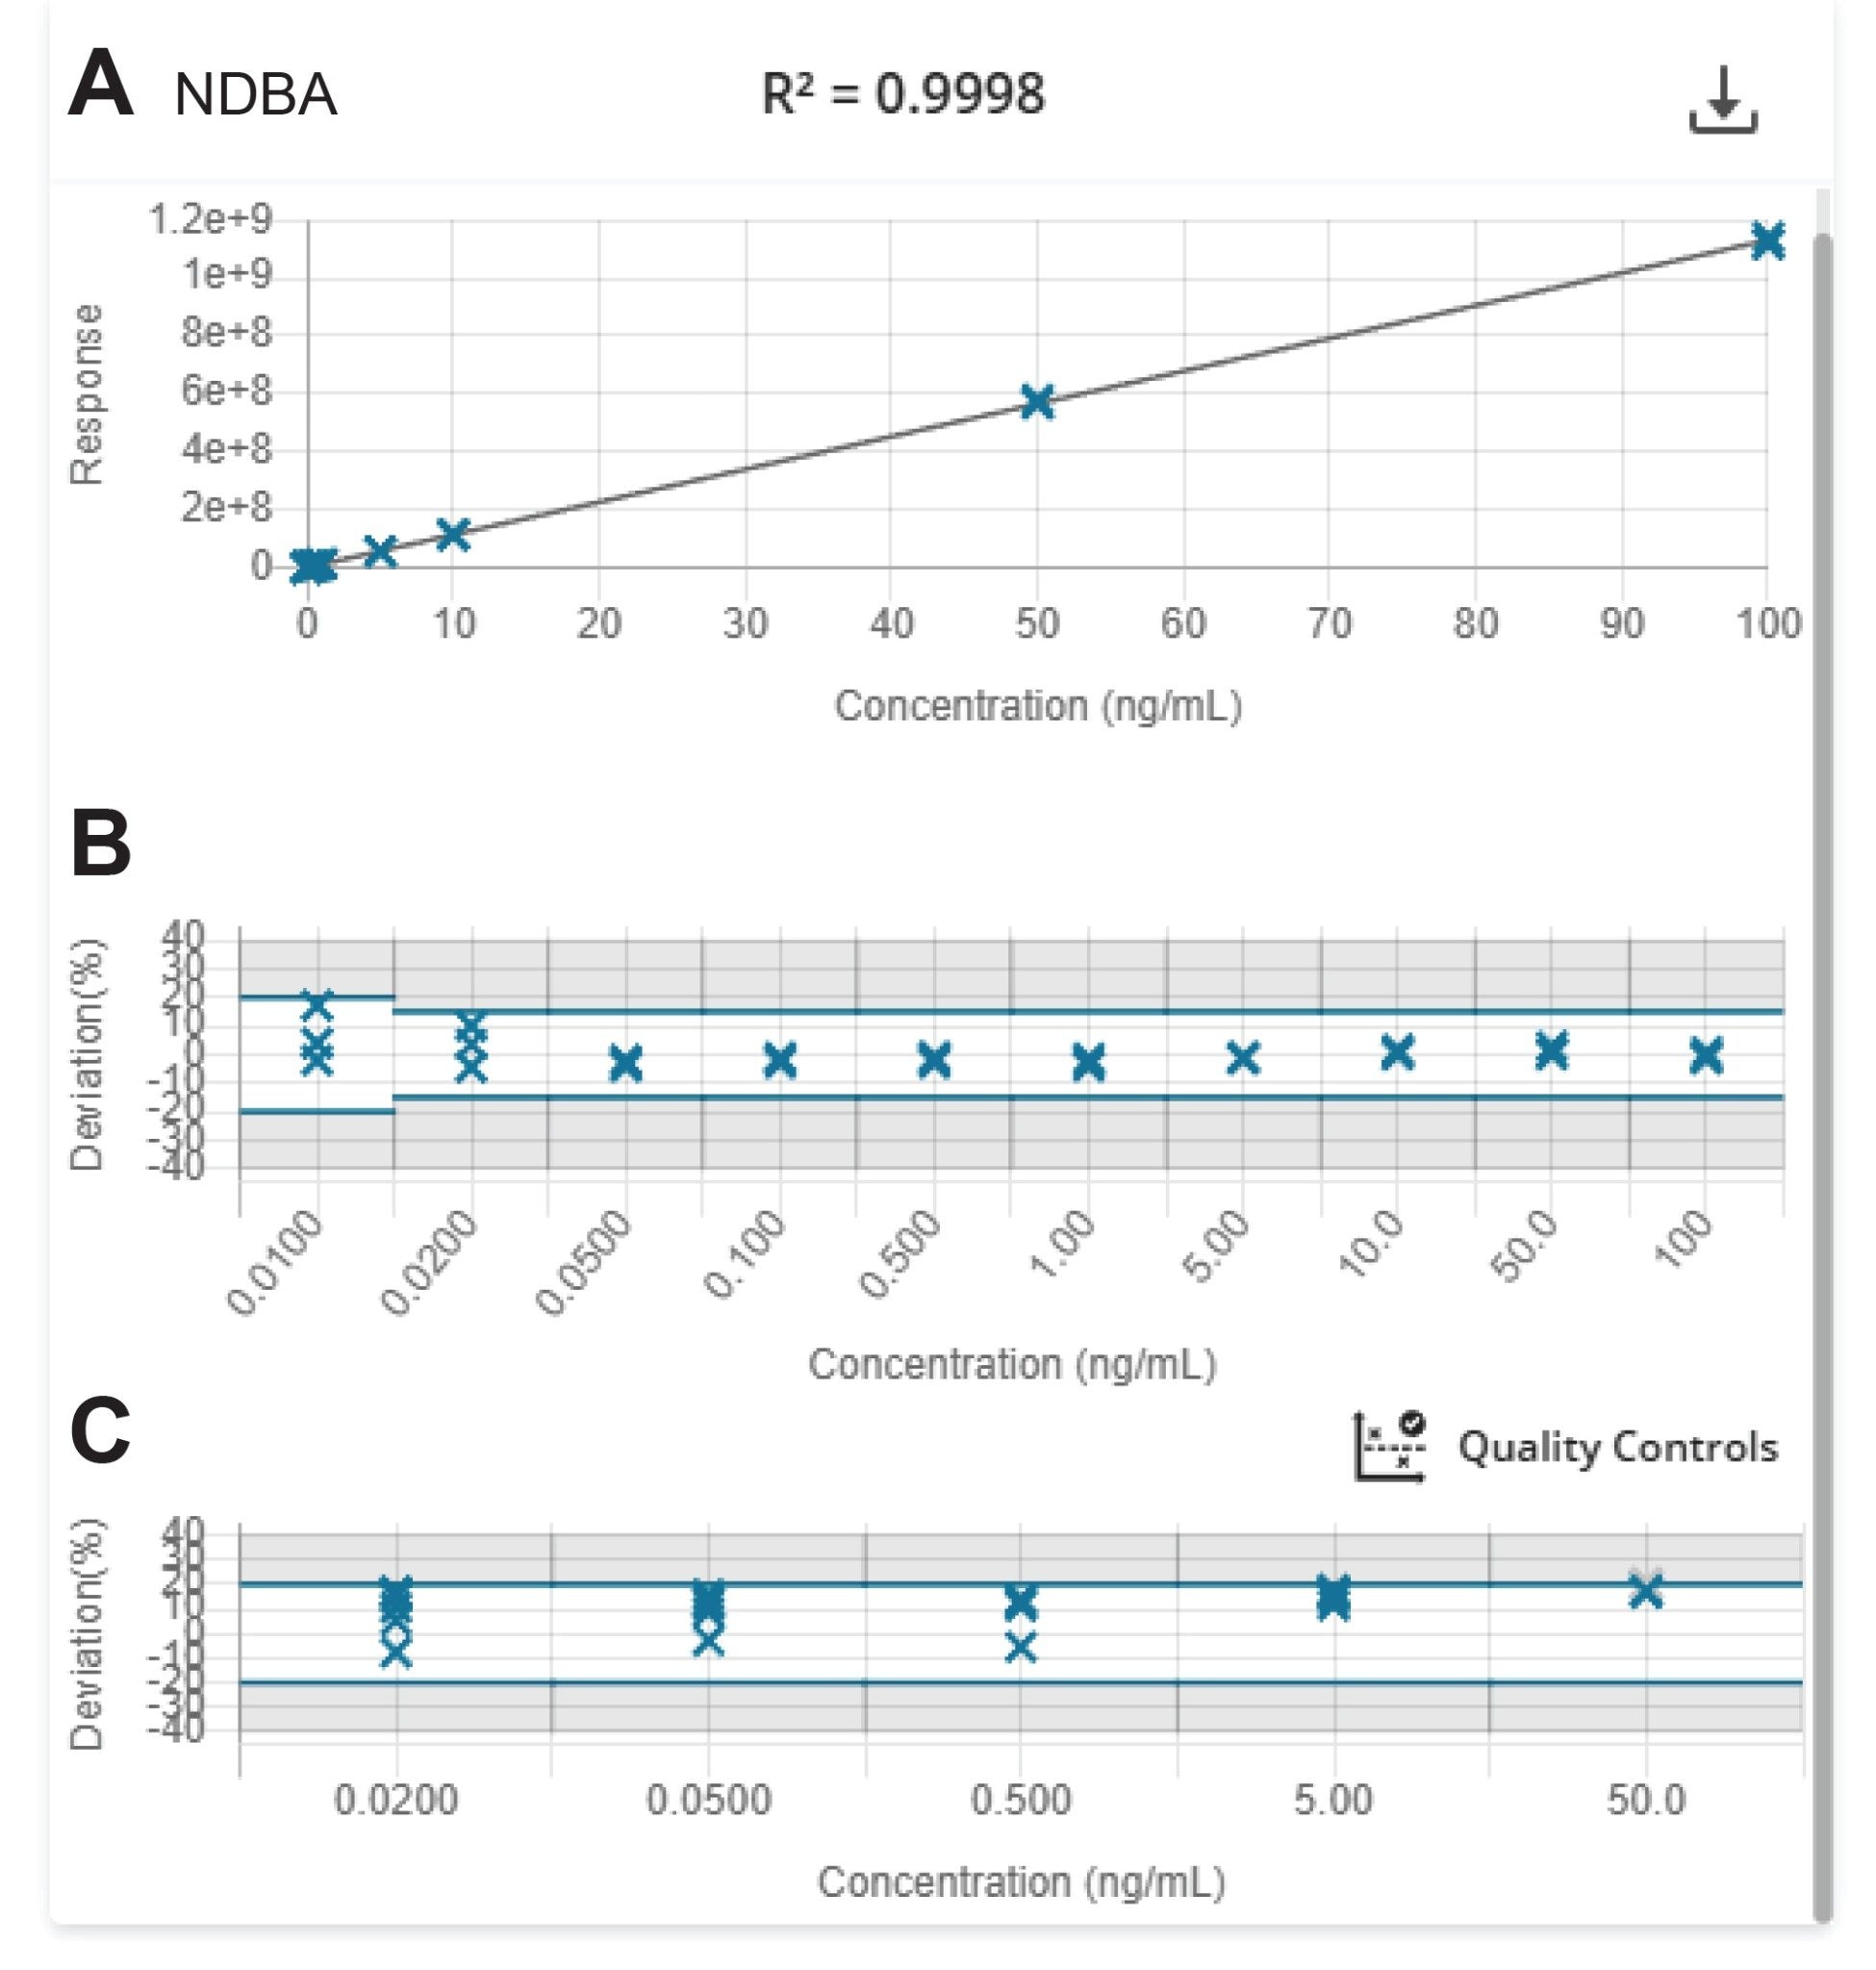
A weighted least squares regression model was used to establish the analyte concentration and peak area relationship. No internal standard was used.
Figure 8 shows an example of the calibration curve injected in triplicate for NDBA plotted with ten calibration points over the range 0.01–100 ng/ml in 0.9% NaCl (R2 0.9998, 1/x weighting) demonstrating four orders of linear dynamic range.
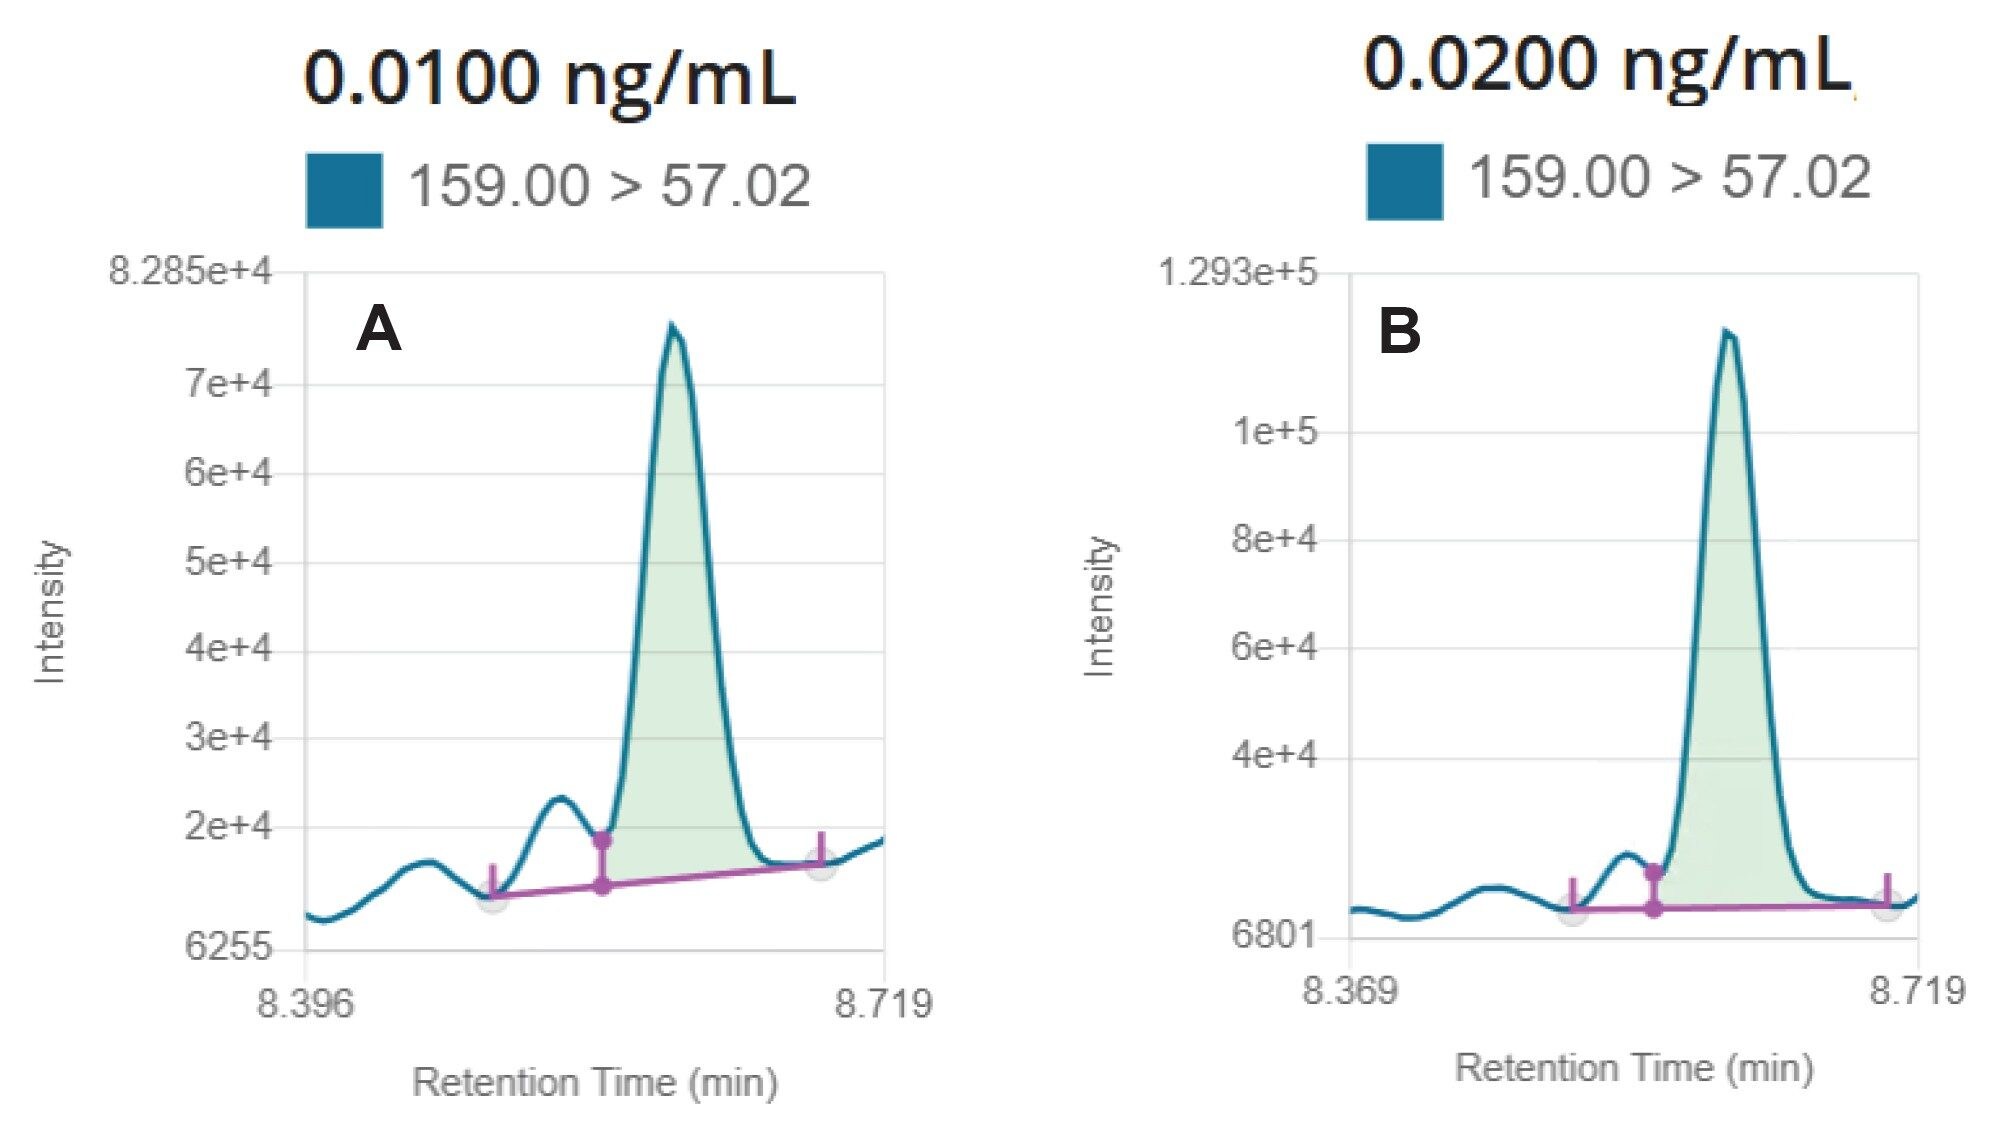
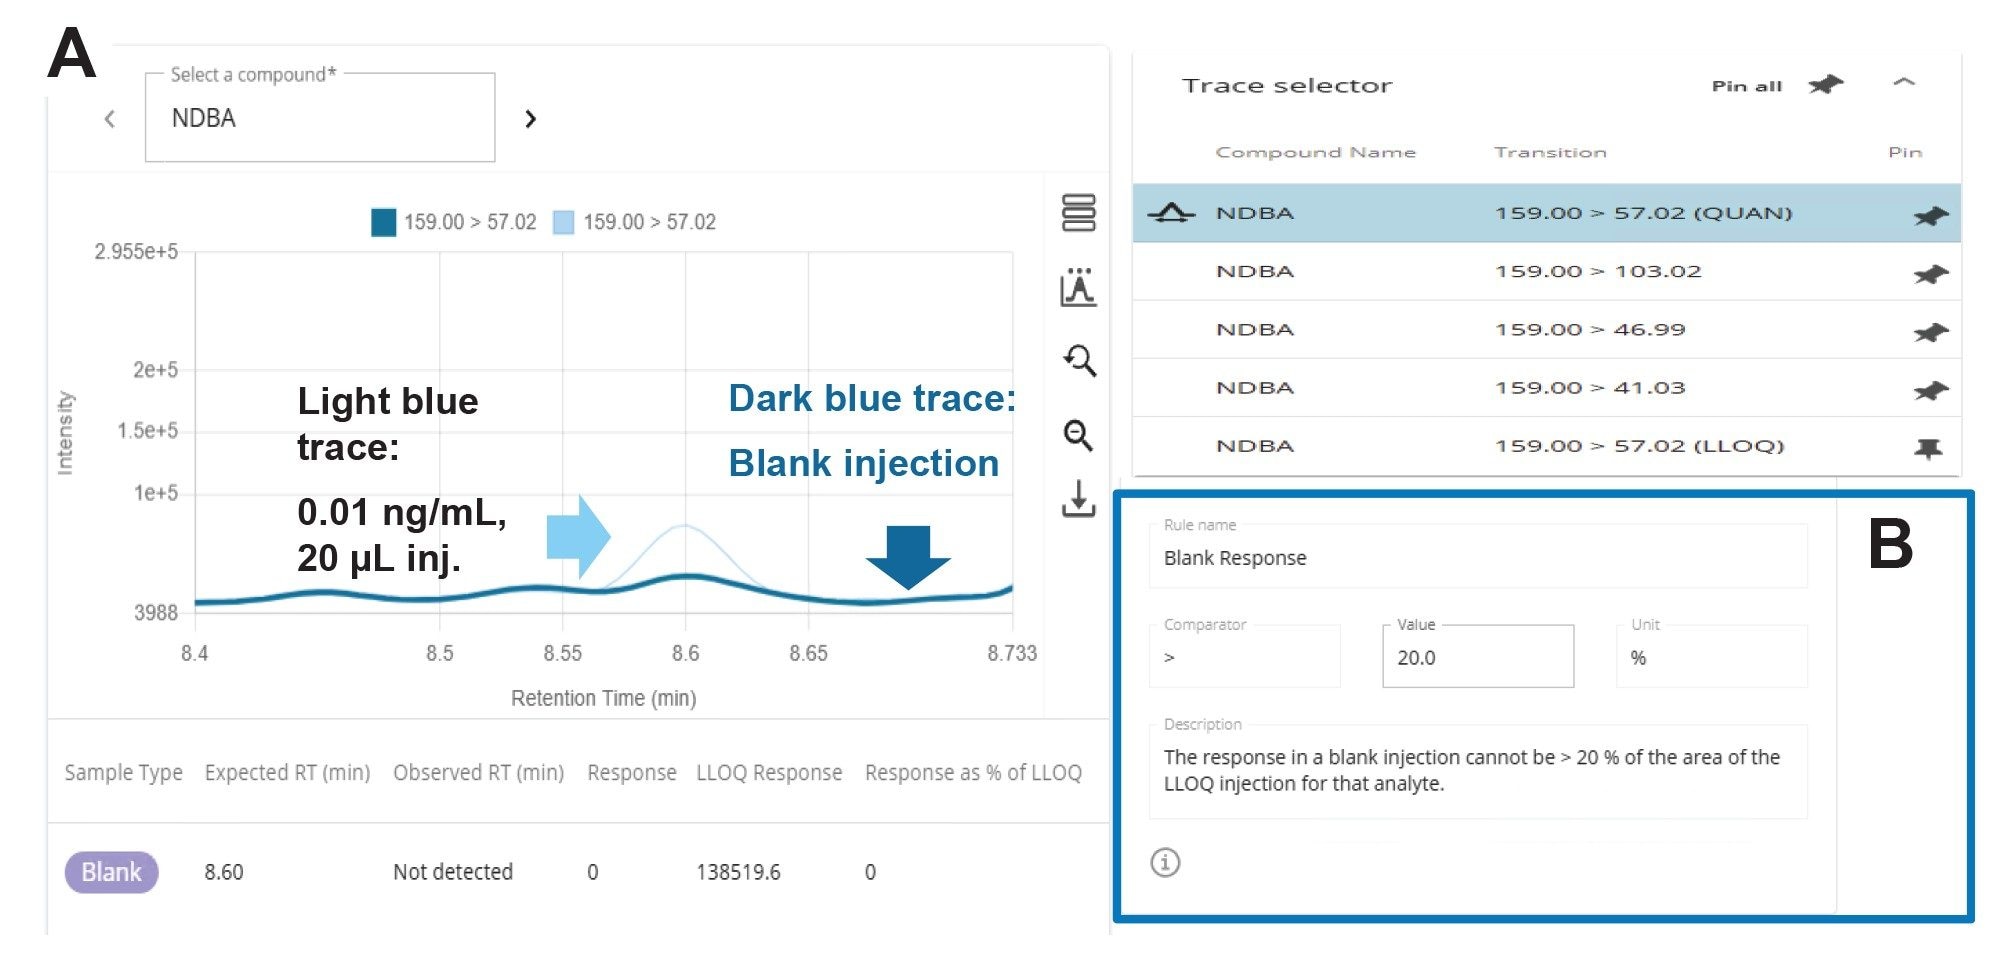
The lower limit of quantitation (LOQ) is shown in Figure 9, 0.01 ng/mL and the next calibration standard, 0.02 ng/mL, using a 20 µL injection. The blank response can be assessed using the Blank Review feature in the waters_connect MS Quan Application. For simple review, the lowest level calibration standard is superimposed with the matrix blank as shown in figure 10A. The maximum acceptable blank response expressed as a % of the LLOQ was set to <20% (Figure 9B).
All IV bags analyzed in the study tested negative for NDBA.
Conclusion
- The use of a delay column can aid in persistent system level background interference, helping achieve the lowest detection limits possible.
- The methodology described can be used to evaluate NDBA, NDEA, NDMA, NIEPA, NDPA, NDIPA, and NMBA in normal saline solution at trace levels.
- The method can perform with good precision and accuracy with minimal matrix effects.
- NDBA was not detected in any of the IV bags tested in the study.
- The Xevo TQ Absolute XR tandem quadrupole Mass Spectrometer generates high quality data for routine LC-MRM-based quantitation of NDBA in aqueous matrices, including normal saline solutions in IV infusion bag solutions, demonstrating low pg/mL levels of sensitivity and four orders of dynamic range.
This application note illustrates an analytical approach for the detection and quantitation of nitrosamines using Waters LC-MS/MS instrumentation. It is intended for informational purposes only and does not constitute regulatory guidance, toxicological assessment, or assurance of regulatory compliance. Laboratories are responsible for method validation and determining suitability for their specific regulatory and quality requirements.
References
- Moser, J.; Schlingemann, J.; Saal, C. N-Nitrosamines Impurities in Pharmaceuticals The Abrupt Challenges that Resulted, the Evolving Science, and the Regulatory Framework. Journal of Pharmaceutical Sciences. 2023, 112 (5), 1161–1162. DOI: https://doi.org/10.1016/j.xphs.2023.01.016.
- Teasdale, A.; Moser, J.; Ford, J. G.; Creasy, J. N. -Nitrosamines. In Mutagenic Impurities, Teasdale, A. Ed.; Wiley. 2021, pp 269–320.
- Bharate, S. S. Critical Analysis of Drug Product Recalls due to Nitrosamine Impurities. Journal of Medicinal Chemistry. 2021, 64 (6), 2923–2936. DOI: 10.1021/acs.jmedchem.0c02120.
- Schlingemann, J., et al. (2023). The Landscape of Potential Small and Drug Substance Related Nitrosamines in Pharmaceuticals. Journal of Pharmaceutical Sciences 112(5): 1287–1304.
- Holzgrabe, U. Nitrosated Active Pharmaceutical Ingredients - Lessons Learned? J Pharm Sci. 2023, 112 (5), 1210–1215. DOI: 10.1016/j.xphs.2023.01.021 From NLM.
- Control of Nitrosamine Impurities in Human Drugs | FDA.
- Scientific review on the risk of nitrosamine impurities in human medicines | European Medicines Agency (EMA).
- ICH M7(R2) Guideline on assessment and control of DNA reactive (mutagenic) impurities in pharmaceuticals to limit potential carcinogenic risk.
- August 18, 2025: Emerging Scientific and Technical Information on Leachable NDBA and Other Small-Molecule Nitrosamines in Infusion Bags.
- Karen Pieters. Testing of packaging systems for large volume parenteral extractables study Design and challenges.
- Golob, N., et al. Nitrocellulose blister material as a source of N-nitrosamine contamination of pharmaceutical drug products. International Journal of Pharmaceutics. 2022, 618: 121687.
- Twohig, M.; Wagh, P.; Maziarz, M.; Bartlett, A. Suggested Approaches for Minimizing Background Chemical Noise in Low Mass MRM Transitions for Trace Level Quantification of N-Nitrosamines. (2023), Waters Application Note. 720007992, July 2023.
- ACQUITY Premier HSS T3 Column | 186009468 | Waters
- Twohig, M. Identification and Quantitation of N-Nitrosamines in Normal Saline Intravenous Infusion bags using UPLC-MS/MS. Waters Application Note. 720009335, May 2026.
720009311, April 2026